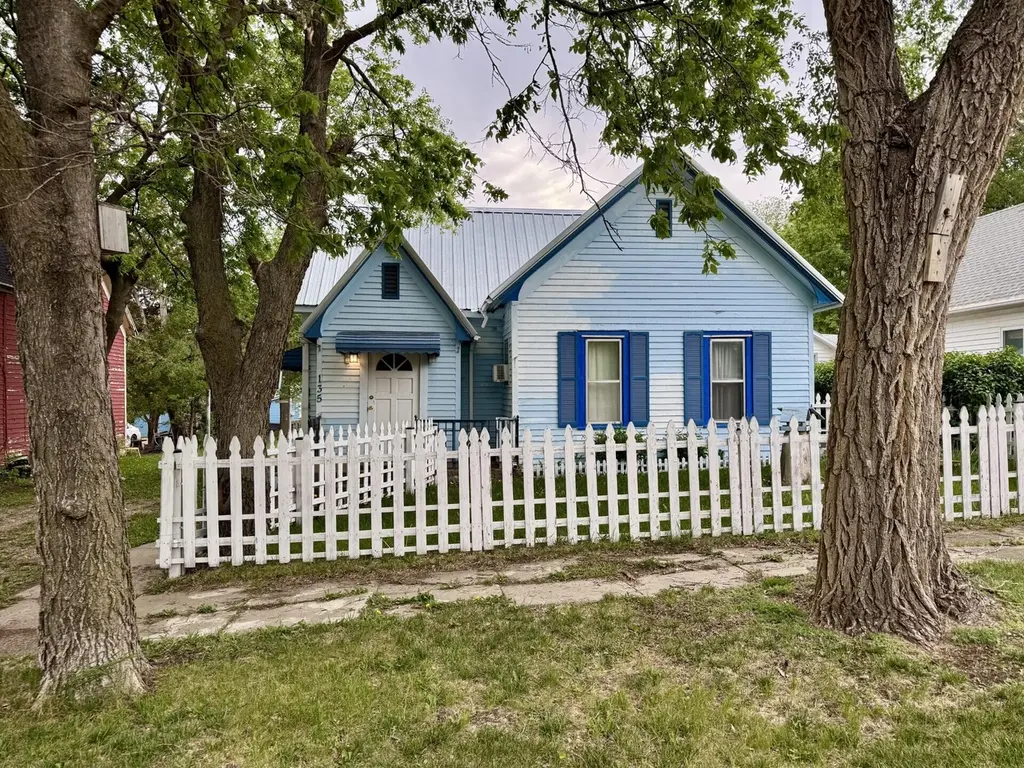
135 N 2nd Ave · Lake Andes, SD
Flood risk 1/10 · Minimal
- FEMA flood zone
- X (unshaded)
- Chance of flooding over 30 yrs
- 0.0%
- Est. flood insurance / yr
- $473 – $860
Fire risk 6/10 · Moderate
- Est. fire insurance / yr
- $1,342 – $2,492
Heat risk 3/10 · Minor
- Hot days now (above 103°F)
- 7 days/yr
- Hot days in 30 yrs
- 14 days/yr
Wind risk 2/10 · Minimal
- Chance of severe wind over 30 yrs
- —
Air-quality risk 2/10 · Minimal
- Unhealthy air days now
- 1 days/yr
- Unhealthy air days in 30 yrs
- 1 days/yr
Risk factors via First Street. Map © Google.
Why this score? — see what drove the B grade
The composite is a weighted blend of 9 inputs, each scored 0–100. Each bar is that input's sub-score; the figure is the points it added to the 100-point composite (weight × sub-score).
- Cash flow +30.0/30.0
- 1% rule +10.0/10.0
- DSCR +10.0/10.0
- ARV discount +7.5/15.0
- Appreciation +5.0/10.0
- Livability +3.1/5.0
- Schools +3.0/10.0
- Rent growth +2.5/5.0
- Condition / age +2.5/5.0
$60,000
🖨 Deal sheet 📄 Offer letter ✓ Due diligence
Key facts
- Small shed
- Fenced front yard
- 7,000 sq ft lot
Tags
Property features AI
Exterior
- Utilities: Public water; Public sewer
- Home design: Single-family residential; 1 story
- Construction: Frame construction with wood siding
- Exterior features: Metal roof
Interior
- Kitchen: Range, Oven, Refrigerator
- Bathrooms: 1 full bathroom
- Heating & cooling: Propane heating; Window cooling units; Ceiling fans
- Interior features: Range, Oven, Refrigerator
Neighborhood map
What this means for you Summary
Snapshot
- This is a 4-bed/1.0-bath single-family listed at $60k.
Deal economics
- At list price, monthly cash flow is $473 ($6k/yr) — positive.
- The deal already cash-flows at list — no discount required.
- Meets the 1% rule at list price ($1k rent vs $60k).
- Recommended offer: $59k (1.5% below list) — sets the bar for market timing.
Location & tenants
- Location reads 62/100 on livability (#221 in SD) — a middle-class / working-renter tenant base. Strengths: cost of living A+, housing A+; Watch: schools D+, employment D, crime F.
- Andes Central School District 11-1 (rural): math 30% / reading 35% proficiency, ranked #131 of 148 in SD (top 88%) — families likely to look elsewhere, expect single-tenant / working-renter base with shorter leases; 77% free/reduced lunch — lower-income household profile, screen leases tightly.
- Market conditions: 5 active listings in the ZIP; 19 units permitted in Charles Mix County in 2024 (0 in 5+ unit buildings).
Forward outlook
- In year one you build about $2k of equity ($415 loan paydown + $2k appreciation (3.0% local appreciation)).
- Charles Mix County population projected at +5% by 2050 — modest demand growth; plan on rents tracking national, not racing it.
- At projected returns (3.0% appreciation + 3.0% rent growth), your $17k cash investment doubles in ~3 years — after that, you're playing with house money.
Negotiation context
- It's been on market 28 days — a 2% lower offer ($59k) is reasonable based on typical stale-listing flexibility.
Risks & watch-outs
- Watch-outs: built in 1911 — expect roof / HVAC / electrical / plumbing capex.
- Climate carrying-cost: major wildfire risk — expect insurance premiums to compound above CPI over the hold.
Questions for the listing agent
- Built in 1911 — when were the roof, HVAC, electrical panel, plumbing, and water heater last replaced?
- Is there a deadline driving the sale (1031 exchange, divorce, estate, relocation)? That informs how much negotiation room exists.
- Schools are D-rated, which usually means shorter tenancies and higher turnover. Who's the typical renter profile here, and what's been the actual vacancy rate?
- Crime grade is F in this area — have there been break-ins, vandalism, or insurance claims at this property in the last 3 years? What carrier currently insures it and at what premium?
- What's the average days-on-market for RENTAL listings here right now (not sales)? A rising rental-DOM trend means longer vacancies and softer asking-rent achievability than the comps imply.
- What's the recent tenant-quality profile in this submarket — average credit score on applications, eviction rate, late-payment / NSF rate, and stable-employment percentage? A property-management company in the area should have these aggregated.
- How much new for-sale + rental construction is in the pipeline within 1–3 miles? Heavy new supply typically softens prices + rents 12–24 months out; constrained supply supports both.
Investment metrics
- 1% rule
- 1.87% ✓
- Cap rate
- 15.75%
- Cash-on-cash
- 33.78%
- DSCR
- 2.50
- GRM
- 4.5
CMA / ARV
- ARV (on-the-fly)
- $145,068
- Comps found
- 1
Show comp detail 1 sale within ~0.75 mi
| Address | Dist | Beds/Ba | Sqft | Sold | Price | $/sf | Match |
|---|---|---|---|---|---|---|---|
| 1155 School St | 0.70mi | 3/1.0 (-1) | 924 (0%) | 20mo | $145,000 | $157 | 45 |
Match score weights: distance 35% · size 25% · config 20% · recency 20%. Top-matched comps best support the ARV.
Projected returns pro-forma
3.0% appreciation · 3.0% rent growth · sell at horizon
- IRR
- 39.5%
- Equity multiple
- 3.22×
- Total profit
- $37,367
- Equity at exit
- $26,979
- IRR
- 39.5%
- Equity multiple
- 6.41×
- Total profit
- $90,840
- Equity at exit
- $41,577
Cash invested: $16,800 (down + closing). Projections, not guarantees.
Landlord ↔ Tenant lean methodology
- Overall (STATE)
- 83 Strongly Landlord-Friendly
- State South Dakota
- 83 Strongly Landlord-Friendly · R+16
- County
- — inherits STATE
- City
- — inherits STATE
ZIP-level market 57356
- Active inventory
- 5
- Price-to-rent
- 4.5×
Monthly cashflow live
- Estimated rent
- $1,124 medium interval (Pro) →
- Mortgage (P&I)
- −$315
- Tax est. 1.5%
- −$75 /mo · $900/yr
- Insurance
- −$25
- HOA
- −$0
- Vacancy / Maint / Mgmt
- −$236
- Net cashflow
- $473
Break-even live
UW: 25.0% down · 7.5% · 30yr · 1.5% tax · 5.0% vac · 8.0% maint · 8.0% mgmt
Financing live
Cash to close
- Down payment
- $15,000
- Closing costs
- $1,800
- Reserves months
- —
- Total cash needed
- —
Loan-product check · same deal, 3 products live
Conventional
25% down · 7.5% · 30yr
- Down + closing
- —
- Monthly P&I
- —
- Monthly cashflow
- —
- DSCR
- —
- Eligible?
- —
Personal DTI + credit; lowest rate.
DSCR
20% down · 8.5% · 30yr
- Down + closing
- —
- Monthly P&I
- —
- Monthly cashflow
- —
- DSCR
- —
- Eligible?
- —
No personal income docs; deal must DSCR.
Hard money
10% down · 12.0% · 12mo
- Down + closing
- —
- Monthly P&I
- —
- Monthly cashflow
- —
- DSCR
- —
- Eligible?
- —
Short-term bridge; refi at stabilization.
Listing history 15 events
-
2026-06-18days on market $60,000 Active 28 DOM
-
2026-06-17days on market $60,000 Active 27 DOM
-
2026-06-16days on market $60,000 Active 26 DOM
-
2026-06-15days on market $60,000 Active 25 DOM
-
2026-06-13days on market $60,000 Active 23 DOM
-
2026-06-12days on market $60,000 Active 22 DOM
-
2026-06-09days on market $60,000 Active 19 DOM
-
2026-06-08days on market $60,000 Active 18 DOM
-
2026-06-08days on market $60,000 Active 17 DOM
-
2026-06-05days on market $60,000 Active 15 DOM
-
2026-06-04days on market $60,000 Active 13 DOM
-
2026-06-02days on market $60,000 Active 12 DOM
-
2026-06-01days on market $60,000 Active 11 DOM
-
2026-05-31days on market $60,000 Active 10 DOM
-
2026-05-21$60,000 Active
ⓘ Source: listings_history table (triggers on properties + properties_extension) + one-shot
backfill from property_details.listing_events for pre-trigger history.
Climate risk First Street
- Flood 1/10 Low FEMA zone X (unshaded) · 0% chance over 30 yrs
- Wildfire 6/10 Major
- Heat 3/10 Moderate 7 d/yr ≥103°F today · 14 d/yr by 30 yrs out
- Wind 2/10 Low
- Air quality 2/10 Low 1 unhealthy d/yr today · 1 by 30 yrs out
Nearby sold comps map
Loading sold comps map…
Walkable amenities ~0.75 mi
Loading nearby amenities…
Taxation est. · year 1
- Rental income
- $13,482
- − Mortgage interest
- −$3,361
- − Property taxes
- −$900
- − Insurance
- −$300
- − Repairs & maintenance
- −$1,079
- − Management
- −$1,079
- − Depreciation
- −$1,745
- Taxable income
- $5,019
- Est. tax owed @ 24.0%
- −$1,205
- After-tax cash flow
- $4,471/yr
For passive investors: Depreciation is non-cash, so a rental often shows a tax loss while cash-flowing — sheltering income. Rental losses are passive: they offset passive income freely, and up to $25,000/yr can offset ordinary (W-2) income if you actively participate and your MAGI is under $100k (phasing out to $0 by $150k); unused losses carry forward. On sale, claimed depreciation is recaptured at up to 25%, and gains may owe capital-gains tax (a 1031 exchange can defer both). Figures are a year-1 estimate at your 24.0% rate — not tax advice; consult a CPA.
Schools (NCES district)
- District
- Andes Central School District 11-1
- NCES district ID
- 4639540
- Math proficiency
- 30% ▲ 5.00%
- Reading proficiency
- 35% ▬ 0.00%
- Median HH income
- $36,490
- Composite
- 29.71/100
- National rank
- #11737
- State rank
- #131 of 148 in SD
Livability — Lake Andes
- Score
- 62/100
- State rank
- #221
- US rank
- #17033
Category grades
Schools grade is shown separately in the Schools card above.
Census & demographics
- Census place
- Lake Andes, SD
- Population (ZIP)
- 2,021
Population outlook (Charles Mix County) Hauer SSP2
- Today (2025)
- 9,490 people
- By 2030
- 9,536 · +0.5%
- By 2040
- 9,723 · +2.5%
- By 2050
- 9,942 · +4.8%
- By 2075
- 11,384 · +20.0%
- By 2100
- 13,478 · +42.0%
Race, ethnicity, and origin ACS 2023
- Neighborhood character
- Highly diverse neighborhood (Simpson 0.82)
- Race & ethnicity
- Native American 44% White 42% Two or more races 13% Hispanic / Latino 4%
- Common ancestry
- Portuguese 2% Iranian 2% Lithuanian 2%
- Foreign-born
- 1%
Political lean MEDSL · Charles Mix
- 2024 margin
- Solid R (+42.9) · D 27.7% · R 70.6% · Other 1.8%
- 2008→2024 swing
- -35.3pp toward R · 2008: -7.6pp · 2024: -42.9pp
- All cycles
- 2024: R+42.9 2020: R+36.4 2016: R+42.1 2012: R+19.9 2008: R+7.6
Not yet ingested
- Civics
- —
Market trends
- HPI YoY
- —
- Current HPI
- —
- Rent YoY
- —
- Metro
- —
- State GDP YoY
- ▲ 0.70%
- F500 in state
- 2
Industry mix (Fortune 500 HQ in SD)
| Industry | F500 HQs | Revenue |
|---|---|---|
| Utilities | 1 | $1B |
|
||
Price history
1 event — show timeline
- 2026-05-21 Listed $60,000 MBOR
Cash-flow waterfall
monthlySold comps — $/sqft
last 12 mo · ≤1 miLoading sold comps…