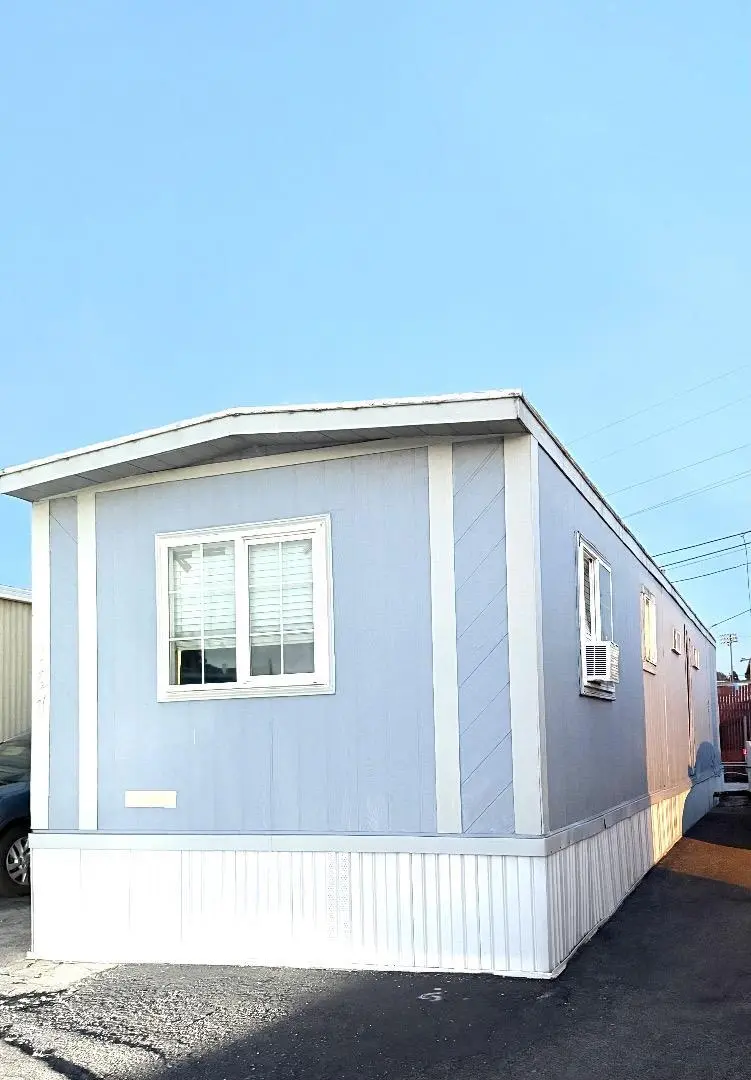
1500 Virginia Pl #127 · San Jose, CA
Flood risk 1/10 · Minimal
- FEMA flood zone
- X
- Chance of flooding over 30 yrs
- 0.0%
- Est. flood insurance / yr
- $507 – $1,088
Fire risk 1/10 · Minimal
- Est. fire insurance / yr
- $659 – $1,223
Heat risk 5/10 · Moderate
- Hot days now (above 93°F)
- 7 days/yr
- Hot days in 30 yrs
- 14 days/yr
Wind risk 1/10 · Minimal
- Chance of severe wind over 30 yrs
- —
Air-quality risk 9/10 · Severe
- Unhealthy air days now
- 17 days/yr
- Unhealthy air days in 30 yrs
- 17 days/yr
Risk factors via First Street. Map © Google.
Why this score? — see what drove the B+ grade
The composite is a weighted blend of 9 inputs, each scored 0–100. Each bar is that input's sub-score; the figure is the points it added to the 100-point composite (weight × sub-score).
- Cash flow +30.0/30.0
- ARV discount +11.6/15.0
- DSCR +10.0/10.0
- 1% rule +8.6/10.0
- Schools +5.5/10.0
- Rent growth +4.4/5.0
- Livability +3.9/5.0
- Condition / age +2.5/5.0
- Appreciation +0.0/10.0
$179,000
🖨 Deal sheet 📄 Offer letter ✓ Due diligence
Listing remarks MLS
Beautifully updated home in a prime San Jose location! Remodeled about one year ago with new flooring, fresh interior paint, upgraded kitchen cabinets, and a modern automatic toilet. Move-in ready and comes complete with essential furnishings, including a bed, table, refrigerator, and oven. Low space rent of just $1,018/month. An affordable and convenient opportunity in the heart of Silicon Valley dont miss it!
Key facts
- Move-in ready
- Remodeled
- Updated home
Tags
Neighborhood map
What this means for you Summary
Snapshot
- This is a 2-bed/1.0-bath manufactured listed at $179k.
Deal economics
- At list price, monthly cash flow is $684 ($8k/yr) — positive.
- The deal already cash-flows at list — no discount required.
- Meets the 1% rule at list price ($2k rent vs $179k).
- Recommended offer: $158k (12.0% below list) — sets the bar for market timing.
- Cap rate 10.9% vs local median 1.6% in San Jose — top-decile yield for the area; either an underpriced asset or a hidden risk that comps aren't pricing in. Stress-test before assuming the spread holds.
Location & tenants
- Location reads 78/100 on livability (#68 in CA, #2,559 nationally) — a middle-class / working-renter tenant base. Strengths: amenities A+, commute A+, employment A+; Watch: crime F, cost of living F.
- East Side Union High (urban): math 53% / reading 70% proficiency, ranked #69 of 517 in CA (top 13%) — acceptable for families but not a draw, mixed tenant base, ~2y average lease.
- Market conditions: Rents rising fast (+7.5%/yr); 67 active listings in the ZIP; 13 comparable units currently listed for rent nearby; rentals at typical pace (median 17d on market — plan ~3-4 weeks tenant-placement turnaround); solid renter incomes; 3,838 units permitted in Santa Clara County in 2024 (1,886 in 5+ unit buildings).
- This rent runs 34% of the median local income ($86k/yr) — at the standard rent-burdened threshold; future hikes will face affordability resistance.
Forward outlook
- Local home prices are declining (-3.0%/yr); year-one equity from $1k of loan paydown is wiped out by about $5k of value loss. Plan a longer hold.
- Santa Clara County population projected at +24% by 2050 — long-run rental-demand tailwind backs the buy-and-hold thesis.
- At projected returns (-3.0% appreciation + 7.5% rent growth), your $50k cash investment doubles in ~6 years — after that, you're playing with house money.
Negotiation context
- It's been on market 204 days — a 12% lower offer ($158k) is reasonable based on typical stale-listing flexibility.
- 3 sale attempts since 10y ago; this cycle's ask has dropped $20k (10%) from the opening price — seller is motivated, your offer sets the floor, not the list.
- Current owner paid $89k; list at $179k implies a 101% gain — meaningful room to come down on a strong offer.
Risks & watch-outs
- Climate carrying-cost: extreme-heat days projected 7→14/yr by 2055 (HVAC capex compounding) — expect insurance premiums to compound above CPI over the hold.
Questions for the listing agent
- It's been on market 204 days. Have you received any prior offers? Is the seller open to a 12% concession, seller financing, or rate buy-down credit?
- Why hasn't it sold? Are there any deal-killer items the seller is aware of (foundation, flood, title, zoning, code violations)?
- Is there a deadline driving the sale (1031 exchange, divorce, estate, relocation)? That informs how much negotiation room exists.
- Crime grade is F in this area — have there been break-ins, vandalism, or insurance claims at this property in the last 3 years? What carrier currently insures it and at what premium?
- What's the average days-on-market for RENTAL listings here right now (not sales)? A rising rental-DOM trend means longer vacancies and softer asking-rent achievability than the comps imply.
- What's the recent tenant-quality profile in this submarket — average credit score on applications, eviction rate, late-payment / NSF rate, and stable-employment percentage? A property-management company in the area should have these aggregated.
- How much new for-sale + rental construction is in the pipeline within 1–3 miles? Heavy new supply typically softens prices + rents 12–24 months out; constrained supply supports both.
Investment metrics
- 1% rule
- 1.36% ✓
- Cap rate
- 10.88%
- Cash-on-cash
- 16.38%
- DSCR
- 1.73
- GRM
- 6.1
CMA / ARV
- ARV (median comp)
- $197,042
- List price
- $179,000
- Delta
- -9.16%
- Verdict
- FAIR
- Comps
- 5 within 1.0 mi
Show comp detail 5 sales within ~0.75 mi
| Address | Dist | Beds/Ba | Sqft | Sold | Price | $/sf | Match |
|---|---|---|---|---|---|---|---|
| 655 S 34th St #15 | 0.04mi | 3/2.0 (+1) | 600 (+4%) | 10mo | $215,000 | $358 | 74 |
| 661 Bonita Ave #12 | 0.21mi | 2/1.0 | 624 (+8%) | 13mo | $230,000 | $369 | 66 |
| 540 Bonita #719 | 0.25mi | 2/1.0 | 648 (+12%) | 13mo | $285,000 | $440 | 56 |
| 1300 E San Antonio St #85 | 0.54mi | 1/1.0 (-1) | 550 (-4%) | 7mo | $135,000 | $245 | 56 |
| 1300 E San Antonio St #55 | 0.54mi | 1/1.0 (-1) | 550 (-4%) | 10mo | $110,000 | $200 | 54 |
Match score weights: distance 35% · size 25% · config 20% · recency 20%. Top-matched comps best support the ARV.
Projected returns pro-forma
-3.0% appreciation · 7.54% rent growth · sell at horizon
- IRR
- 12.5%
- Equity multiple
- 1.52×
- Total profit
- $26,208
- Equity at exit
- $26,689
- IRR
- 24.7%
- Equity multiple
- 3.62×
- Total profit
- $131,420
- Equity at exit
- $15,477
Cash invested: $50,120 (down + closing). Projections, not guarantees.
Landlord ↔ Tenant lean methodology
- Overall (CITY)
- 0 Strongly Tenant-Friendly
- State California
- 18 Strongly Tenant-Friendly · D+13
- County
- — inherits STATE
- City San Jose
- 0 Strongly Tenant-Friendly · D+24
ZIP-level market 95116
- Rents YoY
- 7.5%
- Active inventory
- 67
- Price-to-rent
- 6.1×
Monthly cashflow live
- Estimated rent
- $2,432 high interval (Pro) →
- Mortgage (P&I)
- −$939
- Tax est. 1.5%
- −$224 /mo · $2,685/yr
- Insurance
- −$75
- HOA
- −$0
- Vacancy / Maint / Mgmt
- −$511
- Net cashflow
- $684
Break-even live
UW: 25.0% down · 7.5% · 30yr · 1.5% tax · 5.0% vac · 8.0% maint · 8.0% mgmt
Financing live
Cash to close
- Down payment
- $44,750
- Closing costs
- $5,370
- Reserves months
- —
- Total cash needed
- —
Loan-product check · same deal, 3 products live
Conventional
25% down · 7.5% · 30yr
- Down + closing
- —
- Monthly P&I
- —
- Monthly cashflow
- —
- DSCR
- —
- Eligible?
- —
Personal DTI + credit; lowest rate.
DSCR
20% down · 8.5% · 30yr
- Down + closing
- —
- Monthly P&I
- —
- Monthly cashflow
- —
- DSCR
- —
- Eligible?
- —
No personal income docs; deal must DSCR.
Hard money
10% down · 12.0% · 12mo
- Down + closing
- —
- Monthly P&I
- —
- Monthly cashflow
- —
- DSCR
- —
- Eligible?
- —
Short-term bridge; refi at stabilization.
Rent comps 13 comps
| Address | Beds | Baths | Sqft | Rent | $/sqft | DOM | Units | Dist |
|---|---|---|---|---|---|---|---|---|
| 55 S 33rd St Unit 57B San Jose, CA | 1.0 | 1.0 | 600 | $1,900 | $3.17 | 17d | 1 | 0.57mi |
| 374 S 21st St Unit 2 San Jose, CA | 2.0 | 2.0 | 749 | $3,199 | $4.27 | 43d | 1 | 0.69mi |
| 1390 E Santa Clara St San Jose, CA | 1.0 | 1.0 | 469 | $2,298 | $4.90 | 21d | 1 | 0.70mi |
| 1390 E Santa Clara St San Jose, CA | 1.0 | 1.0 | 429 | $2,298 | $5.36 | 43d | 1 | 0.70mi |
| 1150 McLaughlin Ave San Jose, CA | 1.0 | 1.0 | 530 | $1,698 | $3.20 | 1d | 1 | 0.75mi |
| 93 N 26th St Unit 95A San Jose, CA | 1.0 | 1.0 | 600 | $2,300 | $3.83 | 43d | 1 | 0.88mi |
| 710 E San Fernando St Unit 2 San Jose, CA | 1.0 | 1.0 | 500 | $2,195 | $4.39 | 17d | 1 | 1.19mi |
| 2340 Lendrum Ave San Jose, CA | 2.0 | 1.0 | 735 | $2,900 | $3.95 | 3d | 1 | 1.25mi |
| 399 Court San Jose, CA | 1.0 | 1.0 | 637 | $1,699 | $2.67 | 43d | 1 | 1.26mi |
| 2050 McKee Rd San Jose, CA | 1.0–2.0 | 1.0 | 734 | $3,629 | $4.94 | 1d | 7 | 1.29mi |
| 382 S 10th St Unit B San Jose, CA | 1.0 | 1.0 | 400 | $1,795 | $4.49 | 12d | 1 | 1.41mi |
| 524 S 9th St San Jose, CA | 2.0 | 1.0 | 305 | $1,995 | $6.54 | 21d | 1 | 1.46mi |
| 2555 Alum Rock Ave San Jose, CA | 1.0–2.0 | 1.0 | 620 | $2,116 | $3.41 | 1d | 1 | 1.47mi |
Listing history 14 events
-
2026-06-05days on market $179,000 Active 204 DOM
-
2026-06-03days on market $179,000 Active 203 DOM
-
2026-06-02days on market $179,000 Active 202 DOM
-
2026-06-01days on market $179,000 Active 201 DOM
-
2026-05-31days on market $179,000 Active 200 DOM
-
2026-05-07price $179,000 414-char remark
Show marketing remark (414 chars)
Beautifully updated home in a prime San Jose location! Remodeled about one year ago with new flooring, fresh interior paint, upgraded kitchen cabinets, and a modern automatic toilet. Move-in ready and comes complete with essential furnishings, including a bed, table, refrigerator, and oven. Low space rent of just $1,018/month. An affordable and convenient opportunity in the heart of Silicon Valley dont miss it!
-
2026-01-14price $195,000 414-char remark
Show marketing remark (414 chars)
Beautifully updated home in a prime San Jose location! Remodeled about one year ago with new flooring, fresh interior paint, upgraded kitchen cabinets, and a modern automatic toilet. Move-in ready and comes complete with essential furnishings, including a bed, table, refrigerator, and oven. Low space rent of just $1,018/month. An affordable and convenient opportunity in the heart of Silicon Valley dont miss it!
-
2025-11-13$199,000 Active 414-char remark
Show marketing remark (414 chars)
Beautifully updated home in a prime San Jose location! Remodeled about one year ago with new flooring, fresh interior paint, upgraded kitchen cabinets, and a modern automatic toilet. Move-in ready and comes complete with essential furnishings, including a bed, table, refrigerator, and oven. Low space rent of just $1,018/month. An affordable and convenient opportunity in the heart of Silicon Valley dont miss it!
-
2016-03-02soldstatus $89,000 Sold 222-char remark
Show marketing remark (222 chars)
* * * Very Nice 1986 home with 2 bedrooms 1 full bath. Refrigerator, washer, dryer included. .. Wood floor through out. .. all double pane windows. .reset lights. .. beautiful moldings. .lots of upgrades. . low rent $751
-
2016-02-08status Pending (Do Not Show) 222-char remark
Show marketing remark (222 chars)
* * * Very Nice 1986 home with 2 bedrooms 1 full bath. Refrigerator, washer, dryer included. .. Wood floor through out. .. all double pane windows. .reset lights. .. beautiful moldings. .lots of upgrades. . low rent $751
-
2016-01-07$89,000 Active 222-char remark
Show marketing remark (222 chars)
* * * Very Nice 1986 home with 2 bedrooms 1 full bath. Refrigerator, washer, dryer included. .. Wood floor through out. .. all double pane windows. .reset lights. .. beautiful moldings. .lots of upgrades. . low rent $751
ⓘ Source: listings_history table (triggers on properties + properties_extension) + one-shot
backfill from property_details.listing_events for pre-trigger history.
Climate risk First Street
- Flood 1/10 Low FEMA zone X · 0% chance over 30 yrs
- Wildfire 1/10 Low
- Heat 5/10 Major 7 d/yr ≥93°F today · 14 d/yr by 30 yrs out
- Wind 1/10 Low
- Air quality 9/10 Extreme 17 unhealthy d/yr today · 17 by 30 yrs out
Nearby sold comps map
Loading sold comps map…
Walkable amenities ~0.75 mi
Loading nearby amenities…
Taxation est. · year 1
- Rental income
- $29,180
- − Mortgage interest
- −$10,027
- − Property taxes
- −$2,685
- − Insurance
- −$895
- − Repairs & maintenance
- −$2,334
- − Management
- −$2,334
- − Depreciation
- −$5,207
- Taxable income
- $5,697
- Est. tax owed @ 24.0%
- −$1,367
- After-tax cash flow
- $6,840/yr
For passive investors: Depreciation is non-cash, so a rental often shows a tax loss while cash-flowing — sheltering income. Rental losses are passive: they offset passive income freely, and up to $25,000/yr can offset ordinary (W-2) income if you actively participate and your MAGI is under $100k (phasing out to $0 by $150k); unused losses carry forward. On sale, claimed depreciation is recaptured at up to 25%, and gains may owe capital-gains tax (a 1031 exchange can defer both). Figures are a year-1 estimate at your 24.0% rate — not tax advice; consult a CPA.
Schools (NCES district)
- District
- East Side Union High
- NCES district ID
- 0611820
- Math proficiency
- 53% ▲ 12.00%
- Reading proficiency
- 70% ▲ 8.00%
- Median HH income
- $80,293
- Composite
- 55.15/100
- National rank
- #1278
- State rank
- #69 of 517 in CA
Livability — San Jose
- Score
- 78/100
- State rank
- #68
- US rank
- #2559
Category grades
Schools grade is shown separately in the Schools card above.
Census & demographics
- Census place
- San Jose, CA
- County
- Santa Clara County · 1,806,974 people
- City population
- 954,479
- Metro
- San Jose-Sunnyvale-Santa Clara, CA
- Population (ZIP)
- 48,042
- Household income
- $85,818
- Rent vs Own
- Severe rent burden
- 2058.0
Population outlook (Santa Clara County) Hauer SSP2
- Today (2025)
- 2,179,074 people
- By 2030
- 2,301,297 · +5.6%
- By 2040
- 2,528,195 · +16.0%
- By 2050
- 2,712,135 · +24.5%
- By 2075
- 2,998,701 · +37.6%
- By 2100
- 2,931,429 · +34.5%
Race, ethnicity, and origin ACS 2023
- Neighborhood character
- Diverse neighborhood (Simpson 0.56)
- Race & ethnicity
- Hispanic / Latino 59% Asian 29% Two or more races 22% White 8% Native American 2% Black 2%
- Hispanic origin (detail)
- Mexican 55%
- Common ancestry
- Russian 2% Slovak 1% Subsaharan African 1%
- Foreign-born
- 48% · Canada, Vietnam, China
- Languages at home
- 22% English-only · Spanish 49% Vietnamese 12% Tagalog/Filipino 6%
Political lean MEDSL · Santa Clara
- 2024 margin
- Solid D (+40.0) · D 68.1% · R 28.1% · Other 3.8%
- 2008→2024 swing
- -0.9pp no change · 2008: 40.9pp · 2024: 40.0pp
- All cycles
- 2024: D+40.0 2020: D+47.4 2016: D+52.5 2012: D+42.1 2008: D+40.9
Not yet ingested
- Civics
- —
Market trends
- HPI YoY
- ▼ -623.43%
- Current HPI
- 352.328
- Rent YoY
- ▲ 7.54%
- Metro
- San Jose-Sunnyvale-Santa Clara, CA
- State GDP YoY
- ▲ 3.21%
- F500 in state
- 116
Industry mix (Fortune 500 HQ in CA)
| Industry | F500 HQs | Revenue |
|---|---|---|
| Technology | 27 | $1,492B |
|
||
| Financial Services | 3 | $174B |
|
||
| Retail | 3 | $44B |
|
||
| Insurance | 3 | $26B |
|
||
| Media / Entertainment | 2 | $115B |
|
||
| Pharmaceuticals / Biotech | 2 | $62B |
|
||
Price history
+101.1% since first listed9 events — show timeline
- 2026-05-07 Price Changed $179,000 bridgeMLS, Bay East AOR, or Contra Costa AOR
- 2026-05-07 Price Changed $179,000 MLSListings
- 2026-01-14 Price Changed $195,000 bridgeMLS, Bay East AOR, or Contra Costa AOR
- 2026-01-14 Price Changed $195,000 MLSListings
- 2025-11-13 Listed $199,000 bridgeMLS, Bay East AOR, or Contra Costa AOR
- 2025-11-13 Listed $199,000 MLSListings
- 2016-03-02 Sold (MLS) $89,000 MLSListings
- 2016-02-08 Pending — MLSListings
- 2016-01-07 Listed $89,000 MLSListings
Cash-flow waterfall
monthlySold comps — $/sqft
last 12 mo · ≤1 miLoading sold comps…