13691 Gavina Ave #566 · Los Angeles, CA
Flood risk 1/10 · Minimal
- FEMA flood zone
- X (unshaded)
- Chance of flooding over 30 yrs
- 0.0%
- Est. flood insurance / yr
- $507 – $1,088
Fire risk 8/10 · Major
- Est. fire insurance / yr
- $659 – $1,223
Heat risk 6/10 · Moderate
- Hot days now (above 97°F)
- 9 days/yr
- Hot days in 30 yrs
- 25 days/yr
Wind risk 1/10 · Minimal
- Chance of severe wind over 30 yrs
- —
Air-quality risk 7/10 · Major
- Unhealthy air days now
- 13 days/yr
- Unhealthy air days in 30 yrs
- 16 days/yr
Risk factors via First Street. Map © Google.
Why this score? — see what drove the D+ grade
The composite is a weighted blend of 9 inputs, each scored 0–100. Each bar is that input's sub-score; the figure is the points it added to the 100-point composite (weight × sub-score).
- Cash flow +23.2/30.0
- DSCR +7.4/10.0
- 1% rule +6.0/10.0
- Schools +3.6/10.0
- Livability +3.4/5.0
- Rent growth +2.5/5.0
- Condition / age +2.2/5.0
- ARV discount +0.0/15.0
- Appreciation +0.0/10.0
$350,000
🖨 Deal sheet 📄 Offer letter ✓ Due diligence
Listing remarks MLS
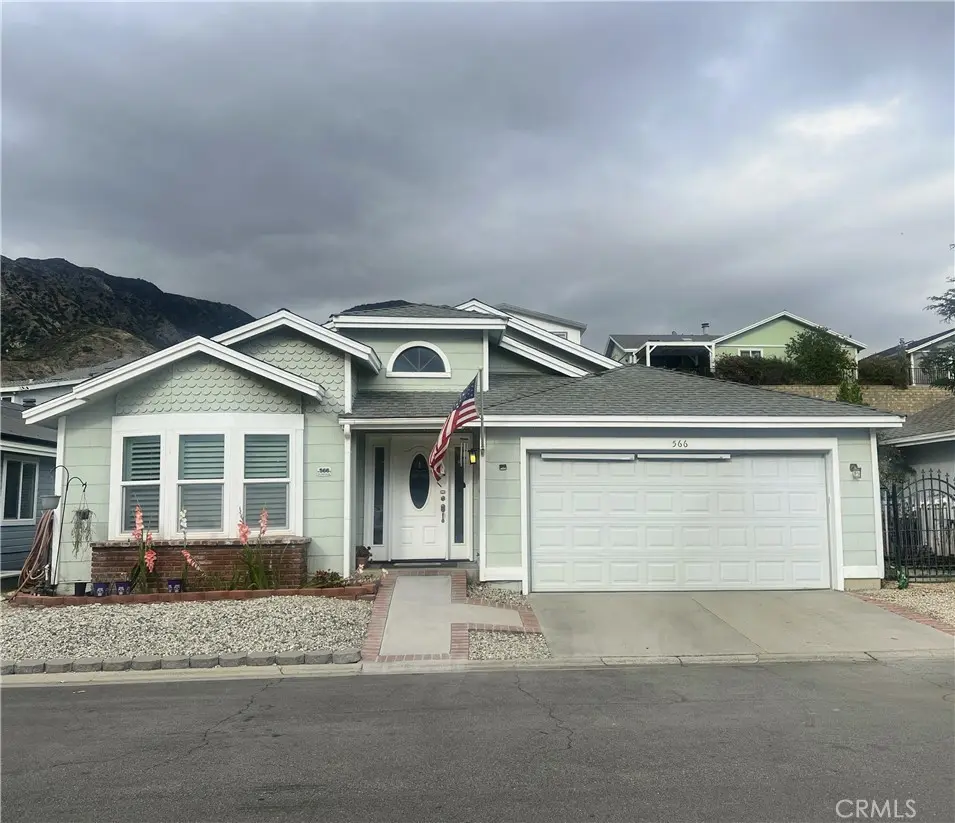
Discover this epitome of modern living nestled in a serene, mountainous Sylmar community. Don't miss this opportunity to make this 3-bedroom, 2-bathroom manufactured home, boasting a spacious 1624 square feet your own. With its generous layout, modern amenities, and unbeatable location, it's the perfect place to create a lifetime of memories. This home is complemented by a larger than average kitchen with a center island, attached 2-car garage, laundry room, and an outdoor patio for entertaining friends or just relaxing. Other amenities include a community pool, 2 jacuzzis, a fenced play yard for children, gazebos, picnic area, and athletic courts. Santiago Estates is a quiet neighborhood of homes with wonderful neighbors. This is the opportunity to make this one your's!
Key facts
- Guest parking
- Breakfast nook
- Mountain views
Tags
Property features AI
Finance
- Other: Pets allowed; Mountainous community setting
- Financial info: Monthly land lease payment (seller-provided amount)
- HOA & community: Park name: Santiago Estates; Rent includes pool; Land lease applies (monthly)
Exterior
- Parking: Attached 2-car garage; 2 total parking spaces
- Utilities: Public sewer; District/public water
- Home design: Single-story property; Mobile home remains on site
- Construction: Year built per public records
- Exterior features: Community pool; Yard
Interior
- Kitchen: Refrigerator; Gas range
- Bathrooms: 2 full bathrooms
- Heating & cooling: Central furnace heating; Central cooling
- Interior features: Formal entry; One-level home with front entry; Laundry room
- Laundry & utility: Dedicated laundry room
Neighborhood map
What this means for you Summary
Snapshot
- This is a 3-bed/2.0-bath manufactured listed at $350k. Condition is rated fair.
Deal economics
- At list price, monthly cash flow is $631 ($8k/yr) — positive.
- The deal already cash-flows at list — no discount required.
- Meets the 1% rule at list price ($4k rent vs $350k).
- Recommended offer: $345k (1.5% below list) — sets the bar for market timing.
- Cap rate 8.5% vs local median 2.1% in Los Angeles — top-decile yield for the area; either an underpriced asset or a hidden risk that comps aren't pricing in. Stress-test before assuming the spread holds.
Location & tenants
- Location reads 68/100 on livability (#273 in CA) — a middle-class / working-renter tenant base. Strengths: amenities A+, commute A+, employment B; Watch: health & safety C-, schools D+, crime F.
- Los Angeles Unified (urban): math 29% / reading 54% proficiency, ranked #223 of 517 in CA (top 43%) — families likely to look elsewhere, expect single-tenant / working-renter base with shorter leases; 67% free/reduced lunch — lower-income household profile, screen leases tightly.
- Market conditions: Rents flat; 183 active listings in the ZIP; 6 comparable units currently listed for rent nearby; rentals at typical pace (median 15d on market — plan ~3-4 weeks tenant-placement turnaround); solid renter incomes; 19,697 units permitted in Los Angeles County in 2024 (9,426 in 5+ unit buildings).
- At $3,861/mo this rent would consume 47% of the median local household income ($98k/yr) (locally 2559% of renters already pay >50% of income on rent) — very limited rent-growth headroom before tenants either downsize or default.
Forward outlook
- Local home prices are declining (-3.0%/yr); year-one equity from $2k of loan paydown is wiped out by about $10k of value loss. Plan a longer hold.
- Los Angeles County population projected at +9% by 2050 — modest demand growth; plan on rents tracking national, not racing it.
Negotiation context
- It's been on market 22 days — a 2% lower offer ($345k) is reasonable based on typical stale-listing flexibility.
- 2 sale attempts since 2y ago with the ask held roughly flat each time — persistent listings suggest the price (not the market) is what's stuck; bring a comps-based counter.
Risks & watch-outs
- Climate carrying-cost: severe wildfire risk; extreme-heat days projected 9→25/yr by 2055 (HVAC capex compounding) — expect insurance premiums to compound above CPI over the hold.
Questions for the listing agent
- Have any recent inspections been done? Can we get a copy of the seller's disclosures and any deferred-maintenance estimates?
- Is there a deadline driving the sale (1031 exchange, divorce, estate, relocation)? That informs how much negotiation room exists.
- Schools are D-rated, which usually means shorter tenancies and higher turnover. Who's the typical renter profile here, and what's been the actual vacancy rate?
- Crime grade is F in this area — have there been break-ins, vandalism, or insurance claims at this property in the last 3 years? What carrier currently insures it and at what premium?
- The area grade is low — what's the realistic commute time and amenity access for the typical tenant pool here? Any planned neighborhood developments (good or bad) we should know about?
- What's the average days-on-market for RENTAL listings here right now (not sales)? A rising rental-DOM trend means longer vacancies and softer asking-rent achievability than the comps imply.
- What's the recent tenant-quality profile in this submarket — average credit score on applications, eviction rate, late-payment / NSF rate, and stable-employment percentage? A property-management company in the area should have these aggregated.
- How much new for-sale + rental construction is in the pipeline within 1–3 miles? Heavy new supply typically softens prices + rents 12–24 months out; constrained supply supports both.
Investment metrics
- 1% rule
- 1.10% ✓
- Cap rate
- 8.46%
- Cash-on-cash
- 7.73%
- DSCR
- 1.34
- GRM
- 7.6
CMA / ARV
- ARV (on-the-fly)
- $300,048
- Comps found
- 6
Show comp detail 6 sales within ~0.75 mi
| Address | Dist | Beds/Ba | Sqft | Sold | Price | $/sf | Match |
|---|---|---|---|---|---|---|---|
| 13691 Gavina #609 | 0.00mi | 3/2.0 | 1,624 (+2%) | 1mo | $170,000 | $105 | 96 |
| 13691 Gavina Ave #576 | 0.00mi | 3/2.0 | 1,624 (+2%) | 11mo | $260,000 | $160 | 88 |
| 13691 Gavina Ave #418 | 0.00mi | 3/2.0 | 1,540 (-4%) | 15mo | $316,000 | $205 | 82 |
| 13691 Gavina #566 | 0.00mi | 3/2.0 | 1,624 (+2%) | 20mo | $305,000 | $188 | 80 |
| 13691 Gavina Ave #359 | 0.00mi | 3/2.0 | 1,512 (-5%) | 16mo | $320,000 | $212 | 78 |
| 13691 Gavina #477 | 0.00mi | 3/2.0 | 1,495 (-6%) | 22mo | $235,000 | $157 | 71 |
Match score weights: distance 35% · size 25% · config 20% · recency 20%. Top-matched comps best support the ARV.
Projected returns pro-forma
-3.0% appreciation · 0.02% rent growth · sell at horizon
- IRR
- -7.9%
- Equity multiple
- 0.72×
- Total profit
- $-27,681
- Equity at exit
- $52,186
- IRR
- -2.7%
- Equity multiple
- 0.84×
- Total profit
- $-15,544
- Equity at exit
- $30,262
Cash invested: $98,000 (down + closing). Projections, not guarantees.
Landlord ↔ Tenant lean methodology
- Overall (CITY)
- 0 Strongly Tenant-Friendly
- State California
- 18 Strongly Tenant-Friendly · D+13
- County
- — inherits STATE
- City Los Angeles
- 0 Strongly Tenant-Friendly · D+22
ZIP-level market 91342
- Rents YoY
- 0.0%
- Active inventory
- 183
- Price-to-rent
- 7.6×
Monthly cashflow live
- Estimated rent
- $3,861 high interval (Pro) →
- Mortgage (P&I)
- −$1,835
- Tax est. 1.5%
- −$438 /mo · $5,250/yr
- Insurance
- −$146
- HOA
- −$0
- Vacancy / Maint / Mgmt
- −$811
- Net cashflow
- $631
Break-even live
UW: 25.0% down · 7.5% · 30yr · 1.5% tax · 5.0% vac · 8.0% maint · 8.0% mgmt
Financing live
Cash to close
- Down payment
- $87,500
- Closing costs
- $10,500
- Reserves months
- —
- Total cash needed
- —
Loan-product check · same deal, 3 products live
Conventional
25% down · 7.5% · 30yr
- Down + closing
- —
- Monthly P&I
- —
- Monthly cashflow
- —
- DSCR
- —
- Eligible?
- —
Personal DTI + credit; lowest rate.
DSCR
20% down · 8.5% · 30yr
- Down + closing
- —
- Monthly P&I
- —
- Monthly cashflow
- —
- DSCR
- —
- Eligible?
- —
No personal income docs; deal must DSCR.
Hard money
10% down · 12.0% · 12mo
- Down + closing
- —
- Monthly P&I
- —
- Monthly cashflow
- —
- DSCR
- —
- Eligible?
- —
Short-term bridge; refi at stabilization.
Rent comps 6 comps
| Address | Beds | Baths | Sqft | Rent | $/sqft | DOM | Units | Dist |
|---|---|---|---|---|---|---|---|---|
| 12707 Lazard St Sylmar, CA | 3.0 | 2.0 | 1067 | $3,700 | $3.47 | 43d | 1 | 0.34mi |
| 12727 Shenley St Sylmar, CA | 4.0 | 2.0 | 1631 | $3,795 | $2.33 | 5d | 1 | 0.82mi |
| 13191 Cranston Ave Sylmar, CA | 3.0 | 2.0 | 1469 | $4,250 | $2.89 | 3d | 1 | 0.89mi |
| 13197 Tripoli Ave Sylmar, CA | 3.0 | 2.0 | 1350 | $3,500 | $2.59 | 14d | 1 | 1.01mi |
| 13874 Aults Ave Sylmar, CA | 4.0 | 2.5 | 1300 | $4,250 | $3.27 | 1d | 1 | 1.21mi |
| 13057 Gladstone Ave Sylmar, CA | 4.0 | 2.0 | 1379 | $6,500 | $4.71 | 24d | 1 | 1.42mi |
Listing history 17 events
-
2026-06-18days on market $350,000 Active 22 DOM
-
2026-06-17days on market $350,000 Active 21 DOM
-
2026-06-16days on market $350,000 Active 20 DOM
-
2026-06-15days on market $350,000 Active 19 DOM
-
2026-06-13days on market $350,000 Active 17 DOM
-
2026-06-09days on market $350,000 Active 13 DOM
-
2026-06-08days on market $350,000 Active 12 DOM
-
2026-06-07days on market $350,000 Active 11 DOM
-
2026-06-04days on market $350,000 Active 8 DOM
-
2026-06-03days on market $350,000 Active 7 DOM
-
2026-06-02days on market $350,000 Active 6 DOM
-
2026-06-01days on market $350,000 Active 5 DOM
-
2026-05-31days on market $350,000 Active 4 DOM
-
2026-05-27$350,000 Active
-
2024-10-10soldstatus $305,000 Closed Sale 782-char remark
Show marketing remark (782 chars)
Discover this epitome of modern living nestled in a serene, mountainous Sylmar community. Don't miss this opportunity to make this 3-bedroom, 2-bathroom manufactured home, boasting a spacious 1624 square feet your own. With its generous layout, modern amenities, and unbeatable location, it's the perfect place to create a lifetime of memories. This home is complemented by a larger than average kitchen with a center island, attached 2-car garage, laundry room, and an outdoor patio for entertaining friends or just relaxing. Other amenities include a community pool, 2 jacuzzis, a fenced play yard for children, gazebos, picnic area, and athletic courts. Santiago Estates is a quiet neighborhood of homes with wonderful neighbors. This is the opportunity to make this one your's!
-
2024-09-09status Pending Sale 782-char remark
Show marketing remark (782 chars)
Discover this epitome of modern living nestled in a serene, mountainous Sylmar community. Don't miss this opportunity to make this 3-bedroom, 2-bathroom manufactured home, boasting a spacious 1624 square feet your own. With its generous layout, modern amenities, and unbeatable location, it's the perfect place to create a lifetime of memories. This home is complemented by a larger than average kitchen with a center island, attached 2-car garage, laundry room, and an outdoor patio for entertaining friends or just relaxing. Other amenities include a community pool, 2 jacuzzis, a fenced play yard for children, gazebos, picnic area, and athletic courts. Santiago Estates is a quiet neighborhood of homes with wonderful neighbors. This is the opportunity to make this one your's!
-
2024-08-24$275,000 Active 782-char remark
Show marketing remark (782 chars)
Discover this epitome of modern living nestled in a serene, mountainous Sylmar community. Don't miss this opportunity to make this 3-bedroom, 2-bathroom manufactured home, boasting a spacious 1624 square feet your own. With its generous layout, modern amenities, and unbeatable location, it's the perfect place to create a lifetime of memories. This home is complemented by a larger than average kitchen with a center island, attached 2-car garage, laundry room, and an outdoor patio for entertaining friends or just relaxing. Other amenities include a community pool, 2 jacuzzis, a fenced play yard for children, gazebos, picnic area, and athletic courts. Santiago Estates is a quiet neighborhood of homes with wonderful neighbors. This is the opportunity to make this one your's!
ⓘ Source: listings_history table (triggers on properties + properties_extension) + one-shot
backfill from property_details.listing_events for pre-trigger history.
Climate risk First Street
- Flood 1/10 Low FEMA zone X (unshaded) · 0% chance over 30 yrs
- Wildfire 8/10 Severe
- Heat 6/10 Major 9 d/yr ≥97°F today · 25 d/yr by 30 yrs out
- Wind 1/10 Low
- Air quality 7/10 Severe 13 unhealthy d/yr today · 16 by 30 yrs out
Nearby sold comps map
Loading sold comps map…
Walkable amenities ~0.75 mi
Loading nearby amenities…
Taxation est. · year 1
- Rental income
- $46,332
- − Mortgage interest
- −$19,605
- − Property taxes
- −$5,250
- − Insurance
- −$1,750
- − Repairs & maintenance
- −$3,707
- − Management
- −$3,707
- − Depreciation
- −$10,182
- Taxable income
- $2,132
- Est. tax owed @ 24.0%
- −$512
- After-tax cash flow
- $7,066/yr
For passive investors: Depreciation is non-cash, so a rental often shows a tax loss while cash-flowing — sheltering income. Rental losses are passive: they offset passive income freely, and up to $25,000/yr can offset ordinary (W-2) income if you actively participate and your MAGI is under $100k (phasing out to $0 by $150k); unused losses carry forward. On sale, claimed depreciation is recaptured at up to 25%, and gains may owe capital-gains tax (a 1031 exchange can defer both). Figures are a year-1 estimate at your 24.0% rate — not tax advice; consult a CPA.
Condition & rehab AI · 1 photo
This 3-bedroom, 2-bathroom manufactured home requires moderate renovations, focusing on the kitchen and exterior. Updates will significantly improve its resale and rental value.
Repairs flagged
- Major kitchen appliances — Signs of wear and tear
- Major kitchen cabinets — Signs of wear and tear
Value-add opportunities
- Resale update kitchen appliances — Modernizing the kitchen will attract more buyers
- Resale paint exterior — Fresh paint will improve curb appeal
- Both landscaping — Well-maintained landscaping will enhance both resale and rental value
Renovation cost estimate screening
| Repair item | Severity | Est. cost |
|---|---|---|
| kitchen appliances · Signs of wear and tear | Major | $15,000–50,000 |
| kitchen cabinets · Signs of wear and tear | Major | $15,000–50,000 |
| Total estimated repair cost · 2 items | $30,000–100,000 |
Value-add ROI direction
- Resale update kitchen appliances — Modernizing the kitchen will attract more buyers ↑
- Resale paint exterior — Fresh paint will improve curb appeal ↑
- Both landscaping — Well-maintained landscaping will enhance both resale and rental value ↑
ⓘ Cost ranges are severity-bucket heuristics (US national rule-of-thumb). Get contractor quotes + a written scope before underwriting a rehab budget.
Schools (NCES district)
- District
- Los Angeles Unified
- NCES district ID
- 0622710
- Math proficiency
- 29% ▼ -4.00%
- Reading proficiency
- 54% ▲ 10.00%
- Median HH income
- $50,403
- Composite
- 35.67/100
- National rank
- #4875
- State rank
- #223 of 517 in CA
Livability — Los Angeles
- Score
- 68/100
- State rank
- #273
- US rank
- #9237
Category grades
Schools grade is shown separately in the Schools card above.
Census & demographics
- Census place
- Los Angeles, CA
- County
- Los Angeles County · 9,444,647 people
- City population
- 3,838,149
- Metro
- Los Angeles-Long Beach-Anaheim, CA
- Population (ZIP)
- 93,301
- Household income
- $98,118
- Rent vs Own
- Severe rent burden
- 2559.0
Population outlook (Los Angeles County) Hauer SSP2
- Today (2025)
- 10,940,515 people
- By 2030
- 11,256,481 · +2.9%
- By 2040
- 11,729,929 · +7.2%
- By 2050
- 11,948,407 · +9.2%
- By 2075
- 11,818,114 · +8.0%
- By 2100
- 10,842,928 · -0.9%
Race, ethnicity, and origin ACS 2023
- Neighborhood character
- Predominantly Hispanic (74%)
- Race & ethnicity
- Hispanic / Latino 74% Two or more races 23% White 12% Asian 7% Black 3% Native American 2%
- Hispanic origin (detail)
- Mexican 59%
- Common ancestry
- Italian 1%
- Foreign-born
- 36% · Canada, South Korea, Dominican Republic
- Languages at home
- 32% English-only · Spanish 59% Tagalog/Filipino 4% Other Indo-European 3%
Political lean MEDSL · Los Angeles
- 2024 margin
- Solid D (+32.9) · D 64.8% · R 31.9% · Other 3.3%
- 2008→2024 swing
- -7.4pp toward R · 2008: 40.4pp · 2024: 32.9pp
- All cycles
- 2024: D+32.9 2020: D+44.2 2016: D+48.0 2012: D+40.0 2008: D+40.4
Not yet ingested
- Civics
- —
Market trends
- HPI YoY
- ▼ -921.77%
- Current HPI
- 440.1462
- Rent YoY
- ▬ 0.02%
- Metro
- Los Angeles-Long Beach-Anaheim, CA
- State GDP YoY
- ▲ 3.21%
- F500 in state
- 116
Industry mix (Fortune 500 HQ in CA)
| Industry | F500 HQs | Revenue |
|---|---|---|
| Technology | 27 | $1,492B |
|
||
| Financial Services | 3 | $174B |
|
||
| Retail | 3 | $44B |
|
||
| Insurance | 3 | $26B |
|
||
| Media / Entertainment | 2 | $115B |
|
||
| Pharmaceuticals / Biotech | 2 | $62B |
|
||
Price history
+27.3% since first listed4 events — show timeline
- 2026-05-27 Listed $350,000 CRMLS
- 2024-10-10 Sold (MLS) $305,000 CRMLS
- 2024-09-09 Pending — CRMLS
- 2024-08-24 Listed $275,000 CRMLS
Property tax history
+21.1%/yrLatest (2025): $578 · +21.1% YoY. Source: county tax records.
Cash-flow waterfall
monthlySold comps — $/sqft
last 12 mo · ≤1 miLoading sold comps…