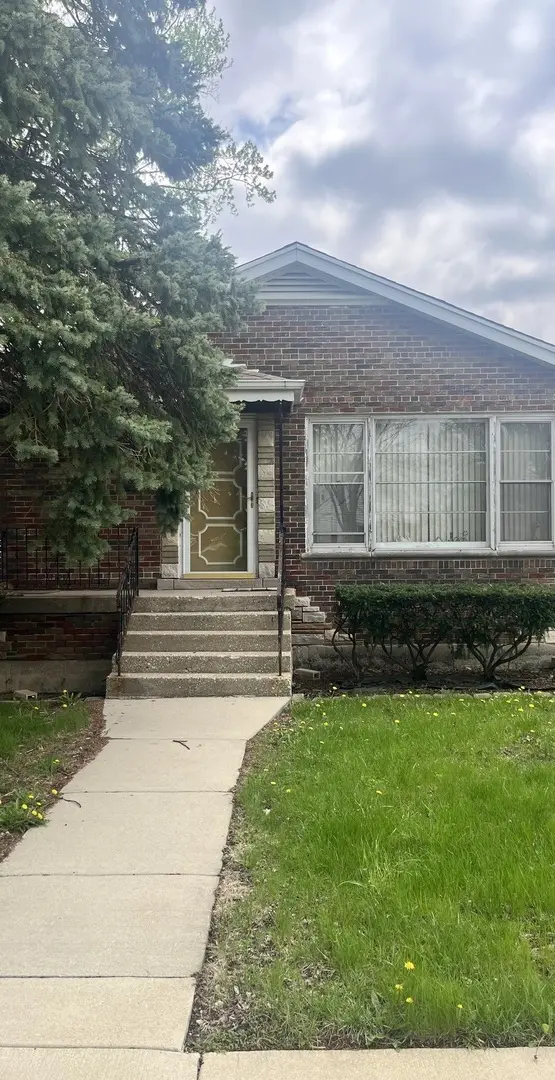
1127 W 123rd St · Calumet Park, IL
Flood risk 1/10 · Minimal
- FEMA flood zone
- X (unshaded)
- Chance of flooding over 30 yrs
- 0.0%
- Est. flood insurance / yr
- $473 – $860
Fire risk 1/10 · Minimal
- Est. fire insurance / yr
- $804 – $1,492
Heat risk 3/10 · Minor
- Hot days now (above 101°F)
- 7 days/yr
- Hot days in 30 yrs
- 15 days/yr
Wind risk 2/10 · Minimal
- Chance of severe wind over 30 yrs
- —
Air-quality risk 4/10 · Minor
- Unhealthy air days now
- 4 days/yr
- Unhealthy air days in 30 yrs
- 6 days/yr
Risk factors via First Street. Map © Google.
Why this score? — see what drove the B+ grade
The composite is a weighted blend of 9 inputs, each scored 0–100. Each bar is that input's sub-score; the figure is the points it added to the 100-point composite (weight × sub-score).
- Cash flow +30.0/30.0
- ARV discount +15.0/15.0
- DSCR +10.0/10.0
- 1% rule +8.9/10.0
- Rent growth +4.5/5.0
- Livability +3.6/5.0
- Condition / age +2.5/5.0
- Schools +1.6/10.0
- Appreciation +0.0/10.0
$139,000
🖨 Deal sheet 📄 Offer letter ✓ Due diligence
Listing remarks
Welcome to this spacious single family home in the heart of Calumet Park, offering endless potential for homeowners, investors, and buyers looking to relocated to this quiet suburb. Featuring a large open living area with original hardwood flooring, generous room sizes to compliment the functional layout, this home provides the perfect opportunity to customize and make it your own. the bright kitchen and dining area offers ample cabinet space and natural light, while the expansive unfinished basement provides endless possibilities for additional living space. Conveniently located near parks, schools, dining, shopping, and major expressways, this home combines suburban comfort with easy acce
Key facts
- Bright kitchen
- Ample cabinet space
- 2 garage spots
Tags
Property features AI
Finance
- Other: Possession at closing or immediate
- HOA & community: No master association fee required
Exterior
- Parking: Detached garage; 2 garage/total parking spaces
- Utilities: Public water; Public sewer
- Home design: Detached single-family home; Raised ranch style; Fee simple ownership
- Construction: Brick construction; Built approximately 71–80 years ago; Property built before 1978
- Exterior features: Less than 1/4 acre lot; Lot dimensions listed as 4422; School bus service, commuter bus access, and interstate access nearby
Interior
- Kitchen: Main-level kitchen (approx. 10 x 10)
- Bedrooms: 3 bedrooms; Master bedroom on main level (12 x 18); Two additional main-level bedrooms, each about 12 x 12
- Bathrooms: 2 full bathrooms; Basement has a bathroom
- Heating & cooling: Natural gas heating; Forced air heating
- Interior features: 6 total rooms; Unfinished full basement
- Laundry & utility: Basement laundry (approx. 10 x 10)
Neighborhood map
What this means for you Summary
Snapshot
- This is a 3-bed/1.0-bath single-family listed at $139k.
Deal economics
- At list price, monthly cash flow is $566 ($7k/yr) — positive.
- The deal already cash-flows at list — no discount required.
- Meets the 1% rule at list price ($2k rent vs $139k).
- Recommended offer: $135k (3.0% below list) — sets the bar for market timing.
- Cap rate 11.2% vs local median 6.7% in Calumet Park — top-decile yield for the area; either an underpriced asset or a hidden risk that comps aren't pricing in. Stress-test before assuming the spread holds.
Location & tenants
- Location reads 72/100 on livability (#308 in IL) — a middle-class / working-renter tenant base. Strengths: commute A+, cost of living A+, housing A+; Watch: employment C-, schools F, crime F.
- Chsd 218 (suburban): math 14% / reading 20% proficiency, ranked #454 of 620 in IL (top 73%) — low school quality limits family demand, transient renter base, plan for 1-2y turnover.
- Market conditions: Rents rising fast (+7.8%/yr); 76 active listings in the ZIP; 11 comparable units currently listed for rent nearby; rentals leasing fast (median 12d on market — plan ~1-2 weeks tenant-placement turnaround); lower-income renter base — watch delinquency; 6,272 units permitted in Cook County in 2024 (4,658 in 5+ unit buildings).
- At $1,933/mo this rent would consume 62% of the median local household income ($37k/yr) (locally 1868% of renters already pay >50% of income on rent) — very limited rent-growth headroom before tenants either downsize or default.
Forward outlook
- Local home prices are declining (-3.0%/yr); year-one equity from $961 of loan paydown is wiped out by about $4k of value loss. Plan a longer hold.
- At projected returns (-3.0% appreciation + 7.8% rent growth), your $39k cash investment doubles in ~6 years — after that, you're playing with house money.
Negotiation context
- It's been on market 37 days — a 3% lower offer ($135k) is reasonable based on typical stale-listing flexibility.
- Current owner paid $70k; list at $139k implies a 98% gain — meaningful room to come down on a strong offer.
Risks & watch-outs
- Watch-outs: built in 1954 — expect roof / HVAC / electrical / plumbing capex.
Questions for the listing agent
- It's been on market 37 days. Have you received any prior offers? Is the seller open to a 3% concession, seller financing, or rate buy-down credit?
- Built in 1954 — when were the roof, HVAC, electrical panel, plumbing, and water heater last replaced?
- Is there a deadline driving the sale (1031 exchange, divorce, estate, relocation)? That informs how much negotiation room exists.
- Schools are F-rated, which usually means shorter tenancies and higher turnover. Who's the typical renter profile here, and what's been the actual vacancy rate?
- Crime grade is F in this area — have there been break-ins, vandalism, or insurance claims at this property in the last 3 years? What carrier currently insures it and at what premium?
- What's the average days-on-market for RENTAL listings here right now (not sales)? A rising rental-DOM trend means longer vacancies and softer asking-rent achievability than the comps imply.
- What's the recent tenant-quality profile in this submarket — average credit score on applications, eviction rate, late-payment / NSF rate, and stable-employment percentage? A property-management company in the area should have these aggregated.
- How much new for-sale + rental construction is in the pipeline within 1–3 miles? Heavy new supply typically softens prices + rents 12–24 months out; constrained supply supports both.
Investment metrics
- 1% rule
- 1.39% ✓
- Cap rate
- 11.18%
- Cash-on-cash
- 17.46%
- DSCR
- 1.78
- GRM
- 6.0
CMA / ARV
- ARV (median comp)
- $179,774
- List price
- $139,000
- Delta
- -22.68%
- Verdict
- UNDERPRICED
- Comps
- 20 within 1.0 mi
Show comp detail 12 sales within ~0.75 mi
| Address | Dist | Beds/Ba | Sqft | Sold | Price | $/sf | Match |
|---|---|---|---|---|---|---|---|
| 12509 S Throop St | 0.31mi | 3/1.0 | 1,216 (-1%) | 2mo | $141,270 | $116 | 82 |
| 12416 S Carpenter St | 0.20mi | 4/1.0 (+1) | 1,253 (+2%) | 3mo | $112,500 | $90 | 79 |
| 12427 S Ada St | 0.29mi | 3/1.5 | 1,152 (-6%) | 0mo | $215,000 | $187 | 74 |
| 12334 S Loomis St | 0.32mi | 3/2.0 | 1,173 (-4%) | 1mo | $136,000 | $116 | 73 |
| 12230 S Elizabeth St | 0.15mi | 3/2.0 | 1,400 (+14%) | 2mo | $217,000 | $155 | 64 |
| 11807 S Peoria St | 0.70mi | 3/1.0 | 1,238 (+1%) | 3mo | $72,000 | $58 | 63 |
| 11825 S Bishop St | 0.69mi | 3/1.5 | 1,210 (-1%) | 2mo | $250,000 | $207 | 63 |
| 12219 S Emerald Ave | 0.54mi | 3/1.0 | 1,139 (-7%) | 2mo | $87,000 | $76 | 62 |
| 1538 W 119th St | 0.74mi | 3/1.0 | 1,205 (-2%) | 3mo | $181,111 | $150 | 60 |
| 12154 S Justine St | 0.53mi | 3/1.5 | 1,092 (-11%) | 1mo | $160,053 | $147 | 54 |
| 1021 W Vermont Ave | 0.70mi | 3/1.0 | 1,118 (-9%) | 2mo | $180,000 | $161 | 51 |
| 12121 S Wallace St | 0.75mi | 3/1.0 | 1,127 (-8%) | 1mo | $85,000 | $75 | 51 |
Match score weights: distance 35% · size 25% · config 20% · recency 20%. Top-matched comps best support the ARV.
Projected returns pro-forma
-3.0% appreciation · 7.82% rent growth · sell at horizon
- IRR
- 14.2%
- Equity multiple
- 1.60×
- Total profit
- $23,394
- Equity at exit
- $20,725
- IRR
- 26.4%
- Equity multiple
- 3.86×
- Total profit
- $111,487
- Equity at exit
- $12,018
Cash invested: $38,920 (down + closing). Projections, not guarantees.
Landlord ↔ Tenant lean methodology
- Overall (STATE)
- 43 Moderately Tenant-Leaning
- State Illinois
- 43 Moderately Tenant-Leaning · D+7
- County
- — inherits STATE
- City
- — inherits STATE
ZIP-level market 60827
- Home prices YoY
- -31.8%
- Rents YoY
- 7.8%
- Active inventory
- 76
- Price-to-rent
- 6.0×
Monthly cashflow live
- Estimated rent
- $1,933 high interval (Pro) →
- Mortgage (P&I)
- −$729
- Tax est. 1.5%
- −$174 /mo · $2,085/yr
- Insurance
- −$58
- HOA
- −$0
- Vacancy / Maint / Mgmt
- −$406
- Net cashflow
- $566
Break-even live
UW: 25.0% down · 7.5% · 30yr · 1.5% tax · 5.0% vac · 8.0% maint · 8.0% mgmt
Financing live
Cash to close
- Down payment
- $34,750
- Closing costs
- $4,170
- Reserves months
- —
- Total cash needed
- —
Loan-product check · same deal, 3 products live
Conventional
25% down · 7.5% · 30yr
- Down + closing
- —
- Monthly P&I
- —
- Monthly cashflow
- —
- DSCR
- —
- Eligible?
- —
Personal DTI + credit; lowest rate.
DSCR
20% down · 8.5% · 30yr
- Down + closing
- —
- Monthly P&I
- —
- Monthly cashflow
- —
- DSCR
- —
- Eligible?
- —
No personal income docs; deal must DSCR.
Hard money
10% down · 12.0% · 12mo
- Down + closing
- —
- Monthly P&I
- —
- Monthly cashflow
- —
- DSCR
- —
- Eligible?
- —
Short-term bridge; refi at stabilization.
Rent comps 11 comps
| Address | Beds | Baths | Sqft | Rent | $/sqft | DOM | Units | Dist |
|---|---|---|---|---|---|---|---|---|
| 843 W 123rd St Unit T2 Calumet Park, IL | 2.0 | 1.0 | 750 | $1,400 | $1.87 | 12d | 1 | 0.34mi |
| 843 W 123rd St Unit V5 Calumet Park, IL | 2.0 | 1.0 | 900 | $1,500 | $1.67 | 12d | 1 | 0.34mi |
| 12106 S Emerald Ave Chicago, IL | 3.0 | 2.0 | 1300 | $2,550 | $1.96 | 1d | 1 | 0.54mi |
| 12358 S Lowe Ave Chicago, IL | 3.0 | 2.0 | 1050 | $2,400 | $2.29 | 24d | 1 | 0.61mi |
| 12827 S Morgan St Unit 1546010P Chicago, IL | 4.0 | 2.0 | 1022 | $4,677 | $4.58 | 12d | 1 | 0.72mi |
| 11547 S Ashland Ave Chicago, IL | 3.0 | 1.5 | 1000 | $2,700 | $2.70 | 3d | 1 | 1.09mi |
| 11361 S Racine Ave Chicago, IL | 3.0 | 1.5 | 1440 | $3,700 | $2.57 | 1d | 1 | 1.17mi |
| 13034 Honore St Unit 1 Blue Island, IL | 2.0 | 1.0 | 700 | $1,350 | $1.93 | 12d | 1 | 1.27mi |
| 2130 122nd St Blue Island, IL | 2.0 | 1.0 | 558 | $1,450 | $2.60 | 1d | 1 | 1.28mi |
| 1908 Vermont St Unit 1916-4 Blue Island, IL | 2.0 | 1.0 | 800 | $1,395 | $1.74 | 1d | 1 | 1.34mi |
| 1923 Vermont St Blue Island, IL | 2.0 | 1.0 | 1087 | $1,550 | $1.43 | 24d | 1 | 1.36mi |
Listing history 16 events
-
2026-06-18days on market $139,000 Active 37 DOM
-
2026-06-17days on market $139,000 Active 36 DOM
-
2026-06-16days on market $139,000 Active 35 DOM
-
2026-06-15days on market $139,000 Active 34 DOM
-
2026-06-13days on market $139,000 Active 32 DOM
-
2026-06-09days on market $139,000 Active 28 DOM
-
2026-06-08days on market $139,000 Active 27 DOM
-
2026-06-07days on market $139,000 Active 26 DOM
-
2026-06-04days on market $139,000 Active 23 DOM
-
2026-06-03days on market $139,000 Active 22 DOM
-
2026-06-02days on market $139,000 Active 21 DOM
-
2026-06-01days on market $139,000 Active 20 DOM
-
2026-05-31days on market $139,000 Active 19 DOM
-
2026-05-12$139,000 Active 714-char remark
-
1993-12-27soldstatus $70,378
-
1984-04-01soldstatus $55,000
ⓘ Source: listings_history table (triggers on properties + properties_extension) + one-shot
backfill from property_details.listing_events for pre-trigger history.
Climate risk First Street
- Flood 1/10 Low FEMA zone X (unshaded) · 0% chance over 30 yrs
- Wildfire 1/10 Low
- Heat 3/10 Moderate 7 d/yr ≥101°F today · 15 d/yr by 30 yrs out
- Wind 2/10 Low
- Air quality 4/10 Moderate 4 unhealthy d/yr today · 6 by 30 yrs out
Nearby sold comps map
Loading sold comps map…
Walkable amenities ~0.75 mi
Loading nearby amenities…
Taxation est. · year 1
- Rental income
- $23,192
- − Mortgage interest
- −$7,786
- − Property taxes
- −$2,085
- − Insurance
- −$695
- − Repairs & maintenance
- −$1,855
- − Management
- −$1,855
- − Depreciation
- −$4,044
- Taxable income
- $4,871
- Est. tax owed @ 24.0%
- −$1,169
- After-tax cash flow
- $5,625/yr
For passive investors: Depreciation is non-cash, so a rental often shows a tax loss while cash-flowing — sheltering income. Rental losses are passive: they offset passive income freely, and up to $25,000/yr can offset ordinary (W-2) income if you actively participate and your MAGI is under $100k (phasing out to $0 by $150k); unused losses carry forward. On sale, claimed depreciation is recaptured at up to 25%, and gains may owe capital-gains tax (a 1031 exchange can defer both). Figures are a year-1 estimate at your 24.0% rate — not tax advice; consult a CPA.
Schools (NCES district)
- District
- Chsd 218
- NCES district ID
- 1706540
- Math proficiency
- 14% ▼ -4.00%
- Reading proficiency
- 20% ▼ -1.00%
- Median HH income
- $57,166
- Composite
- 16.09/100
- National rank
- #9235
- State rank
- #454 of 620 in IL
Livability — Calumet Park
- Score
- 72/100
- State rank
- #308
- US rank
- #6048
Category grades
Schools grade is shown separately in the Schools card above.
Census & demographics
- Census place
- Calumet Park, IL
- County
- Cook County · 4,486,803 people
- Metro
- Chicago-Naperville-Elgin, IL-IN-WI
- Population (ZIP)
- 24,713
- Household income
- $37,217
- Rent vs Own
- Severe rent burden
- 1868.0
Population outlook (Cook County) Hauer SSP2
- Today (2025)
- 5,347,519 people
- By 2030
- 5,357,703 · +0.2%
- By 2040
- 5,324,924 · -0.4%
- By 2050
- 5,230,762 · -2.2%
- By 2075
- 4,785,735 · -10.5%
- By 2100
- 4,188,836 · -21.7%
Race, ethnicity, and origin ACS 2023
- Neighborhood character
- Predominantly Black (88%)
- Race & ethnicity
- Black 88% Two or more races 5% Hispanic / Latino 5% White 2%
- Common ancestry
- Iranian 1%
- Foreign-born
- 2% · Canada
- Languages at home
- 96% English-only · Spanish 3%
Political lean MEDSL · Cook
- 2024 margin
- Solid D (+42.0) · D 70.4% · R 28.4% · Other 1.2%
- 2008→2024 swing
- -11.4pp toward R · 2008: 53.4pp · 2024: 42.0pp
- All cycles
- 2024: D+42.0 2020: D+50.3 2016: D+53.0 2012: D+49.4 2008: D+53.4
Not yet ingested
- Civics
- —
Market trends
- HPI YoY
- ▼ -76.39%
- Current HPI
- 163.7725
- Rent YoY
- ▲ 7.82%
- Metro
- Chicago-Naperville-Elgin, IL-IN-WI
- State GDP YoY
- ▲ 1.59%
- F500 in state
- 60
Industry mix (Fortune 500 HQ in IL)
| Industry | F500 HQs | Revenue |
|---|---|---|
| Insurance | 4 | $201B |
|
||
| Consumer Goods | 4 | $87B |
|
||
| Industrial Machinery | 3 | $64B |
|
||
| Healthcare | 2 | $55B |
|
||
| Retail / Pharmacy | 1 | $148B |
|
||
| Agriculture / Food | 1 | $86B |
|
||
Price history
+152.7% since first listed3 events — show timeline
- 2026-05-12 Listed $139,000 MRED as Distributed by MLS Grid
- 1993-12-27 Sold (Public Records) $70,378 Public Records
- 1984-04-01 Sold (Public Records) $55,000 Public Records
Property tax history
+4.6%/yrLatest (2023): $7,541 · +56.7% YoY. Source: county tax records.
Cash-flow waterfall
monthlySold comps — $/sqft
last 12 mo · ≤1 miLoading sold comps…