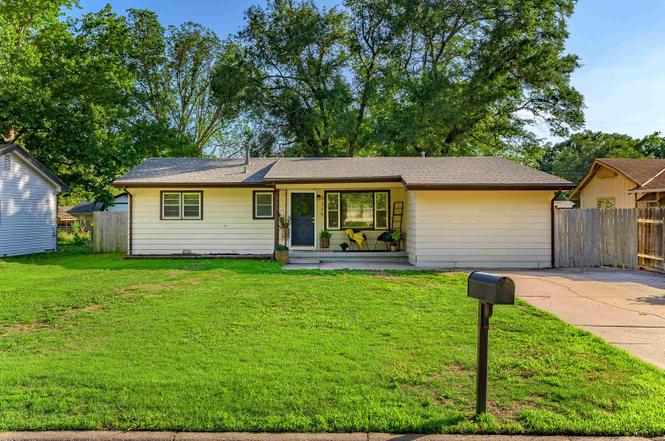
1339 N El Paso Dr · Derby, KS
Flood risk 1/10 · Minimal
- FEMA flood zone
- X (unshaded)
- Chance of flooding over 30 yrs
- 0.0%
- Est. flood insurance / yr
- $507 – $1,088
Fire risk 5/10 · Moderate
- Est. fire insurance / yr
- $1,154 – $2,142
Heat risk 5/10 · Moderate
- Hot days now (above 106°F)
- 7 days/yr
- Hot days in 30 yrs
- 18 days/yr
Wind risk 2/10 · Minimal
- Chance of severe wind over 30 yrs
- —
Air-quality risk 2/10 · Minimal
- Unhealthy air days now
- 1 days/yr
- Unhealthy air days in 30 yrs
- 1 days/yr
Risk factors via First Street. Map © Google.
Why this score? — see what drove the D grade
The composite is a weighted blend of 9 inputs, each scored 0–100. Each bar is that input's sub-score; the figure is the points it added to the 100-point composite (weight × sub-score).
- Cash flow +14.8/30.0
- ARV discount +7.5/15.0
- DSCR +4.5/10.0
- 1% rule +3.8/10.0
- Rent growth +3.7/5.0
- Livability +3.4/5.0
- Schools +2.9/10.0
- Condition / age +2.5/5.0
- Appreciation +0.0/10.0
$180,000
🖨 Deal sheet (PDF) 📄 Offer letter ✓ Due diligence
Key facts
- Covered front porch
- Original wood floors
- New roof
Tags
Property features AI
Exterior
- Utilities: Public water; Sewer available; Natural gas available
- Home design: Single-family, onsite built
- Construction: Composition roof; Crawl space foundation
- Exterior features: One-level layout; Storage structure on site; Chain link and wood fencing
Interior
- Flooring: Hardwood
- Bathrooms: 1 full bathroom
- Heating & cooling: Central air (electric); Forced air heating (natural gas)
- Interior features: Hardwood flooring; No basement
- Laundry & utility: Laundry on the main floor
Neighborhood map
What this means for you Summary
Snapshot
- This is a 3-bed/1.0-bath single-family listed at $180k.
Deal economics
- At list price, monthly cash flow is $50 ($597/yr) — positive.
- The deal already cash-flows at list — no discount required.
- To meet the 1% rule (rent ≥ 1% of price), the offer needs to be $159k (11.8% below list).
- Recommended offer: $159k (11.8% below list) — sets the bar for 1% rule.
Location & tenants
- Location reads 68/100 on livability (#229 in KS) — a middle-class / working-renter tenant base. Strengths: cost of living A+, housing A+, employment A; Watch: crime C-, amenities F, commute F.
- Derby (suburban): math 29% / reading 36% proficiency, ranked #66 of 169 in KS (top 39%) — families likely to look elsewhere, expect single-tenant / working-renter base with shorter leases.
- Zoned schools: El Paso Elem (math 22% / reading 32%, grade F, #507 of 684 statewide, top 78%, 271 students, 51% FRL); Derby Middle Sch (math 21% / reading 34%, grade F, #91 of 219 statewide, top 42%, 929 students, 46% FRL); Derby High School (math 17% / reading 21%, grade F, #230 of 327 statewide, top 71%, 2,172 students, 43% FRL).
- Market conditions: Rents rising fast (+4.9%/yr); 282 active listings in the ZIP; 9 comparable units currently listed for rent nearby; rentals at typical pace (median 16d on market — plan ~3-4 weeks tenant-placement turnaround); solid renter incomes; 2,613 units permitted in Sedgwick County in 2024 (258 in 5+ unit buildings).
Forward outlook
- Local home prices are declining (-3.0%/yr); year-one equity from $1k of loan paydown is wiped out by about $5k of value loss. Plan a longer hold.
- Sedgwick County population projected at +5% by 2050 — modest demand growth; plan on rents tracking national, not racing it.
Negotiation context
- Only 10 days on market — expect competitive offers; lowballing is unlikely to land.
Risks & watch-outs
- Watch-outs: built in 1958 — expect roof / HVAC / electrical / plumbing capex.
- Climate carrying-cost: moderate wildfire risk; extreme-heat days projected 7→18/yr by 2055 (HVAC capex compounding) — expect insurance premiums to compound above CPI over the hold.
Questions for the listing agent
- Built in 1958 — when were the roof, HVAC, electrical panel, plumbing, and water heater last replaced?
- Is there a deadline driving the sale (1031 exchange, divorce, estate, relocation)? That informs how much negotiation room exists.
- The area grade is low — what's the realistic commute time and amenity access for the typical tenant pool here? Any planned neighborhood developments (good or bad) we should know about?
- What's the average days-on-market for RENTAL listings here right now (not sales)? A rising rental-DOM trend means longer vacancies and softer asking-rent achievability than the comps imply.
- What's the recent tenant-quality profile in this submarket — average credit score on applications, eviction rate, late-payment / NSF rate, and stable-employment percentage? A property-management company in the area should have these aggregated.
- How much new for-sale + rental construction is in the pipeline within 1–3 miles? Heavy new supply typically softens prices + rents 12–24 months out; constrained supply supports both.
Investment metrics
- 1% rule
- 0.88% ✗
- Cap rate
- 6.62%
- Cash-on-cash
- 1.18%
- DSCR
- 1.05
- GRM
- 9.4
CMA / ARV
No comps found within radius.
Projected returns pro-forma
-3.0% appreciation · 4.93% rent growth · sell at horizon
- IRR
- -12.3%
- Equity multiple
- 0.55×
- Total profit
- $-22,856
- Equity at exit
- $26,839
- IRR
- -0.6%
- Equity multiple
- 0.95×
- Total profit
- $-2,407
- Equity at exit
- $15,563
Cash invested: $50,400 (down + closing). Projections, not guarantees.
Landlord ↔ Tenant lean methodology
- Overall (STATE)
- 83 Strongly Landlord-Friendly
- State Kansas
- 83 Strongly Landlord-Friendly · R+10
- County
- — inherits STATE
- City
- — inherits STATE
ZIP-level market 67037
- Rents YoY
- 4.9%
- Active inventory
- 282
- Price-to-rent
- 9.4×
Monthly cashflow live
- Estimated rent
- $1,588 high interval (Pro) →
- Mortgage (P&I)
- −$944
- Tax from tax record
- −$186 /mo · $2,230/yr
- Insurance
- −$75
- HOA
- −$0
- Vacancy / Maint / Mgmt
- −$333
- Net cashflow
- $50
Break-even live
Sensitivity live
| Price | -10% $152 | -5% $101 | +0% $50 | +5% $-1 | +10% $-52 |
|---|---|---|---|---|---|
| Rent | -10% $-76 | -5% $-13 | +0% $50 | +5% $112 | +10% $175 |
| Rate | -1.0pp $140 | -0.5pp $96 | base $50 | +0.5pp $3 | +1.0pp $-44 |
UW: 25.0% down · 7.5% · 30yr · 1.5% tax · 5.0% vac · 8.0% maint · 8.0% mgmt
Financing live
Cash to close
- Down payment
- $45,000
- Closing costs
- $5,400
- Reserves months
- —
- Total cash needed
- —
Loan-product check · same deal, 3 products live
Conventional
25% down · 7.5% · 30yr
- Down + closing
- —
- Monthly P&I
- —
- Monthly cashflow
- —
- DSCR
- —
- Eligible?
- —
Personal DTI + credit; lowest rate.
DSCR
20% down · 8.5% · 30yr
- Down + closing
- —
- Monthly P&I
- —
- Monthly cashflow
- —
- DSCR
- —
- Eligible?
- —
No personal income docs; deal must DSCR.
Hard money
10% down · 12.0% · 12mo
- Down + closing
- —
- Monthly P&I
- —
- Monthly cashflow
- —
- DSCR
- —
- Eligible?
- —
Short-term bridge; refi at stabilization.
Rent comps 9 comps
| Address | Beds | Baths | Sqft | Rent | $/sqft | DOM | Units | Dist |
|---|---|---|---|---|---|---|---|---|
| 1400 N El Paso Dr Derby, KS | 3.0 | 1.0 | 1310 | $1,395 | $1.06 | 16d | 1 | 0.13mi |
| 1100 N Baltimore Ave Unit 9 Derby, KS | 2.0 | 1.5 | 1150 | $1,600 | $1.39 | 25d | 1 | 0.37mi |
| 1100 N Baltimore Ave Unit 5 Derby, KS | 2.0 | 1.5 | 1050 | $1,800 | $1.71 | 25d | 1 | 0.38mi |
| 2146 N Woodlawn Blvd Derby, KS | 3.0 | 2.5 | 1500 | $1,395 | $0.93 | 16d | 1 | 0.67mi |
| 1300 E Meadowlark Blvd Derby, KS | 1.0–2.0 | 1.0–2.0 | 818 | $1,110 | $1.36 | 16d | 1 | 0.73mi |
| 715 N Kokomo Ave Derby, KS | 3.0 | 2.0 | 1168 | $1,395 | $1.19 | 16d | 1 | 0.75mi |
| 1500 Tall Tree Rd Derby, KS | 1.0–2.0 | 1.0–2.0 | 818 | $1,090 | $1.33 | 16d | 1 | 1.09mi |
| 1401 E Patriot Ave Derby, KS | 1.0–2.0 | 1.0–2.0 | 818 | $2,165 | $2.65 | 16d | 1 | 1.34mi |
| 1804 E Osage Rd Derby, KS | 1.0–3.0 | 1.0–1.5 | 995 | $1,475 | $1.48 | 16d | 5 | 1.47mi |
Listing history 6 events
-
2026-06-22days on market $180,000 Active 10 DOM
-
2026-06-18days on market $180,000 Active 7 DOM
-
2026-06-17days on market $180,000 Active 6 DOM
-
2026-06-16days on market $180,000 Active 5 DOM
-
2026-06-15days on market $180,000 Active 4 DOM
-
2026-06-14$180,000 Active 2 DOM
ⓘ Source: listings_history table (triggers on properties + properties_extension) + one-shot
backfill from property_details.listing_events for pre-trigger history.
Tax reassessment forecast KS · Resets to sale price
- Current annual tax
- $2,230 · $186/mo
- Projected year-2 tax
- $2,538 · $212/mo
- Expected delta
- +$308/yr (+$26/mo · 13.8%)
ⓘ Screening estimate from a state-policy table — verify with the county assessor before closing.
Climate risk First Street
- Flood 1/10 Low FEMA zone X (unshaded) · 0% chance over 30 yrs
- Wildfire 5/10 Major
- Heat 5/10 Major 7 d/yr ≥106°F today · 18 d/yr by 30 yrs out
- Wind 2/10 Low
- Air quality 2/10 Low 1 unhealthy d/yr today · 1 by 30 yrs out
Nearby sold comps map
Loading sold comps map…
Walkable amenities ~0.75 mi
Loading nearby amenities…
Taxation est. · year 1
- Rental income
- $19,056
- − Mortgage interest
- −$10,083
- − Property taxes
- −$2,230
- − Insurance
- −$900
- − Repairs & maintenance
- −$1,524
- − Management
- −$1,524
- − Depreciation
- −$5,236
- Taxable loss
- −$2,442
- Est. tax savings @ 24.0%
- +$586
- After-tax cash flow
- $1,183/yr
For passive investors: Depreciation is non-cash, so a rental often shows a tax loss while cash-flowing — sheltering income. Rental losses are passive: they offset passive income freely, and up to $25,000/yr can offset ordinary (W-2) income if you actively participate and your MAGI is under $100k (phasing out to $0 by $150k); unused losses carry forward. On sale, claimed depreciation is recaptured at up to 25%, and gains may owe capital-gains tax (a 1031 exchange can defer both). Figures are a year-1 estimate at your 24.0% rate — not tax advice; consult a CPA.
Schools (NCES district)
- District
- Derby
- NCES district ID
- 2005460
- Math proficiency
- 29% ▼ -3.00%
- Reading proficiency
- 36% ▲ 1.00%
- Median HH income
- $60,460
- Composite
- 29.25/100
- National rank
- #6564
- State rank
- #66 of 169 in KS
Livability — Derby
- Score
- 68/100
- State rank
- #229
- US rank
- #10061
Category grades
Schools grade is shown separately in the Schools card above.
Census & demographics
- Census place
- Derby, KS
- County
- Sedgwick County · 432,957 people
- City population
- 30,278
- Metro
- Wichita, KS
- Population (ZIP)
- 30,278
- Household income
- $85,541
- Rent vs Own
- Severe rent burden
- 397.0
Population outlook (Sedgwick County) Hauer SSP2
- Today (2025)
- 537,014 people
- By 2030
- 546,984 · +1.9%
- By 2040
- 559,141 · +4.1%
- By 2050
- 562,027 · +4.7%
- By 2075
- 557,255 · +3.8%
- By 2100
- 513,383 · -4.4%
Race, ethnicity, and origin ACS 2023
- Neighborhood character
- Predominantly White (79%)
- Race & ethnicity
- White 79% Hispanic / Latino 12% Two or more races 10% Black 2% Asian 1%
- Hispanic origin (detail)
- Mexican 10%
- Common ancestry
- Italian 3% Slovak 2% Lithuanian 2%
- Foreign-born
- 3% · Canada
- Languages at home
- 94% English-only · Spanish 4%
Political lean MEDSL · Sedgwick
- 2024 margin
- R (+13.8) · D 42.3% · R 56.1% · Other 1.6%
- 2008→2024 swing
- -1.1pp toward R · 2008: -12.7pp · 2024: -13.8pp
- All cycles
- 2024: R+13.8 2020: R+12.6 2016: R+19.1 2012: R+19.7 2008: R+12.7
Not yet ingested
- Civics
- —
Market trends
- HPI YoY
- ▼ -186.65%
- Current HPI
- 217.1231
- Rent YoY
- ▲ 4.93%
- Metro
- Wichita, KS
- State GDP YoY
- —
- F500 in state
- 0
Price history
1 event — show timeline
- 2026-06-11 Listed $180,000 SCKMLS as Distributed by MLS Grid
Property tax history
+5.8%/yrLatest (2025): $2,230 · +3.0% YoY. Source: county tax records.
Cash-flow waterfall
monthlySold comps — $/sqft
last 12 mo · ≤1 miLoading sold comps…