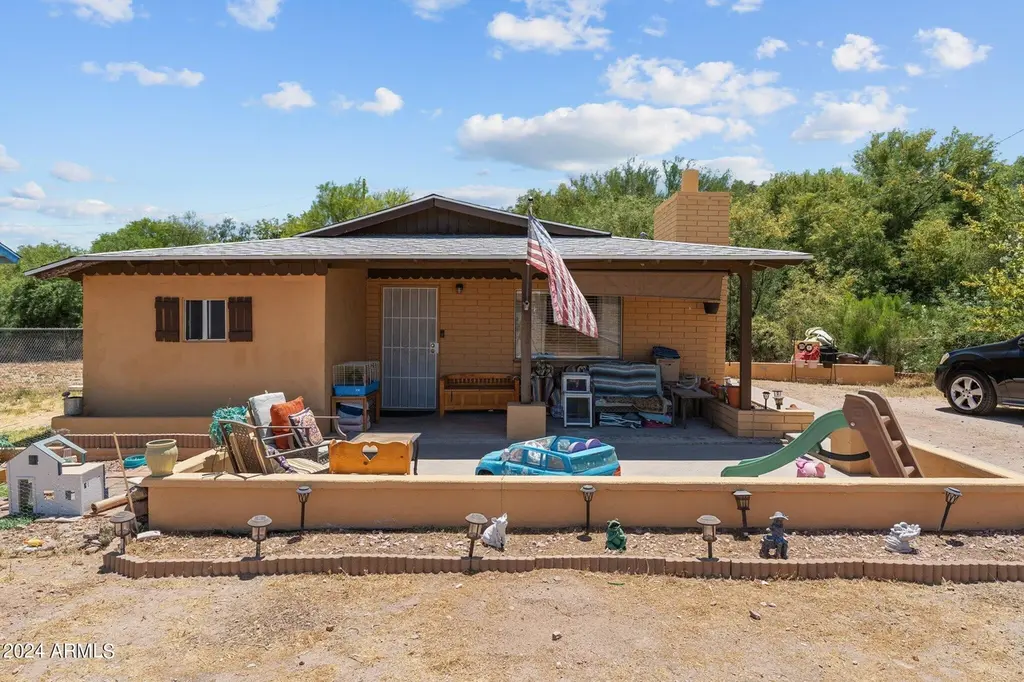
331 W Center St · Wickenburg, AZ
Flood risk 7/10 · Major
- FEMA flood zone
- X (shaded)
- Chance of flooding over 30 yrs
- 0.77%
- Est. flood insurance / yr
- $507 – $1,088
Fire risk 5/10 · Moderate
- Est. fire insurance / yr
- $610 – $1,132
Heat risk 8/10 · Major
- Hot days now (above 110°F)
- 7 days/yr
- Hot days in 30 yrs
- 18 days/yr
Wind risk 1/10 · Minimal
- Chance of severe wind over 30 yrs
- —
Air-quality risk 1/10 · Minimal
- Unhealthy air days now
- 0 days/yr
- Unhealthy air days in 30 yrs
- 0 days/yr
Risk factors via First Street. Map © Google.
Why this score? — see what drove the C grade
The composite is a weighted blend of 9 inputs, each scored 0–100. Each bar is that input's sub-score; the figure is the points it added to the 100-point composite (weight × sub-score).
- Cash flow +21.4/30.0
- ARV discount +15.0/15.0
- DSCR +6.8/10.0
- 1% rule +4.3/10.0
- Livability +3.5/5.0
- Schools +2.9/10.0
- Rent growth +2.5/5.0
- Condition / age +2.5/5.0
- Appreciation +0.0/10.0
$245,000
🖨 Deal sheet 📄 Offer letter ✓ Due diligence
Listing remarks MLS
Discover charm and convenience in the heart of Wickenburg! This 3 bed, 2 bath home boasts a seamless flow with a spacious family room featuring a wood burning fireplace. Enjoy the luxury of two master bedrooms, a spacious kitchen with tile flooring, and recent upgrades including laminate flooring, carpet, and a new roof. Situated on a large lot, this property offers endless possibilities and ample parking for all your toys and vehicles. Don't miss out on this must-see Wickenburg gem!
Key facts
- Two master bedrooms
- Recent upgrades
- Ample parking
Tags
Property features AI
Finance
- Financial info: Assumable financing (buyer must qualify)
- HOA & community: No association fees
Exterior
- Parking: RV access/parking
- Utilities: City water; Public sewer
- Home design: Single family residence; Fee simple ownership
- Construction: Stucco and painted wood frame construction; Composition roof
- Exterior features: Shed(s); Adjacent to wash; Dirt front yard; Dirt backyard; City maintained road
Interior
- Kitchen: Dishwasher; Garbage disposal; Laminate countertops
- Bedrooms: Up to 3 bedrooms; Additional master bedroom(s) present
- Flooring: Carpet; Laminate; Tile
- Bathrooms: 2 full bathrooms
- Heating & cooling: Electric heating; Central air conditioning; Ceiling fans; Programmable thermostat
- Interior features: Eat-in kitchen; Breakfast bar; 3/4 bath in the primary bedroom; Family room fireplace; Laminate counters
- Laundry & utility: Indoor laundry
Neighborhood map
What this means for you Summary
Snapshot
- This is a 3-bed/2.0-bath single-family listed at $245k.
Deal economics
- At list price, monthly cash flow is $297 ($4k/yr) — positive.
- The deal already cash-flows at list — no discount required.
- To meet the 1% rule (rent ≥ 1% of price), the offer needs to be $227k (7.4% below list).
- Recommended offer: $227k (7.4% below list) — sets the bar for 1% rule.
- Cap rate 8.1% vs local median 3.0% in Wickenburg — top-decile yield for the area; either an underpriced asset or a hidden risk that comps aren't pricing in. Stress-test before assuming the spread holds.
Location & tenants
- Location reads 70/100 on livability (#41 in AZ) — a middle-class / working-renter tenant base. Strengths: crime A+, housing A+, cost of living A-; Watch: amenities F, commute F.
- Wickenburg Unified District (4236) (rural): math 33% / reading 35% proficiency, ranked #92 of 249 in AZ (top 37%) — families likely to look elsewhere, expect single-tenant / working-renter base with shorter leases.
- Zoned schools: Hassayampa Elementary School (math 37% / reading 32%, grade F, #471 of 1,109 statewide, top 44%, 284 students, 50% FRL); Vulture Peak Middle School (math 27% / reading 32%, grade F, #84 of 218 statewide, top 41%, 162 students, 51% FRL); Wickenburg High School (math 27% / reading 32%, grade F, #120 of 381 statewide, top 34%, 460 students, 40% FRL) — zoned schools at 47% FRL track the district average.
- Market conditions: 378 active listings in the ZIP; 18 comparable units currently listed for rent nearby; rentals at typical pace (median 19d on market — plan ~3-4 weeks tenant-placement turnaround); 36,011 units permitted in Maricopa County in 2024 (12,801 in 5+ unit buildings).
- This rent runs 40% of the median local income ($69k/yr) — at the standard rent-burdened threshold; future hikes will face affordability resistance.
Forward outlook
- Local home prices are declining (-3.0%/yr); year-one equity from $2k of loan paydown is wiped out by about $7k of value loss. Plan a longer hold.
- Maricopa County population projected at +38% by 2050 — long-run rental-demand tailwind backs the buy-and-hold thesis.
Negotiation context
- It's been on market 34 days — a 3% lower offer ($238k) is reasonable based on typical stale-listing flexibility.
- 8 sale attempts since 5y ago with the ask held roughly flat each time — persistent listings suggest the price (not the market) is what's stuck; bring a comps-based counter.
- Current owner paid $208k; 18% above their basis — modest negotiation headroom, anchor on the comps not their cost.
Risks & watch-outs
- Watch-outs: flood insurance adds $66/mo; built in 1945 — expect roof / HVAC / electrical / plumbing capex.
- Climate carrying-cost: major flood risk; moderate wildfire risk; extreme-heat days projected 7→18/yr by 2055 (HVAC capex compounding) — expect insurance premiums to compound above CPI over the hold.
Questions for the listing agent
- It's been on market 34 days. Have you received any prior offers? Is the seller open to a 7% concession, seller financing, or rate buy-down credit?
- Built in 1945 — when were the roof, HVAC, electrical panel, plumbing, and water heater last replaced?
- What's the actual annual flood-insurance premium (NFIP or private), and is the property in a SFHA with mandatory coverage?
- Is there a deadline driving the sale (1031 exchange, divorce, estate, relocation)? That informs how much negotiation room exists.
- Schools are D-rated, which usually means shorter tenancies and higher turnover. Who's the typical renter profile here, and what's been the actual vacancy rate?
- What's the average days-on-market for RENTAL listings here right now (not sales)? A rising rental-DOM trend means longer vacancies and softer asking-rent achievability than the comps imply.
- What's the recent tenant-quality profile in this submarket — average credit score on applications, eviction rate, late-payment / NSF rate, and stable-employment percentage? A property-management company in the area should have these aggregated.
- How much new for-sale + rental construction is in the pipeline within 1–3 miles? Heavy new supply typically softens prices + rents 12–24 months out; constrained supply supports both.
Investment metrics
- 1% rule
- 0.93% ✗
- Cap rate
- 8.07%
- Cash-on-cash
- 6.36%
- DSCR
- 1.28
- GRM
- 9.0
CMA / ARV
- ARV (median comp)
- $392,026
- List price
- $245,000
- Delta
- -37.50%
- Verdict
- UNDERPRICED
- Comps
- 20 within 1.0 mi
Show comp detail 12 sales within ~0.75 mi
| Address | Dist | Beds/Ba | Sqft | Sold | Price | $/sf | Match |
|---|---|---|---|---|---|---|---|
| 433 N Oxbow Dr | 0.25mi | 3/2.0 | 1,470 (-1%) | 4mo | $250,000 | $170 | 84 |
| 600 Desert Canyon Rd | 0.28mi | 3/2.0 | 1,498 (+1%) | 6mo | $380,000 | $254 | 79 |
| 645 Desert Canyon Rd | 0.32mi | 3/2.0 | 1,488 (+1%) | 7mo | $375,000 | $252 | 78 |
| 470 N Oxbow Dr | 0.28mi | 3/2.0 | 1,493 (+1%) | 10mo | $300,000 | $201 | 77 |
| 230 Cottonwood Ln | 0.32mi | 3/2.0 | 1,547 (+5%) | 2mo | $477,635 | $309 | 76 |
| 100 Cottonwood Ln | 0.31mi | 3/2.0 | 1,410 (-5%) | 6mo | $371,000 | $263 | 73 |
| 640 E Desert Canyon Rd | 0.31mi | 3/2.0 | 1,374 (-7%) | 1mo | $353,000 | $257 | 73 |
| 60 W Monte Cristo Dr | 0.23mi | 3/2.0 | 1,333 (-10%) | 1mo | $352,000 | $264 | 72 |
| 570 S Jackson St | 0.17mi | 3/2.0 | 1,679 (+14%) | 4mo | $470,000 | $280 | 66 |
| 111 W Yavapai St | 0.24mi | 2/1.5 (-1) | 1,327 (-10%) | 2mo | $300,000 | $226 | 63 |
| 665 W Santa Fe Dr | 0.74mi | 2/2.0 (-1) | 1,456 (-2%) | 5mo | $430,000 | $295 | 53 |
| 770 Mount Pleasant Rd | 0.63mi | 2/2.0 (-1) | 1,650 (+12%) | 7mo | $405,000 | $245 | 41 |
Match score weights: distance 35% · size 25% · config 20% · recency 20%. Top-matched comps best support the ARV.
Projected returns pro-forma
-3.0% appreciation · 3.0% rent growth · sell at horizon
- IRR
- -8.3%
- Equity multiple
- 0.70×
- Total profit
- $-20,857
- Equity at exit
- $36,530
- IRR
- 1.2%
- Equity multiple
- 1.09×
- Total profit
- $5,860
- Equity at exit
- $21,183
Cash invested: $68,600 (down + closing). Projections, not guarantees.
Landlord ↔ Tenant lean methodology
- Overall (STATE)
- 87 Strongly Landlord-Friendly
- State Arizona
- 87 Strongly Landlord-Friendly · R+3
- County
- — inherits STATE
- City
- — inherits STATE
ZIP-level market 85390
- Home prices YoY
- -17.4%
- Active inventory
- 378
- Price-to-rent
- 9.0×
Monthly cashflow live
- Estimated rent
- $2,269 high interval (Pro) →
- Mortgage (P&I)
- −$1,285
- Tax from tax record
- −$42 /mo · $501/yr
- Insurance
- −$102
- Flood insurance flood zone
- −$66 /mo · $798/yr
- HOA
- −$0
- Vacancy / Maint / Mgmt
- −$476
- Net cashflow
- $297
Break-even live
UW: 25.0% down · 7.5% · 30yr · 1.5% tax · 5.0% vac · 8.0% maint · 8.0% mgmt
Financing live
Cash to close
- Down payment
- $61,250
- Closing costs
- $7,350
- Reserves months
- —
- Total cash needed
- —
Loan-product check · same deal, 3 products live
Conventional
25% down · 7.5% · 30yr
- Down + closing
- —
- Monthly P&I
- —
- Monthly cashflow
- —
- DSCR
- —
- Eligible?
- —
Personal DTI + credit; lowest rate.
DSCR
20% down · 8.5% · 30yr
- Down + closing
- —
- Monthly P&I
- —
- Monthly cashflow
- —
- DSCR
- —
- Eligible?
- —
No personal income docs; deal must DSCR.
Hard money
10% down · 12.0% · 12mo
- Down + closing
- —
- Monthly P&I
- —
- Monthly cashflow
- —
- DSCR
- —
- Eligible?
- —
Short-term bridge; refi at stabilization.
Rent comps 18 comps
| Address | Beds | Baths | Sqft | Rent | $/sqft | DOM | Units | Dist |
|---|---|---|---|---|---|---|---|---|
| 70 W Monte Cristo Dr Wickenburg, AZ | 3.0 | 2.0 | 1338 | $3,000 | $2.24 | 1d | 1 | 0.23mi |
| 70 W Monte Cristo Dr Wickenburg, AZ | 3.0 | 2.0 | 1338 | $3,000 | $2.24 | 10d | 1 | 0.23mi |
| 600 Desert Canyon Rd Wickenburg, AZ | 3.0 | 2.0 | 1498 | $1,850 | $1.23 | 43d | 1 | 0.26mi |
| 18 W Monte Cristo Dr Wickenburg, AZ | 3.0 | 2.0 | 1338 | $2,100 | $1.57 | 19d | 1 | 0.31mi |
| 40 Cottonwood Ln Wickenburg, AZ | 3.0 | 2.0 | 1204 | $1,900 | $1.58 | 1d | 1 | 0.35mi |
| 900 W Hermosa Dr Wickenburg, AZ | 3.0 | 2.0 | 1737 | $3,000 | $1.73 | 43d | 1 | 0.91mi |
| 600 El Recreo Ct Wickenburg, AZ | 3.0 | 2.0 | 1197 | $1,800 | $1.50 | 21d | 1 | 0.93mi |
| 600 El Recreo Ct Wickenburg, AZ | 3.0 | 2.0 | 1197 | $1,800 | $1.50 | 1d | 1 | 0.93mi |
| 1 Northridge Cir Wickenburg, AZ | 2.0 | 2.0 | 1224 | $1,800 | $1.47 | 43d | 1 | 1.06mi |
| 54 Northridge Cir Unit 1 Wickenburg, AZ | 2.0 | 2.0 | 1227 | $1,800 | $1.47 | 3d | 1 | 1.08mi |
| 54 Northridge Cir Wickenburg, AZ | 2.0 | 2.5 | 1227 | $1,800 | $1.47 | 16d | 1 | 1.08mi |
| 54 Northridge Cir Wickenburg, AZ | 2.0 | 2.5 | 1227 | $1,800 | $1.47 | 5d | 1 | 1.08mi |
| 737 Dylan Ct Wickenburg, AZ | 3.0 | 2.0 | 1542 | $1,750 | $1.13 | 43d | 1 | 1.11mi |
| 640 Atchison Cir Wickenburg, AZ | 3.0 | 2.0 | 1611 | $3,500 | $2.17 | 43d | 1 | 1.11mi |
| 741 Dylan Ct Wickenburg, AZ | 3.0 | 2.0 | 1548 | $1,645 | $1.06 | 21d | 1 | 1.11mi |
| 736 Dylan Ct Wickenburg, AZ | 3.0 | 2.0 | 1543 | $1,750 | $1.13 | 43d | 1 | 1.13mi |
| 757 Dylan Ct Wickenburg, AZ | 3.0 | 2.0 | 1290 | $1,585 | $1.23 | 5d | 1 | 1.14mi |
| 560 Penn Ln Wickenburg, AZ | 2.0–3.0 | 2.0 | 1051 | $1,675 | $1.59 | 1d | 6 | 1.27mi |
Listing history 50 events
-
2026-06-18days on market $245,000 Active 34 DOM
-
2026-06-17days on market $245,000 Active 33 DOM
-
2026-06-16days on market $245,000 Active 32 DOM
-
2026-06-15days on market $245,000 Active 31 DOM
-
2026-06-13days on market $245,000 Active 29 DOM
-
2026-06-13days on market $245,000 Active 28 DOM
-
2026-06-09days on market $245,000 Active 25 DOM
-
2026-06-08days on market $245,000 Active 24 DOM
-
2026-06-07days on market $245,000 Active 23 DOM
-
2026-06-04days on market $245,000 Active 20 DOM
-
2026-06-03days on market $245,000 Active 19 DOM
-
2026-06-02days on market $245,000 Active 18 DOM
-
2026-06-01days on market $245,000 Active 17 DOM
-
2026-05-31pricedays on market $245,000 Active 16 DOM
-
2026-05-15$250,000 Active 429-char remark
-
2026-02-20historical
-
2026-02-20historical
-
2025-11-19price $250,000
-
2025-11-19price $250,000
-
2025-10-07price $270,000
-
2025-08-11price $280,000
-
2025-08-11price $280,000
-
2025-08-05price $285,000
-
2025-08-04price $285,000
-
2025-07-29price $287,000
-
2025-07-29price $287,000
-
2025-07-23price $290,000
-
2025-07-23price $290,000
-
2025-07-14price $295,000
-
2025-07-07price $295,000
-
2025-05-19price $300,000
-
2025-05-19price $300,000
-
2024-07-29price $320,000
-
2024-07-29price $320,000
-
2024-07-08price $325,000
-
2024-07-08price $325,000
-
2024-06-07$335,000 Active
-
2024-06-02$335,000 Active
-
2022-11-28historical
-
2022-09-30price $305,000
-
2022-09-30status Active
-
2022-08-24historical
-
2022-08-20price $310,000
-
2022-08-12price $329,000
-
2022-07-26$350,000 Active
-
2021-05-28soldstatus $207,500 Closed
-
2021-05-28soldstatus $207,500
-
2021-05-26historical Under Contract Accepting Backups
-
2021-05-26$199,900 Active
-
2021-05-25soldstatus $207,500 Closed
ⓘ Source: listings_history table (triggers on properties + properties_extension) + one-shot
backfill from property_details.listing_events for pre-trigger history.
Tax reassessment forecast AZ · Resets to sale price
- Current annual tax
- $501 · $42/mo
- Projected year-2 tax
- $1,617 · $135/mo
- Expected delta
- +$1,116/yr (+$93/mo · 222.7%)
ⓘ Screening estimate from a state-policy table — verify with the county assessor before closing.
Climate risk First Street
- Flood 7/10 Severe FEMA zone X (shaded) · 77% chance over 30 yrs
- Wildfire 5/10 Major
- Heat 8/10 Severe 7 d/yr ≥110°F today · 18 d/yr by 30 yrs out
- Wind 1/10 Low
- Air quality 1/10 Low 0 unhealthy d/yr today · 0 by 30 yrs out
Nearby sold comps map
Loading sold comps map…
Walkable amenities ~0.75 mi
Loading nearby amenities…
Taxation est. · year 1
- Rental income
- $27,225
- − Mortgage interest
- −$13,724
- − Property taxes
- −$501
- − Insurance
- −$2,022
- − Repairs & maintenance
- −$2,178
- − Management
- −$2,178
- − Depreciation
- −$7,127
- Taxable loss
- −$505
- Est. tax savings @ 24.0%
- +$121
- After-tax cash flow
- $3,688/yr
For passive investors: Depreciation is non-cash, so a rental often shows a tax loss while cash-flowing — sheltering income. Rental losses are passive: they offset passive income freely, and up to $25,000/yr can offset ordinary (W-2) income if you actively participate and your MAGI is under $100k (phasing out to $0 by $150k); unused losses carry forward. On sale, claimed depreciation is recaptured at up to 25%, and gains may owe capital-gains tax (a 1031 exchange can defer both). Figures are a year-1 estimate at your 24.0% rate — not tax advice; consult a CPA.
Schools (NCES district)
- District
- Wickenburg Unified District (4236)
- NCES district ID
- 0409190
- Math proficiency
- 33% ▼ -10.00%
- Reading proficiency
- 35% ▼ -7.00%
- Median HH income
- $47,369
- Composite
- 29.27/100
- National rank
- #6560
- State rank
- #92 of 249 in AZ
Livability — Wickenburg
- Score
- 70/100
- State rank
- #41
- US rank
- #7975
Category grades
Schools grade is shown separately in the Schools card above.
Census & demographics
- Census place
- Wickenburg, AZ
- County
- Maricopa County · 4,537,380 people
- City population
- 10,298
- Metro
- Phoenix-Mesa-Chandler, AZ
- Population (ZIP)
- 10,298
- Household income
- $68,591
- Rent vs Own
- Severe rent burden
- 251.0
Population outlook (Maricopa County) Hauer SSP2
- Today (2025)
- 4,979,203 people
- By 2030
- 5,378,229 · +8.0%
- By 2040
- 6,156,598 · +23.6%
- By 2050
- 6,872,376 · +38.0%
- By 2075
- 8,401,270 · +68.7%
- By 2100
- 9,247,439 · +85.7%
Race, ethnicity, and origin ACS 2023
- Neighborhood character
- Predominantly White (88%)
- Race & ethnicity
- White 88% Hispanic / Latino 7% Two or more races 4% Native American 1%
- Hispanic origin (detail)
- Mexican 5%
- Common ancestry
- Portuguese 3% Lithuanian 3% Slovak 2%
- Foreign-born
- 3% · Canada
- Languages at home
- 93% English-only · Spanish 5%
Political lean MEDSL · Maricopa
- 2024 margin
- Toss-up / Even · D 47.7% · R 51.2% · Other 1.1%
- 2008→2024 swing
- +7.1pp toward D · 2008: -10.6pp · 2024: -3.5pp
- All cycles
- 2024: R+3.5 2020: D+2.2 2016: R+3.5 2012: R+12.0 2008: R+10.6
Not yet ingested
- Civics
- —
Market trends
- HPI YoY
- ▼ -66.26%
- Current HPI
- 314.3169
- Rent YoY
- —
- Metro
- Phoenix-Mesa-Chandler, AZ
- State GDP YoY
- ▲ 4.54%
- F500 in state
- 20
Industry mix (Fortune 500 HQ in AZ)
| Industry | F500 HQs | Revenue |
|---|---|---|
| Technology | 2 | $13B |
|
||
| Mining / Metals | 1 | $23B |
|
||
| Environmental Services | 1 | $16B |
|
||
| Metals / Steel | 1 | $14B |
|
||
| Technology Distribution | 1 | $9B |
|
||
| Homebuilding | 1 | $8B |
|
||
Price history
+336.2% since first listed45 events — show timeline
- 2026-05-30 Price Changed $245,000 ARMLS
- 2026-05-30 Price Changed $245,000 PAARMLS as Distributed by MLS Grid
- 2026-05-18 Listed $250,000 PAARMLS as Distributed by MLS Grid
- 2026-05-15 Listed $250,000 ARMLS
- 2026-02-20 Listing Removed — PAARMLS as Distributed by MLS Grid
- 2026-02-20 Listing Removed — ARMLS
- 2025-11-19 Price Changed $250,000 PAARMLS as Distributed by MLS Grid
- 2025-11-19 Price Changed $250,000 ARMLS
- 2025-10-07 Price Changed $270,000 PAARMLS as Distributed by MLS Grid
- 2025-08-11 Price Changed $280,000 PAARMLS as Distributed by MLS Grid
- 2025-08-11 Price Changed $280,000 ARMLS
- 2025-08-05 Price Changed $285,000 PAARMLS as Distributed by MLS Grid
- 2025-08-04 Price Changed $285,000 ARMLS
- 2025-07-29 Price Changed $287,000 PAARMLS as Distributed by MLS Grid
- 2025-07-29 Price Changed $287,000 ARMLS
- 2025-07-23 Price Changed $290,000 PAARMLS as Distributed by MLS Grid
- 2025-07-23 Price Changed $290,000 ARMLS
- 2025-07-14 Price Changed $295,000 PAARMLS as Distributed by MLS Grid
- 2025-07-07 Price Changed $295,000 ARMLS
- 2025-05-19 Price Changed $300,000 PAARMLS as Distributed by MLS Grid
- 2025-05-19 Price Changed $300,000 ARMLS
- 2024-07-29 Price Changed $320,000 PAARMLS as Distributed by MLS Grid
- 2024-07-29 Price Changed $320,000 ARMLS
- 2024-07-08 Price Changed $325,000 PAARMLS as Distributed by MLS Grid
- 2024-07-08 Price Changed $325,000 ARMLS
- 2024-06-07 Listed $335,000 PAARMLS as Distributed by MLS Grid
- 2024-06-02 Listed $335,000 ARMLS
- 2022-11-28 Listing Removed — ARMLS
- 2022-09-30 Price Changed $305,000 ARMLS
- 2022-09-30 Relisted — ARMLS
- 2022-08-24 Listing Removed — ARMLS
- 2022-08-20 Price Changed $310,000 ARMLS
- 2022-08-12 Price Changed $329,000 ARMLS
- 2022-07-26 Listed $350,000 ARMLS
- 2021-05-28 Sold (Public Records) $207,500 Public Records
- 2021-05-28 Sold (MLS) $207,500 ARMLS
- 2021-05-26 Contingent — ARMLS
- 2021-05-26 Listed $199,900 ARMLS
- 2021-05-25 Sold (MLS) $207,500 ARMLS
- 2021-04-27 Contingent — ARMLS
- 2021-04-19 Listed $199,900 ARMLS
- 1996-03-26 Sold (Public Records) $79,250 Public Records
- 1995-01-13 Sold (Public Records) $69,000 Public Records
- 1993-10-07 Sold (Public Records) $35,000 Public Records
- 1987-03-16 Sold (Public Records) $56,164 Public Records
Property tax history
-2.1%/yrLatest (2025): $501 · +0.5% YoY. Source: county tax records.
Cash-flow waterfall
monthlySold comps — $/sqft
last 12 mo · ≤1 miLoading sold comps…