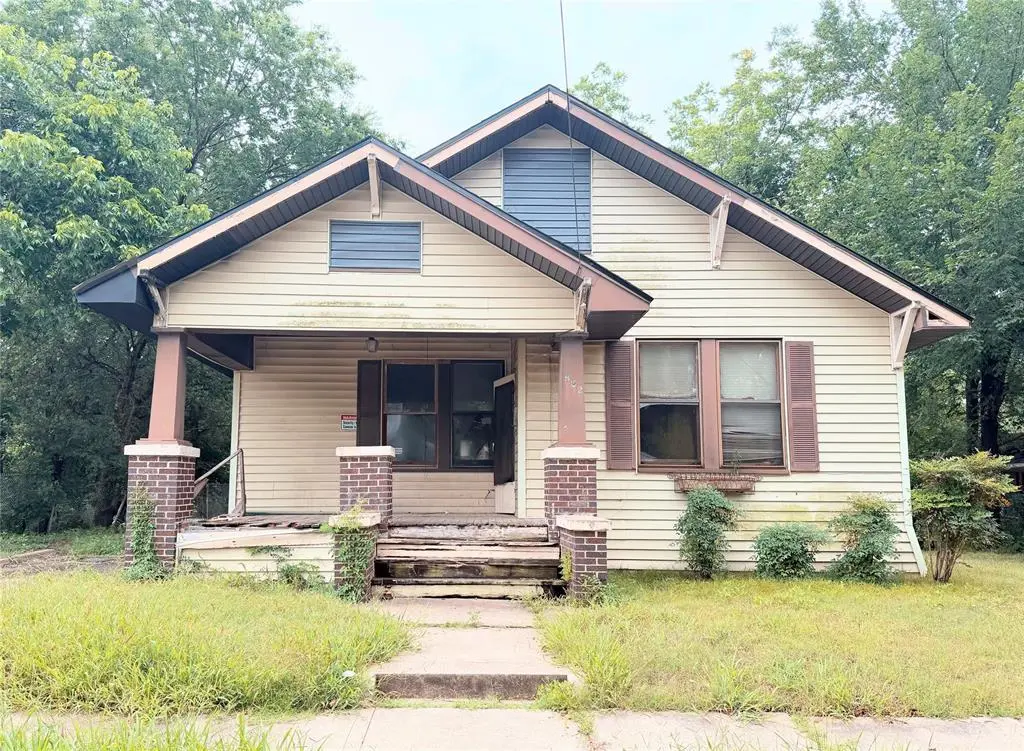
822 E Commerce St · Mexia, TX
Flood risk 1/10 · Minimal
- FEMA flood zone
- X (unshaded)
- Chance of flooding over 30 yrs
- 0.0%
- Est. flood insurance / yr
- $507 – $1,088
Fire risk 6/10 · Moderate
- Est. fire insurance / yr
- $1,222 – $2,270
Heat risk 7/10 · Major
- Hot days now (above 109°F)
- 7 days/yr
- Hot days in 30 yrs
- 25 days/yr
Wind risk 6/10 · Moderate
- Chance of severe wind over 30 yrs
- 65.0%
Air-quality risk 1/10 · Minimal
- Unhealthy air days now
- 0 days/yr
- Unhealthy air days in 30 yrs
- 0 days/yr
Risk factors via First Street. Map © Google.
Why this score? — see what drove the B+ grade
The composite is a weighted blend of 9 inputs, each scored 0–100. Each bar is that input's sub-score; the figure is the points it added to the 100-point composite (weight × sub-score).
- Cash flow +30.0/30.0
- ARV discount +15.0/15.0
- 1% rule +10.0/10.0
- DSCR +10.0/10.0
- Livability +3.4/5.0
- Rent growth +2.5/5.0
- Condition / age +2.5/5.0
- Schools +2.2/10.0
- Appreciation +0.0/10.0
$85,000
🖨 Deal sheet 📄 Offer letter ✓ Due diligence
Listing remarks
Great opportunity for investment! Owner has installed new roof on both buildings, and new electrical meters to both the main residence as well as the converted garage space. This three bedroom one bath craftsman style home has 1908 square feet, includes sunroom and utility room. You will love the hardwood floors! The property sits on . 22 acres and the large backyard is chain-linked fenced a with gorgeous pecan trees in front and back. OWNER FINANCING AVAILABLE!
Key facts
- Utility room
- Large backyard
- Sunroom
Tags
Property features AI
Finance
- Other: Property offered with cash or owner financing available; Listing is active and for sale
- HOA & community: No association
Exterior
- Parking: Driveway parking
- Utilities: City water; City sewer; Electricity available; Curbs and sidewalk
- Home design: Single-family residence; One-story; Accessory unit included
- Construction: Built in 1964; Brick, siding and wood construction; Composition roof
- Exterior features: Covered porch(es); Covered patio/porch; Chain link fencing; Grassed yard; Few trees on the lot
Interior
- Kitchen: Kitchen with built-in cabinets; No listed appliances
- Bedrooms: 3 bedrooms on the main level
- Flooring: Hardwood flooring; Tile flooring
- Bathrooms: 1 full bathroom
- Interior features: Built-in features and pantry; Paneling; One living area; One dining area; Total of 6 rooms; Accessory unit present (432 sq ft)
- Laundry & utility: Utility room
Neighborhood map
What this means for you Summary
Snapshot
- This is a 3-bed/2.0-bath single-family listed at $85k.
Deal economics
- At list price, monthly cash flow is $330 ($4k/yr) — positive.
- The deal already cash-flows at list — no discount required.
- Meets the 1% rule at list price ($1k rent vs $85k).
- Cap rate 10.9% vs local median 3.6% in Mexia — top-decile yield for the area; either an underpriced asset or a hidden risk that comps aren't pricing in. Stress-test before assuming the spread holds.
Location & tenants
- Location reads 68/100 on livability (#458 in TX) — a middle-class / working-renter tenant base. Strengths: cost of living A+, housing A+, health & safety B+; Watch: crime C-, amenities F, commute F.
- Mexia ISD (town): math 22% / reading 32% proficiency, ranked #696 of 826 in TX (top 84%) — low school quality limits family demand, transient renter base, plan for 1-2y turnover; 69% free/reduced lunch — lower-income household profile, screen leases tightly.
- Zoned schools: A B Mcbay El (527 students, 86% FRL) — zoned schools average 86% FRL vs 69% district-wide (18 pts higher); higher-poverty schools than district average — tighter screening recommended.
- Market conditions: 129 active listings in the ZIP; 17 units permitted in Limestone County in 2024 (0 in 5+ unit buildings).
Forward outlook
- Local home prices are declining (-3.0%/yr); year-one equity from $588 of loan paydown is wiped out by about $3k of value loss. Plan a longer hold.
- Limestone County population projected to shrink 4% by 2050 — rents likely to lag national; underwrite the cash flow, not the appreciation.
- At projected returns (-3.0% appreciation + 3.0% rent growth), your $24k cash investment doubles in ~8 years — after that, you're playing with house money.
Negotiation context
- Only 6 days on market — expect competitive offers; lowballing is unlikely to land.
- 2 sale attempts with the ask held roughly flat each time — persistent listings suggest the price (not the market) is what's stuck; bring a comps-based counter.
Risks & watch-outs
- Watch-outs: property tax is 3.5% of price.
- Climate carrying-cost: major wind risk, 65% chance of damaging wind over 30y; major wildfire risk; extreme-heat days projected 7→25/yr by 2055 (HVAC capex compounding) — expect insurance premiums to compound above CPI over the hold.
Questions for the listing agent
- Built in 1964 — when were the roof, HVAC, electrical panel, plumbing, and water heater last replaced?
- Property tax is high relative to price — has the assessment been appealed recently, and will the sale trigger a re-assessment?
- Is there a deadline driving the sale (1031 exchange, divorce, estate, relocation)? That informs how much negotiation room exists.
- Schools are F-rated, which usually means shorter tenancies and higher turnover. Who's the typical renter profile here, and what's been the actual vacancy rate?
- What's the average days-on-market for RENTAL listings here right now (not sales)? A rising rental-DOM trend means longer vacancies and softer asking-rent achievability than the comps imply.
- What's the recent tenant-quality profile in this submarket — average credit score on applications, eviction rate, late-payment / NSF rate, and stable-employment percentage? A property-management company in the area should have these aggregated.
- How much new for-sale + rental construction is in the pipeline within 1–3 miles? Heavy new supply typically softens prices + rents 12–24 months out; constrained supply supports both.
Investment metrics
- 1% rule
- 1.58% ✓
- Cap rate
- 10.95%
- Cash-on-cash
- 16.63%
- DSCR
- 1.74
- GRM
- 5.3
CMA / ARV
- ARV (on-the-fly)
- $150,732
- Comps found
- 6
Show comp detail 6 sales within ~0.75 mi
| Address | Dist | Beds/Ba | Sqft | Sold | Price | $/sf | Match |
|---|---|---|---|---|---|---|---|
| 908 E Titus St | 0.21mi | 3/2.0 | 2,040 (+7%) | 1mo | $57,500 | $28 | 78 |
| 600 N Bailey St | 0.40mi | 3/2.0 | 1,817 (-5%) | 14mo | $170,000 | $94 | 62 |
| 812 E Sumpter St | 0.31mi | 4/2.0 (+1) | 1,956 (+2%) | 18mo | $55,000 | $28 | 61 |
| 910 Varella | 0.63mi | 3/2.0 | 2,004 (+5%) | 3mo | $159,000 | $79 | 59 |
| 1125 E Palestine St | 0.48mi | 3/2.0 | 2,114 (+11%) | 1mo | $120,000 | $57 | 59 |
| 1120 Tamarisk Dr | 0.60mi | 3/2.0 | 2,088 (+9%) | 4mo | $199,900 | $96 | 53 |
Match score weights: distance 35% · size 25% · config 20% · recency 20%. Top-matched comps best support the ARV.
Projected returns pro-forma
-3.0% appreciation · 3.0% rent growth · sell at horizon
- IRR
- 7.9%
- Equity multiple
- 1.31×
- Total profit
- $7,342
- Equity at exit
- $12,674
- IRR
- 17.2%
- Equity multiple
- 2.42×
- Total profit
- $33,884
- Equity at exit
- $7,349
Cash invested: $23,800 (down + closing). Projections, not guarantees.
Landlord ↔ Tenant lean methodology
- Overall (STATE)
- 87 Strongly Landlord-Friendly
- State Texas
- 87 Strongly Landlord-Friendly · R+5
- County
- — inherits STATE
- City
- — inherits STATE
ZIP-level market 76667
- Home prices YoY
- -8.9%
- Active inventory
- 129
- Price-to-rent
- 5.3×
Monthly cashflow live
- Estimated rent
- $1,343 medium interval (Pro) →
- Mortgage (P&I)
- −$446
- Tax from tax record
- −$250 /mo · $2,998/yr
- Insurance
- −$35
- HOA
- −$0
- Vacancy / Maint / Mgmt
- −$282
- Net cashflow
- $330
Break-even live
UW: 25.0% down · 7.5% · 30yr · 1.5% tax · 5.0% vac · 8.0% maint · 8.0% mgmt
Financing live
Cash to close
- Down payment
- $21,250
- Closing costs
- $2,550
- Reserves months
- —
- Total cash needed
- —
Loan-product check · same deal, 3 products live
Conventional
25% down · 7.5% · 30yr
- Down + closing
- —
- Monthly P&I
- —
- Monthly cashflow
- —
- DSCR
- —
- Eligible?
- —
Personal DTI + credit; lowest rate.
DSCR
20% down · 8.5% · 30yr
- Down + closing
- —
- Monthly P&I
- —
- Monthly cashflow
- —
- DSCR
- —
- Eligible?
- —
No personal income docs; deal must DSCR.
Hard money
10% down · 12.0% · 12mo
- Down + closing
- —
- Monthly P&I
- —
- Monthly cashflow
- —
- DSCR
- —
- Eligible?
- —
Short-term bridge; refi at stabilization.
Listing history 10 events
-
2026-06-03days on market $85,000 Active 6 DOM
-
2026-06-02days on market $85,000 Active 5 DOM
-
2026-06-01days on market $85,000 Active 4 DOM
-
2026-05-31days on market $85,000 Active 3 DOM
-
2026-05-27$85,000 Active
-
2026-02-20historical
-
2025-11-15$99,000 Active
-
2008-01-09soldstatus
-
2007-04-23soldstatus
-
2006-11-16soldstatus
ⓘ Source: listings_history table (triggers on properties + properties_extension) + one-shot
backfill from property_details.listing_events for pre-trigger history.
Tax reassessment forecast TX · Resets to sale price
- Current annual tax
- $2,998 · $250/mo
- Projected year-2 tax
- $2,998 · $250/mo
- Expected delta
- $0/yr ($0/mo · 0.0%)
ⓘ Screening estimate from a state-policy table — verify with the county assessor before closing.
Climate risk First Street
- Flood 1/10 Low FEMA zone X (unshaded) · 0% chance over 30 yrs
- Wildfire 6/10 Major
- Heat 7/10 Severe 7 d/yr ≥109°F today · 25 d/yr by 30 yrs out
- Wind 6/10 Major 65% chance of damaging wind over 30 yrs
- Air quality 1/10 Low 0 unhealthy d/yr today · 0 by 30 yrs out
Nearby sold comps map
Loading sold comps map…
Walkable amenities ~0.75 mi
Loading nearby amenities…
Taxation est. · year 1
- Rental income
- $16,113
- − Mortgage interest
- −$4,761
- − Property taxes
- −$2,998
- − Insurance
- −$425
- − Repairs & maintenance
- −$1,289
- − Management
- −$1,289
- − Depreciation
- −$2,473
- Taxable income
- $2,879
- Est. tax owed @ 24.0%
- −$691
- After-tax cash flow
- $3,267/yr
For passive investors: Depreciation is non-cash, so a rental often shows a tax loss while cash-flowing — sheltering income. Rental losses are passive: they offset passive income freely, and up to $25,000/yr can offset ordinary (W-2) income if you actively participate and your MAGI is under $100k (phasing out to $0 by $150k); unused losses carry forward. On sale, claimed depreciation is recaptured at up to 25%, and gains may owe capital-gains tax (a 1031 exchange can defer both). Figures are a year-1 estimate at your 24.0% rate — not tax advice; consult a CPA.
Schools (NCES district)
- District
- Mexia ISD
- NCES district ID
- 4830420
- Math proficiency
- 22% ▼ -10.00%
- Reading proficiency
- 32% ▬ 0.00%
- Median HH income
- $37,464
- Composite
- 22.48/100
- National rank
- #8101
- State rank
- #696 of 826 in TX
Livability — Mexia
- Score
- 68/100
- State rank
- #458
- US rank
- #9265
Category grades
Schools grade is shown separately in the Schools card above.
Census & demographics
- Census place
- Mexia, TX
- Population (ZIP)
- 10,494
Population outlook (Limestone County) Hauer SSP2
- Today (2025)
- 23,396 people
- By 2030
- 23,214 · -0.8%
- By 2040
- 22,829 · -2.4%
- By 2050
- 22,516 · -3.8%
- By 2075
- 22,088 · -5.6%
- By 2100
- 20,354 · -13.0%
Race, ethnicity, and origin ACS 2023
- Neighborhood character
- Diverse neighborhood (Simpson 0.67)
- Race & ethnicity
- White 45% Hispanic / Latino 29% Two or more races 24% Black 21%
- Hispanic origin (detail)
- Mexican 26%
- Common ancestry
- Serbian 3% Slovak 2% Italian 2%
- Foreign-born
- 11% · Canada
- Languages at home
- 77% English-only · Spanish 23%
Political lean MEDSL · Limestone
- 2024 margin
- Solid R (+56.9) · D 21.2% · R 78.1%
- 2008→2024 swing
- -23.4pp toward R · 2008: -33.5pp · 2024: -56.9pp
- All cycles
- 2024: R+56.9 2020: R+50.3 2016: R+52.3 2012: R+40.7 2008: R+33.5
Not yet ingested
- Civics
- —
Market trends
- HPI YoY
- ▼ -15.91%
- Current HPI
- 161.8191
- Rent YoY
- —
- Metro
- —
- State GDP YoY
- ▲ 3.95%
- F500 in state
- 110
Industry mix (Fortune 500 HQ in TX)
| Industry | F500 HQs | Revenue |
|---|---|---|
| Energy | 16 | $1,198B |
|
||
| Technology | 5 | $198B |
|
||
| Engineering / Construction | 4 | $72B |
|
||
| Energy Services | 3 | $60B |
|
||
| Utilities | 3 | $41B |
|
||
| Healthcare | 2 | $330B |
|
||
Price history
-14.1% since first listed6 events — show timeline
- 2026-05-27 Listed $85,000 NTREIS
- 2026-02-20 Listing Removed — NTREIS
- 2025-11-15 Listed $99,000 NTREIS
- 2008-01-09 Sold (Public Records) — Public Records
- 2007-04-23 Sold (Public Records) — Public Records
- 2006-11-16 Sold (Public Records) — Public Records
Property tax history
+10.3%/yrLatest (2025): $2,998 · +28.2% YoY. Source: county tax records.
Cash-flow waterfall
monthlySold comps — $/sqft
last 12 mo · ≤1 miLoading sold comps…