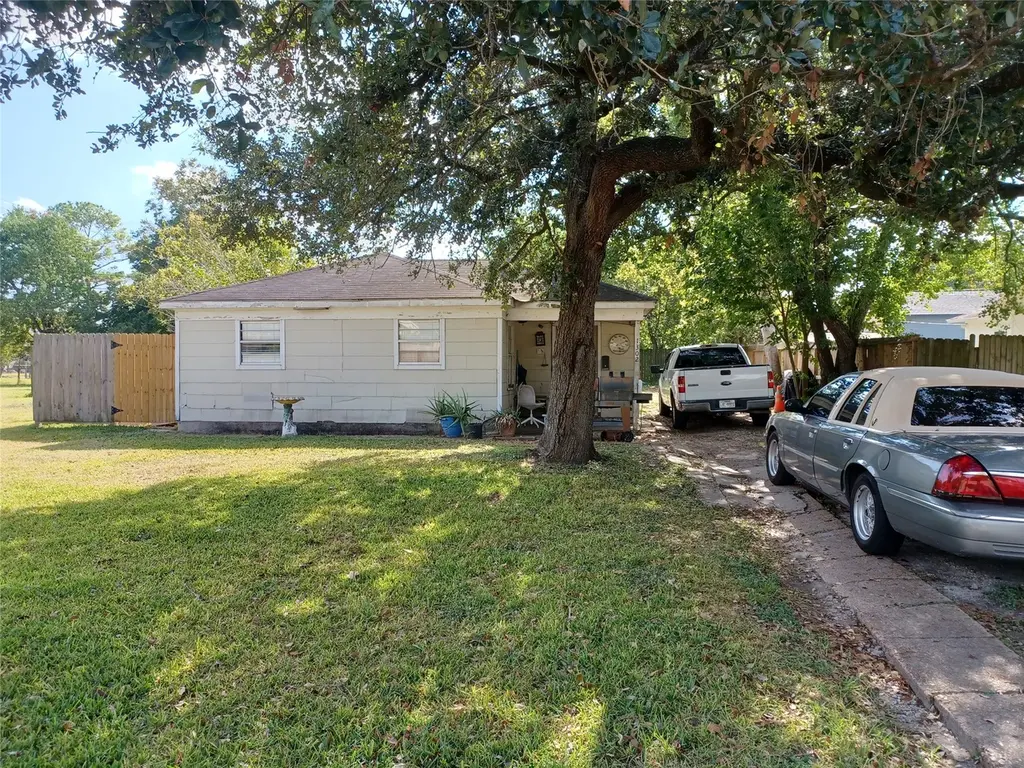
1302 Thomas Ave · Pasadena, TX
Flood risk 6/10 · Moderate
- FEMA flood zone
- X (unshaded)
- Chance of flooding over 30 yrs
- 0.73%
- Est. flood insurance / yr
- $507 – $1,088
Fire risk 1/10 · Minimal
- Est. fire insurance / yr
- $1,222 – $2,270
Heat risk 9/10 · Severe
- Hot days now (above 109°F)
- 7 days/yr
- Hot days in 30 yrs
- 22 days/yr
Wind risk 9/10 · Severe
- Chance of severe wind over 30 yrs
- 99.0%
Air-quality risk 2/10 · Minimal
- Unhealthy air days now
- 2 days/yr
- Unhealthy air days in 30 yrs
- 2 days/yr
Risk factors via First Street. Map © Google.
Why this score? — see what drove the C+ grade
The composite is a weighted blend of 9 inputs, each scored 0–100. Each bar is that input's sub-score; the figure is the points it added to the 100-point composite (weight × sub-score).
- Cash flow +22.5/30.0
- ARV discount +15.0/15.0
- 1% rule +7.5/10.0
- DSCR +7.2/10.0
- Livability +3.3/5.0
- Schools +2.6/10.0
- Rent growth +2.5/5.0
- Condition / age +2.5/5.0
- Appreciation +0.0/10.0
$84,000
🖨 Deal sheet 📄 Offer letter ✓ Due diligence
Listing remarks MLS
Great location. Great project.
Key facts
- 7,374 sq ft lot
- Built 1944
Neighborhood map
What this means for you Summary
Snapshot
- This is a 2-bed/1.0-bath single-family listed at $84k.
Deal economics
- At list price, monthly cash flow is $142 ($2k/yr) — positive.
- The deal already cash-flows at list — no discount required.
- Meets the 1% rule at list price ($1k rent vs $84k).
- Cap rate 8.3% vs local median 3.4% in Pasadena — top-decile yield for the area; either an underpriced asset or a hidden risk that comps aren't pricing in. Stress-test before assuming the spread holds.
Location & tenants
- Location reads 66/100 on livability (#600 in TX) — a middle-class / working-renter tenant base. Strengths: cost of living A+, housing A+; Watch: schools D+, employment D+, crime F.
- Pasadena ISD (suburban): math 29% / reading 32% proficiency, ranked #612 of 826 in TX (top 74%) — families likely to look elsewhere, expect single-tenant / working-renter base with shorter leases; 71% free/reduced lunch — lower-income household profile, screen leases tightly.
- Market conditions: 104 active listings in the ZIP; 25 comparable units currently listed for rent nearby; rentals leasing fast (median 13d on market — plan ~1-2 weeks tenant-placement turnaround); 29,883 units permitted in Harris County in 2024 (8,621 in 5+ unit buildings).
Forward outlook
- Local home prices are declining (-3.0%/yr); year-one equity from $581 of loan paydown is wiped out by about $3k of value loss. Plan a longer hold.
- Harris County population projected at +47% by 2050 — long-run rental-demand tailwind backs the buy-and-hold thesis.
Negotiation context
- Only 1 days on market — expect competitive offers; lowballing is unlikely to land.
- 2 sale attempts; this cycle's ask has dropped $14k (14%) from the opening price — seller is motivated, your offer sets the floor, not the list.
Risks & watch-outs
- Watch-outs: property tax is 3.0% of price; built in 1944 — expect roof / HVAC / electrical / plumbing capex.
- Climate carrying-cost: major flood risk; severe wind risk, 99% chance of damaging wind over 30y; extreme-heat days projected 7→22/yr by 2055 (HVAC capex compounding) — expect insurance premiums to compound above CPI over the hold.
Questions for the listing agent
- Built in 1944 — when were the roof, HVAC, electrical panel, plumbing, and water heater last replaced?
- Property tax is high relative to price — has the assessment been appealed recently, and will the sale trigger a re-assessment?
- Is there a deadline driving the sale (1031 exchange, divorce, estate, relocation)? That informs how much negotiation room exists.
- Schools are D-rated, which usually means shorter tenancies and higher turnover. Who's the typical renter profile here, and what's been the actual vacancy rate?
- Crime grade is F in this area — have there been break-ins, vandalism, or insurance claims at this property in the last 3 years? What carrier currently insures it and at what premium?
- What's the average days-on-market for RENTAL listings here right now (not sales)? A rising rental-DOM trend means longer vacancies and softer asking-rent achievability than the comps imply.
- What's the recent tenant-quality profile in this submarket — average credit score on applications, eviction rate, late-payment / NSF rate, and stable-employment percentage? A property-management company in the area should have these aggregated.
- How much new for-sale + rental construction is in the pipeline within 1–3 miles? Heavy new supply typically softens prices + rents 12–24 months out; constrained supply supports both.
Investment metrics
- 1% rule
- 1.25% ✓
- Cap rate
- 8.31%
- Cash-on-cash
- 7.22%
- DSCR
- 1.32
- GRM
- 6.7
CMA / ARV
- ARV (median comp)
- $155,150
- List price
- $84,000
- Delta
- -45.21%
- Verdict
- UNDERPRICED
- Comps
- 20 within 1.0 mi
Show comp detail 12 sales within ~0.75 mi
| Address | Dist | Beds/Ba | Sqft | Sold | Price | $/sf | Match |
|---|---|---|---|---|---|---|---|
| 1305 Jackson Ave | 0.41mi | 2/1.0 | 764 (-2%) | 2mo | $150,000 | $196 | 76 |
| 1207 Glenn Ave | 0.26mi | 2/1.0 | 799 (+2%) | 13mo | $185,000 | $232 | 73 |
| 1511 Harrop Ave | 0.36mi | 2/1.5 | 786 (+1%) | 11mo | $165,000 | $210 | 70 |
| 1414 Polk Ave | 0.24mi | 2/1.0 | 762 (-2%) | 18mo | $120,000 | $157 | 69 |
| 1204 Glenn Ave | 0.23mi | 2/1.0 | 770 (-1%) | 22mo | $179,990 | $234 | 69 |
| 1313 Glenn Ave | 0.30mi | 2/1.0 | 800 (+3%) | 20mo | $184,990 | $231 | 65 |
| 1323 Richard Ave | 0.36mi | 2/1.0 | 853 (+9%) | 7mo | $182,000 | $213 | 62 |
| 508 Garrett St | 0.18mi | 2/1.0 | 843 (+8%) | 20mo | $165,000 | $196 | 62 |
| 1212 Bernard St | 0.43mi | 2/1.0 | 776 (-0%) | 22mo | $59,000 | $76 | 61 |
| 1215 Bernard St | 0.47mi | 2/1.0 | 800 (+3%) | 21mo | $130,000 | $163 | 56 |
| 1513 Thomas Ave | 0.31mi | 3/2.0 (+1) | 861 (+10%) | 6mo | $99,900 | $116 | 54 |
| 810 Thomas Ave | 0.45mi | 1/0.5 (-1) | 864 (+11%) | 11mo | $119,990 | $139 | 45 |
Match score weights: distance 35% · size 25% · config 20% · recency 20%. Top-matched comps best support the ARV.
Projected returns pro-forma
-3.0% appreciation · 3.0% rent growth · sell at horizon
- IRR
- -5.1%
- Equity multiple
- 0.81×
- Total profit
- $-4,517
- Equity at exit
- $12,525
- IRR
- 4.6%
- Equity multiple
- 1.34×
- Total profit
- $8,004
- Equity at exit
- $7,263
Cash invested: $23,520 (down + closing). Projections, not guarantees.
Landlord ↔ Tenant lean methodology
- Overall (STATE)
- 87 Strongly Landlord-Friendly
- State Texas
- 87 Strongly Landlord-Friendly · R+5
- County
- — inherits STATE
- City
- — inherits STATE
ZIP-level market 77506
- Home prices YoY
- -15.5%
- Active inventory
- 104
- Price-to-rent
- 6.7×
Monthly cashflow live
- Estimated rent
- $1,050 high interval (Pro) →
- Mortgage (P&I)
- −$441
- Tax from tax record
- −$212 /mo · $2,548/yr
- Insurance
- −$35
- HOA
- −$0
- Vacancy / Maint / Mgmt
- −$220
- Net cashflow
- $142
Break-even live
UW: 25.0% down · 7.5% · 30yr · 1.5% tax · 5.0% vac · 8.0% maint · 8.0% mgmt
Financing live
Cash to close
- Down payment
- $21,000
- Closing costs
- $2,520
- Reserves months
- —
- Total cash needed
- —
Loan-product check · same deal, 3 products live
Conventional
25% down · 7.5% · 30yr
- Down + closing
- —
- Monthly P&I
- —
- Monthly cashflow
- —
- DSCR
- —
- Eligible?
- —
Personal DTI + credit; lowest rate.
DSCR
20% down · 8.5% · 30yr
- Down + closing
- —
- Monthly P&I
- —
- Monthly cashflow
- —
- DSCR
- —
- Eligible?
- —
No personal income docs; deal must DSCR.
Hard money
10% down · 12.0% · 12mo
- Down + closing
- —
- Monthly P&I
- —
- Monthly cashflow
- —
- DSCR
- —
- Eligible?
- —
Short-term bridge; refi at stabilization.
Rent comps 25 comps
| Address | Beds | Baths | Sqft | Rent | $/sqft | DOM | Units | Dist |
|---|---|---|---|---|---|---|---|---|
| 1034 W Village Ct Unit C Pasadena, TX | 2.0 | 1.0 | 730 | $945 | $1.29 | 44d | 1 | 0.61mi |
| 1744 Jenkins Rd Pasadena, TX | 1.0–2.0 | 1.0–2.0 | 807 | $1,365 | $1.69 | 5d | 1 | 0.70mi |
| 1750 Jenkins Rd Pasadena, TX | 2.0 | 2.0 | 926 | $1,135 | $1.23 | 44d | 1 | 0.71mi |
| 1125 Ann Pasadena, TX | 1.0 | 1.0 | 645 | $995 | $1.54 | 44d | 1 | 0.72mi |
| 1129 Witter St Pasadena, TX | 2.0 | 1.0 | 870 | $1,075 | $1.24 | 44d | 1 | 0.73mi |
| 910 Main St Pasadena, TX | 1.0–2.0 | 1.0 | 712 | $925 | $1.30 | 44d | 2 | 0.90mi |
| 1413 George St Pasadena, TX | 3.0 | 1.0 | 998 | $1,695 | $1.70 | 5d | 1 | 0.94mi |
| 1000 Curtis Ave Pasadena, TX | 1.0–2.0 | 1.0–2.0 | 744 | $1,274 | $1.71 | 5d | 14 | 0.96mi |
| 1007 Houston Ave Pasadena, TX | 1.0 | 1.0 | 539 | $870 | $1.61 | 44d | 1 | 0.96mi |
| 2401 Southmore Ave Pasadena, TX | 1.0–3.0 | 1.0–2.0 | 835 | $1,078 | $1.29 | 3d | 4 | 1.20mi |
| 621 Richey St Unit 424 Pasadena, TX | 2.0 | 2.0 | 770 | $1,040 | $1.35 | 5d | 1 | 1.36mi |
| 621 Richey St Unit 654 Pasadena, TX | 3.0 | 2.0 | 1100 | $1,332 | $1.21 | 3d | 1 | 1.36mi |
| 407 S Richey St Unit 458 Pasadena, TX | 1.0 | 1.0 | 700 | $699 | $1.00 | 13d | 1 | 1.40mi |
| 407 S Richey St Unit 2162 Pasadena, TX | 2.0 | 2.0 | 800 | $890 | $1.11 | 5d | 1 | 1.40mi |
| 407 S Richey St Unit 440 Pasadena, TX | 3.0 | 2.0 | 1100 | $1,345 | $1.22 | 13d | 1 | 1.40mi |
| 407 S Richey St Unit 481 Pasadena, TX | 1.0 | 1.0 | 700 | $745 | $1.06 | 13d | 1 | 1.40mi |
| 407 S Richey St Unit 1162 Pasadena, TX | 1.0 | 1.0 | 700 | $710 | $1.01 | 5d | 1 | 1.40mi |
| 407 S Richey St Unit 510 Pasadena, TX | 3.0 | 2.0 | 1000 | $1,032 | $1.03 | 3d | 1 | 1.40mi |
| 407 S Richey St Unit 481 Pasadena, TX | 1.0 | 1.0 | 700 | $707 | $1.01 | 3d | 1 | 1.40mi |
| 403 Garner Rd Pasadena, TX | 2.0 | 1.5 | 910 | $1,130 | $1.24 | 44d | 2 | 1.42mi |
| 407 S Richey St Unit 3047 Pasadena, TX | 3.0 | 2.0 | 1000 | $1,075 | $1.07 | 11d | 1 | 1.43mi |
| 407 S Richey St Unit 2047 Pasadena, TX | 2.0 | 2.0 | 800 | $882 | $1.10 | 3d | 1 | 1.43mi |
| 407 Richey St Pasadena, TX | 3.0 | 1.0–2.0 | 700 | $908 | $1.30 | 21d | 13 | 1.43mi |
| 727 S Richey St Pasadena, TX | 3.0 | 2.0 | 1100 | $1,275 | $1.16 | 44d | 1 | 1.45mi |
| 2120 Strawberry Rd Pasadena, TX | 1.0 | 1.0 | 600 | $758 | $1.26 | 44d | 1 | 1.46mi |
Listing history 10 events
-
2026-06-18pricestatusdays on market $84,000 Pending 1 DOM
-
2026-05-31days on market $85,000 Active 167 DOM
-
2026-04-06price $85,000 30-char remark
Show marketing remark (30 chars)
Great location. Great project.
-
2026-03-20price $89,500 30-char remark
Show marketing remark (30 chars)
Great location. Great project.
-
2026-02-19status Active 30-char remark
Show marketing remark (30 chars)
Great location. Great project.
-
2026-02-15status Pending 30-char remark
Show marketing remark (30 chars)
Great location. Great project.
-
2026-02-07status Pending 30-char remark
Show marketing remark (30 chars)
Great location. Great project.
-
2026-01-08price $115,000 30-char remark
Show marketing remark (30 chars)
Great location. Great project.
-
2025-12-11$98,000 Active 30-char remark
Show marketing remark (30 chars)
Great location. Great project.
-
1996-06-06soldstatus
ⓘ Source: listings_history table (triggers on properties + properties_extension) + one-shot
backfill from property_details.listing_events for pre-trigger history.
Tax reassessment forecast TX · Resets to sale price
- Current annual tax
- $2,548 · $212/mo
- Projected year-2 tax
- $2,548 · $212/mo
- Expected delta
- $0/yr ($0/mo · 0.0%)
ⓘ Screening estimate from a state-policy table — verify with the county assessor before closing.
Climate risk First Street
- Flood 6/10 Major FEMA zone X (unshaded) · 73% chance over 30 yrs
- Wildfire 1/10 Low
- Heat 9/10 Extreme 7 d/yr ≥109°F today · 22 d/yr by 30 yrs out
- Wind 9/10 Extreme 99% chance of damaging wind over 30 yrs
- Air quality 2/10 Low 2 unhealthy d/yr today · 2 by 30 yrs out
Nearby sold comps map
Loading sold comps map…
Walkable amenities ~0.75 mi
Loading nearby amenities…
Taxation est. · year 1
- Rental income
- $12,597
- − Mortgage interest
- −$4,705
- − Property taxes
- −$2,548
- − Insurance
- −$420
- − Repairs & maintenance
- −$1,008
- − Management
- −$1,008
- − Depreciation
- −$2,444
- Taxable income
- $465
- Est. tax owed @ 24.0%
- −$112
- After-tax cash flow
- $1,586/yr
For passive investors: Depreciation is non-cash, so a rental often shows a tax loss while cash-flowing — sheltering income. Rental losses are passive: they offset passive income freely, and up to $25,000/yr can offset ordinary (W-2) income if you actively participate and your MAGI is under $100k (phasing out to $0 by $150k); unused losses carry forward. On sale, claimed depreciation is recaptured at up to 25%, and gains may owe capital-gains tax (a 1031 exchange can defer both). Figures are a year-1 estimate at your 24.0% rate — not tax advice; consult a CPA.
Schools (NCES district)
- District
- Pasadena ISD
- NCES district ID
- 4834320
- Math proficiency
- 29% ▼ -17.00%
- Reading proficiency
- 32% ▼ -9.00%
- Median HH income
- $45,163
- Composite
- 26.15/100
- National rank
- #7275
- State rank
- #612 of 826 in TX
Livability — Pasadena
- Score
- 66/100
- State rank
- #600
- US rank
- #11438
Category grades
Schools grade is shown separately in the Schools card above.
Census & demographics
- Census place
- Pasadena, TX
- City population
- 109,190
- Population (ZIP)
- 35,243
Population outlook (Harris County) Hauer SSP2
- Today (2025)
- 5,571,493 people
- By 2030
- 6,089,821 · +9.3%
- By 2040
- 7,142,806 · +28.2%
- By 2050
- 8,185,864 · +46.9%
- By 2075
- 10,574,329 · +89.8%
- By 2100
- 12,109,958 · +117.4%
Race, ethnicity, and origin ACS 2023
- Neighborhood character
- Predominantly Hispanic (89%)
- Race & ethnicity
- Hispanic / Latino 89% Two or more races 36% White 9% Black 1% Native American 1%
- Hispanic origin (detail)
- Mexican 77%
- Common ancestry
- Italian 1%
- Foreign-born
- 39% · Canada
- Languages at home
- 30% English-only · Spanish 69%
Political lean MEDSL · Harris
- 2024 margin
- Lean D (+5.5) · D 52.0% · R 46.4% · Other 1.6%
- 2008→2024 swing
- +3.9pp toward D · 2008: 1.6pp · 2024: 5.5pp
- All cycles
- 2024: D+5.5 2020: D+13.3 2016: D+12.4 2012: D+0.1 2008: D+1.6
Not yet ingested
- Civics
- —
Market trends
- HPI YoY
- ▼ -57.82%
- Current HPI
- 315.9695
- Rent YoY
- —
- Metro
- —
- State GDP YoY
- ▲ 3.95%
- F500 in state
- 110
Industry mix (Fortune 500 HQ in TX)
| Industry | F500 HQs | Revenue |
|---|---|---|
| Energy | 16 | $1,198B |
|
||
| Technology | 5 | $198B |
|
||
| Engineering / Construction | 4 | $72B |
|
||
| Energy Services | 3 | $60B |
|
||
| Utilities | 3 | $41B |
|
||
| Healthcare | 2 | $330B |
|
||
Price history
-13.3% since first listed8 events — show timeline
- 2026-04-06 Price Changed $85,000 HARMLS
- 2026-03-20 Price Changed $89,500 HARMLS
- 2026-02-19 Relisted — HARMLS
- 2026-02-15 Pending — HARMLS
- 2026-02-07 Pending — HARMLS
- 2026-01-08 Price Changed $115,000 HARMLS
- 2025-12-11 Listed $98,000 HARMLS
- 1996-06-06 Sold (Public Records) — Public Records
Property tax history
+8.2%/yrLatest (2025): $2,548 · -11.8% YoY. Source: county tax records.
Cash-flow waterfall
monthlySold comps — $/sqft
last 12 mo · ≤1 miLoading sold comps…