 Duplex
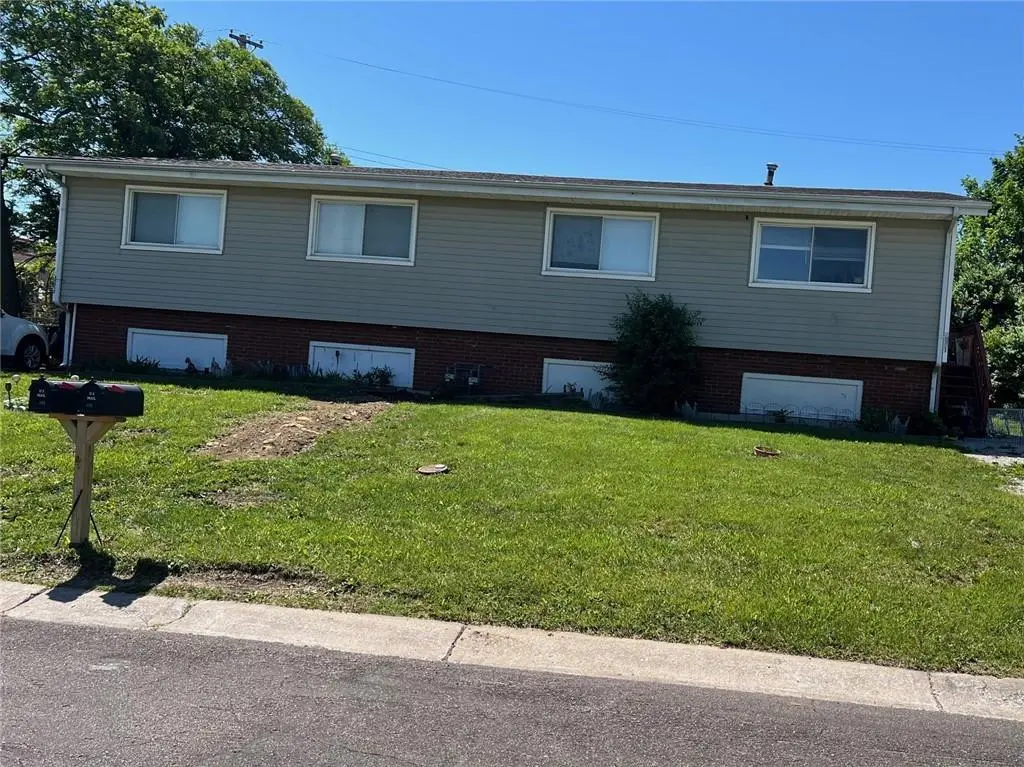
5701 E 139 Ter · Grandview, MO
Flood risk 1/10 · Minimal
- FEMA flood zone
- X (unshaded)
- Chance of flooding over 30 yrs
- 0.0%
- Est. flood insurance / yr
- $473 – $860
Fire risk 3/10 · Minor
- Est. fire insurance / yr
- $1,054 – $1,958
Heat risk 4/10 · Minor
- Hot days now (above 107°F)
- 7 days/yr
- Hot days in 30 yrs
- 17 days/yr
Wind risk 2/10 · Minimal
- Chance of severe wind over 30 yrs
- —
Air-quality risk 3/10 · Minor
- Unhealthy air days now
- 3 days/yr
- Unhealthy air days in 30 yrs
- 3 days/yr
Risk factors via First Street. Map © Google.
Why this score? — see what drove the B- grade
The composite is a weighted blend of 9 inputs, each scored 0–100. Each bar is that input's sub-score; the figure is the points it added to the 100-point composite (weight × sub-score).
- Cash flow +24.8/30.0
- ARV discount +15.0/15.0
- DSCR +8.0/10.0
- 1% rule +6.2/10.0
- Rent growth +4.0/5.0
- Livability +3.1/5.0
- Condition / age +2.5/5.0
- Schools +2.1/10.0
- Appreciation +0.0/10.0
$199,000
🖨 Deal sheet 📄 Offer letter ✓ Due diligence
Multi-family units
County records classify this as Multi-Family (2-4 Unit). Listing-text estimate: 2 units. confirmed
Listing remarks MLS
Great Investment property, well maintained for 16 yrs. Maintenance free exterior makes this one attractive. Live on one side or rent both sides. Conveniently located to I49. Quiet and on a dead end street. Green space across the street owned by city of Grandview.
Key facts
- 8,180 sq ft lot
- Built 1976
- Listed 11 days
Property features AI
Finance
- Other: Zoning: R
- Financial info: Property produces gross income of $15,600; Operating expenses include maintenance, insurance, and real estate taxes
Exterior
- Parking: Off-street parking
- Utilities: Public water; Public sewer; Separate electric meters; Individual heat and air; Individual water heaters
- Home design: Duplex (residential income); Single-story
- Construction: Composition roof; Other construction materials; Approximately 41–50 years old
- Exterior features: Deck; Private entrances; Not in a flood plain
Interior
- Kitchen: Dishwasher; Garbage disposal; Range/oven; Refrigerator
- Bedrooms: Two 2-bedroom units
- Bathrooms: Each unit has 1 bathroom
- Heating & cooling: Forced air heating; Electric cooling; Individual heating and air utilities (separate systems)
- Interior features: Private entrances; Storm doors; Deck
- Laundry & utility: Laundry in basement; Individual water heaters
Neighborhood map
What this means for you Summary
Snapshot
- This is a 2 × 2-bed/1.0-bath units multifamily listed at $199k.
Deal economics
- At list price, monthly cash flow is $419 ($5k/yr) — positive. Per door: $210/mo.
- The deal already cash-flows at list — no discount required.
- Meets the 1% rule at list price ($2k rent vs $199k).
- Cap rate 8.8% vs local median 5.0% in Grandview — top-decile yield for the area; either an underpriced asset or a hidden risk that comps aren't pricing in. Stress-test before assuming the spread holds.
Location & tenants
- Location reads 61/100 on livability (#454 in MO) — a middle-class / working-renter tenant base. Strengths: cost of living A+, housing A+; Watch: employment D, crime F, amenities F.
- Grandview C-4 (suburban): math 17% / reading 32% proficiency, ranked #284 of 324 in MO (top 88%) — low school quality limits family demand, transient renter base, plan for 1-2y turnover; 65% free/reduced lunch — lower-income household profile, screen leases tightly.
- Zoned schools: Grandview Sr. High (math 15% / reading 41%, grade F, #414 of 521 statewide, top 80%, 1,122 students, 62% FRL) — zoned schools at 62% FRL track the district average.
- Market conditions: Rents rising fast (+6.1%/yr); 116 active listings in the ZIP; 18 comparable units currently listed for rent nearby; rentals at typical pace (median 21d on market — plan ~3-4 weeks tenant-placement turnaround); 4,002 units permitted in Jackson County in 2024 (2,271 in 5+ unit buildings).
- At $2,226/mo this rent would consume 50% of the median local household income ($53k/yr) (locally 1449% of renters already pay >50% of income on rent) — very limited rent-growth headroom before tenants either downsize or default.
Forward outlook
- Local home prices are declining (-3.0%/yr); year-one equity from $1k of loan paydown is wiped out by about $6k of value loss. Plan a longer hold.
- Jackson County population projected at +4% by 2050 — modest demand growth; plan on rents tracking national, not racing it.
- At projected returns (-3.0% appreciation + 6.1% rent growth), your $56k cash investment doubles in ~9 years — after that, you're playing with house money.
Negotiation context
- Only 11 days on market — expect competitive offers; lowballing is unlikely to land.
- 4 sale attempts since 23y ago with the ask held roughly flat each time — persistent listings suggest the price (not the market) is what's stuck; bring a comps-based counter.
Questions for the listing agent
- Can we see the unit-by-unit rent roll, current vacancy, and any below-market leases? What's the average tenancy length?
- What capital expenditures (roof, boiler, parking lot, exteriors) have been made in the last 5 years, and what's planned in the next 2?
- Built in 1976 — when were the roof, HVAC, electrical panel, plumbing, and water heater last replaced?
- Is there a deadline driving the sale (1031 exchange, divorce, estate, relocation)? That informs how much negotiation room exists.
- Schools are D-rated, which usually means shorter tenancies and higher turnover. Who's the typical renter profile here, and what's been the actual vacancy rate?
- Crime grade is F in this area — have there been break-ins, vandalism, or insurance claims at this property in the last 3 years? What carrier currently insures it and at what premium?
- What's the average days-on-market for RENTAL listings here right now (not sales)? A rising rental-DOM trend means longer vacancies and softer asking-rent achievability than the comps imply.
- What's the recent tenant-quality profile in this submarket — average credit score on applications, eviction rate, late-payment / NSF rate, and stable-employment percentage? A property-management company in the area should have these aggregated.
- How much new apartment / multifamily construction is in the pipeline within 1–3 miles? Heavy new supply (>2% of stock underway) typically softens rents 12–24 months out; light construction supports rent growth.
Investment metrics
- 1% rule
- 1.12% ✓
- Cap rate
- 8.82%
- Cash-on-cash
- 9.03%
- DSCR
- 1.40
- GRM
- 7.4
CMA / ARV
- ARV (median comp)
- $242,430
- List price
- $199,000
- Delta
- -17.91%
- Verdict
- UNDERPRICED
- Comps
- 8 within 1.0 mi
Projected returns pro-forma
-3.0% appreciation · 6.1% rent growth · sell at horizon
- IRR
- 0.7%
- Equity multiple
- 1.03×
- Total profit
- $1,622
- Equity at exit
- $29,672
- IRR
- 13.2%
- Equity multiple
- 2.21×
- Total profit
- $67,146
- Equity at exit
- $17,206
Cash invested: $55,720 (down + closing). Projections, not guarantees.
Landlord ↔ Tenant lean methodology
- Overall (STATE)
- 81 Strongly Landlord-Friendly
- State Missouri
- 81 Strongly Landlord-Friendly · R+10
- County
- — inherits STATE
- City
- — inherits STATE
ZIP-level market 64030
- Home prices YoY
- -30.7%
- Rents YoY
- 6.1%
- Active inventory
- 116
- Price-to-rent
- 14.9×
Monthly cashflow live
- Estimated rent
- $2,226 high interval (Pro) →
- Mortgage (P&I)
- −$1,044
- Tax from tax record
- −$213 /mo · $2,554/yr
- Insurance
- −$83
- HOA
- −$0
- Vacancy / Maint / Mgmt
- −$467
- Net cashflow
- $419
Break-even live
2-unit breakdown (identical units grouped — click to expand)
| Units | Beds | Baths | Est. rent |
|---|---|---|---|
| 2× units | 2 | 1 | $2,226 |
| #1 | 2 | 1 | $1,113 |
| #2 | 2 | 1 | $1,113 |
| Total (2 units) | $2,226 | ||
UW: 25.0% down · 7.5% · 30yr · 1.5% tax · 5.0% vac · 8.0% maint · 8.0% mgmt
Financing live
Cash to close
- Down payment
- $49,750
- Closing costs
- $5,970
- Reserves months
- —
- Total cash needed
- —
Loan-product check · same deal, 3 products live
Conventional
25% down · 7.5% · 30yr
- Down + closing
- —
- Monthly P&I
- —
- Monthly cashflow
- —
- DSCR
- —
- Eligible?
- —
Personal DTI + credit; lowest rate.
DSCR
20% down · 8.5% · 30yr
- Down + closing
- —
- Monthly P&I
- —
- Monthly cashflow
- —
- DSCR
- —
- Eligible?
- —
No personal income docs; deal must DSCR.
Hard money
10% down · 12.0% · 12mo
- Down + closing
- —
- Monthly P&I
- —
- Monthly cashflow
- —
- DSCR
- —
- Eligible?
- —
Short-term bridge; refi at stabilization.
Rent comps 18 comps
| Address | Beds | Baths | Sqft | Rent | $/sqft | DOM | Units | Dist |
|---|---|---|---|---|---|---|---|---|
| 14011 Dunbar Ct Grandview, MO | 3.0 | 3.0 | 1750 | $1,725 | $0.99 | 4d | 1 | 0.17mi |
| 13915 Grandboro Ln Grandview, MO | 4.0 | 2.5 | 1515 | $1,895 | $1.25 | 2d | 1 | 0.34mi |
| 13915 Grandboro Ln Grandview, MO | 4.0 | 2.5 | 1515 | $1,895 | $1.25 | 1d | 1 | 0.34mi |
| 13701 11th Ter Grandview, MO | 4.0 | 2.0 | 1900 | $1,940 | $1.02 | 43d | 1 | 0.44mi |
| 5940 E 136th St Grandview, MO | 4.0 | 2.0 | 1897 | $1,575 | $0.83 | 23d | 1 | 0.53mi |
| 6501 E 137th St Grandview, MO | 4.0 | 3.0 | 1469 | $2,135 | $1.45 | 43d | 1 | 0.60mi |
| 13718 Cypress Ave Grandview, MO | 3.0 | 1.0 | 1050 | $1,445 | $1.38 | 7d | 1 | 0.79mi |
| 7002 E 140th Ter Grandview, MO | 3.0 | 2.0 | 2095 | $2,321 | $1.11 | 4d | 1 | 0.83mi |
| 6003 E 133rd St Grandview, MO | 4.0 | 2.5 | 1560 | $1,990 | $1.28 | 12d | 1 | 0.87mi |
| 14411 Craig Ave Grandview, MO | 3.0 | 2.5 | 1284 | $1,891 | $1.47 | 23d | 1 | 0.88mi |
| 13206 15th St Grandview, MO | 3.0 | 2.0 | 1204 | $1,735 | $1.44 | 21d | 1 | 0.92mi |
| 14412 Wilshire Cir Grandview, MO | 3.0 | 3.0 | 2040 | $2,205 | $1.08 | 12d | 1 | 0.97mi |
| 14719 Bellaire Ave Grandview, MO | 4.0 | 2.0 | 1440 | $1,750 | $1.22 | 43d | 1 | 1.05mi |
| 14700 Pine View Dr Grandview, MO | 3.0 | 1.5 | 1168 | $1,900 | $1.63 | 43d | 1 | 1.08mi |
| 6505 Yorkshire Ct Grandview, MO | 3.0 | 2.0 | 1697 | $2,090 | $1.23 | 4d | 1 | 1.10mi |
| 6108 E 149th St Grandview, MO | 4.0 | 1.5 | 1200 | $1,465 | $1.22 | 43d | 1 | 1.21mi |
| 6205 E 149th St Grandview, MO | 4.0 | 1.0 | 1200 | $1,495 | $1.25 | 21d | 1 | 1.22mi |
| 7502 E 132nd Ter Grandview, MO | 3.0 | 2.0 | 1754 | $2,135 | $1.22 | 23d | 1 | 1.46mi |
Listing history 15 events
-
2026-05-14$199,000 Active 796-char remark
-
2026-05-08historical $199,000 796-char remark
-
2022-05-06soldstatus Closed 266-char remark
Show marketing remark (266 chars)
Great Investment property, well maintained for 16 yrs. Maintenance free exterior makes this one attractive. Live on one side or rent both sides. Conveniently located to I49. Quiet and on a dead end street. Green space across the street owned by city of Grandview.
-
2022-05-06soldstatus
Show marketing remark (266 chars)
Great Investment property, well maintained for 16 yrs. Maintenance free exterior makes this one attractive. Live on one side or rent both sides. Conveniently located to I49. Quiet and on a dead end street. Green space across the street owned by city of Grandview.
-
2022-04-20status Pending 266-char remark
Show marketing remark (266 chars)
Great Investment property, well maintained for 16 yrs. Maintenance free exterior makes this one attractive. Live on one side or rent both sides. Conveniently located to I49. Quiet and on a dead end street. Green space across the street owned by city of Grandview.
-
2022-04-18historical Active Under Contract 266-char remark
Show marketing remark (266 chars)
Great Investment property, well maintained for 16 yrs. Maintenance free exterior makes this one attractive. Live on one side or rent both sides. Conveniently located to I49. Quiet and on a dead end street. Green space across the street owned by city of Grandview.
-
2022-04-11$170,000 Active 266-char remark
Show marketing remark (266 chars)
Great Investment property, well maintained for 16 yrs. Maintenance free exterior makes this one attractive. Live on one side or rent both sides. Conveniently located to I49. Quiet and on a dead end street. Green space across the street owned by city of Grandview.
-
2006-06-13soldstatus
-
2006-06-08soldstatus
Show marketing remark (136 chars)
Great investment 100% occupied duplex. Next door to new Red X in Grandview. Maintenance free siding, thermal windows, and w/ d hook ups.
-
2006-03-06$120,000
Show marketing remark (136 chars)
Great investment 100% occupied duplex. Next door to new Red X in Grandview. Maintenance free siding, thermal windows, and w/ d hook ups.
-
2003-04-07soldstatus
-
2003-03-26soldstatus
-
2003-02-19$119,900
-
2000-04-05soldstatus
-
1993-01-14soldstatus
ⓘ Source: listings_history table (triggers on properties + properties_extension) + one-shot
backfill from property_details.listing_events for pre-trigger history.
Tax reassessment forecast MO · Resets to sale price
- Current annual tax
- $2,554 · $213/mo
- Projected year-2 tax
- $2,554 · $213/mo
- Expected delta
- $0/yr ($0/mo · 0.0%)
ⓘ Screening estimate from a state-policy table — verify with the county assessor before closing.
Climate risk First Street
- Flood 1/10 Low FEMA zone X (unshaded) · 0% chance over 30 yrs
- Wildfire 3/10 Moderate
- Heat 4/10 Moderate 7 d/yr ≥107°F today · 17 d/yr by 30 yrs out
- Wind 2/10 Low
- Air quality 3/10 Moderate 3 unhealthy d/yr today · 3 by 30 yrs out
Nearby sold comps map
Loading sold comps map…
Walkable amenities ~0.75 mi
Loading nearby amenities…
Taxation est. · year 1
- Rental income
- $26,712
- − Mortgage interest
- −$11,147
- − Property taxes
- −$2,554
- − Insurance
- −$995
- − Repairs & maintenance
- −$2,137
- − Management
- −$2,137
- − Depreciation
- −$5,789
- Taxable income
- $1,953
- Est. tax owed @ 24.0%
- −$469
- After-tax cash flow
- $4,562/yr
For passive investors: Depreciation is non-cash, so a rental often shows a tax loss while cash-flowing — sheltering income. Rental losses are passive: they offset passive income freely, and up to $25,000/yr can offset ordinary (W-2) income if you actively participate and your MAGI is under $100k (phasing out to $0 by $150k); unused losses carry forward. On sale, claimed depreciation is recaptured at up to 25%, and gains may owe capital-gains tax (a 1031 exchange can defer both). Figures are a year-1 estimate at your 24.0% rate — not tax advice; consult a CPA.
Schools (NCES district)
- District
- Grandview C-4
- NCES district ID
- 2913140
- Math proficiency
- 17% ▼ -12.00%
- Reading proficiency
- 32% ▼ -3.00%
- Median HH income
- $48,934
- Composite
- 21.49/100
- National rank
- #8326
- State rank
- #284 of 324 in MO
Livability — Grandview
- Score
- 61/100
- State rank
- #454
- US rank
- #18350
Category grades
Schools grade is shown separately in the Schools card above.
Census & demographics
- Census place
- Grandview, MO
- County
- Jackson County · 687,798 people
- City population
- 26,422
- Metro
- Kansas City, MO-KS
- Population (ZIP)
- 26,422
- Household income
- $53,216
- Rent vs Own
- Severe rent burden
- 1449.0
Population outlook (Jackson County) Hauer SSP2
- Today (2025)
- 719,589 people
- By 2030
- 731,456 · +1.6%
- By 2040
- 746,689 · +3.8%
- By 2050
- 749,289 · +4.1%
- By 2075
- 736,227 · +2.3%
- By 2100
- 668,210 · -7.1%
Race, ethnicity, and origin ACS 2023
- Neighborhood character
- Diverse neighborhood (Simpson 0.68)
- Race & ethnicity
- White 44% Black 33% Hispanic / Latino 14% Two or more races 7% Asian 3%
- Hispanic origin (detail)
- Mexican 8%
- Common ancestry
- Lithuanian 1% Romanian 1% Slovak 1%
- Foreign-born
- 9% · Canada, South Korea
- Languages at home
- 86% English-only · Spanish 11% Korean 1% Arabic 1%
Political lean MEDSL · Jackson
- 2024 margin
- D (+19.3) · D 58.9% · R 39.5% · Other 1.6%
- 2008→2024 swing
- -6.1pp toward R · 2008: 25.4pp · 2024: 19.3pp
- All cycles
- 2024: D+19.3 2020: D+22.0 2016: D+16.6 2012: D+19.0 2008: D+25.4
Not yet ingested
- Civics
- —
Market trends
- HPI YoY
- ▼ -142.24%
- Current HPI
- 321.6905
- Rent YoY
- ▲ 6.10%
- Metro
- Kansas City, MO-KS
- State GDP YoY
- ▲ 1.84%
- F500 in state
- 20
Industry mix (Fortune 500 HQ in MO)
| Industry | F500 HQs | Revenue |
|---|---|---|
| Healthcare | 1 | $163B |
|
||
| Insurance | 1 | $21B |
|
||
| Industrial Technology | 1 | $17B |
|
||
| Retail | 1 | $16B |
|
||
| Industrial Distribution | 1 | $10B |
|
||
| Utilities | 1 | $9B |
|
||
Price history
+66.0% since first listed16 events — show timeline
- 2026-05-25 Pending — Heartland MLS as Distributed by MLS Grid
- 2026-05-14 Listed $199,000 Heartland MLS as Distributed by MLS Grid
- 2026-05-08 Coming Soon $199,000 Heartland MLS as Distributed by MLS Grid
- 2022-05-06 Sold (Public Records) — Public Records
- 2022-05-06 Sold (MLS) — Heartland MLS as Distributed by MLS Grid
- 2022-04-20 Pending — Heartland MLS as Distributed by MLS Grid
- 2022-04-18 Contingent — Heartland MLS as Distributed by MLS Grid
- 2022-04-11 Listed $170,000 Heartland MLS as Distributed by MLS Grid
- 2006-06-13 Sold (Public Records) — Public Records
- 2006-06-08 Sold (MLS) — Heartland MLS as Distributed by MLS Grid
- 2006-03-06 Listed $120,000 Heartland MLS as Distributed by MLS Grid
- 2003-04-07 Sold (Public Records) — Public Records
- 2003-03-26 Sold (MLS) — Heartland MLS as Distributed by MLS Grid
- 2003-02-19 Listed $119,900 Heartland MLS as Distributed by MLS Grid
- 2000-04-05 Sold (Public Records) — Public Records
- 1993-01-14 Sold (Public Records) — Public Records
Property tax history
+4.7%/yrLatest (2025): $2,554 · +5.7% YoY. Source: county tax records.
Cash-flow waterfall
monthlySold comps — $/sqft
last 12 mo · ≤1 miLoading sold comps…