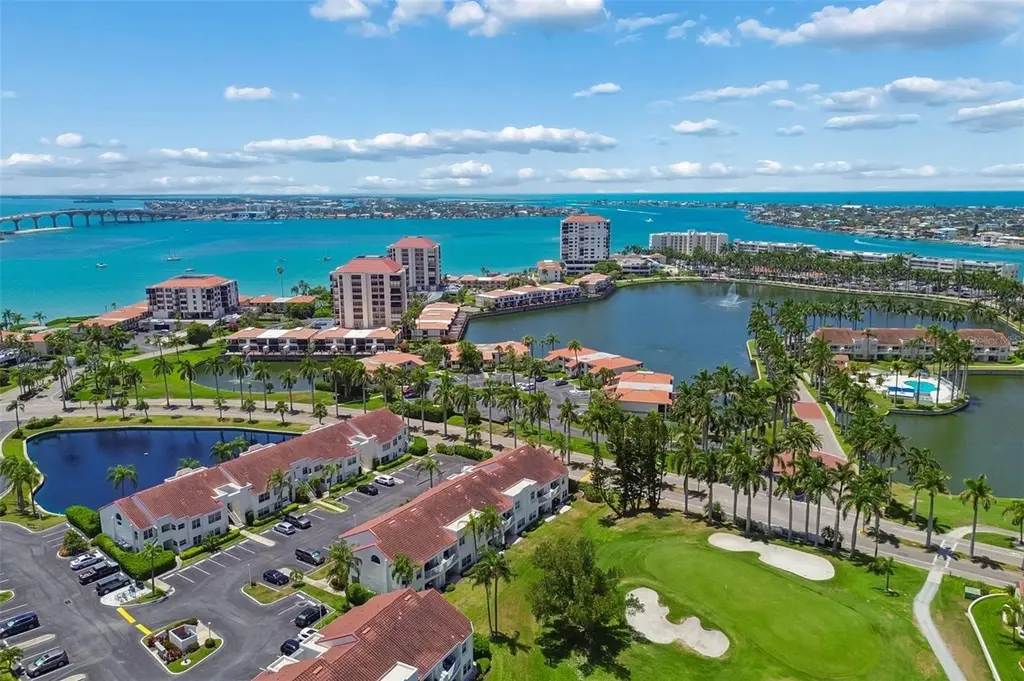
6085 Bahia Del Mar Blvd #106 · St. Petersburg, FL
Flood risk 6/10 · Moderate
- FEMA flood zone
- X (shaded)
- Chance of flooding over 30 yrs
- 0.69%
- Est. flood insurance / yr
- $507 – $1,088
Fire risk 1/10 · Minimal
- Est. fire insurance / yr
- $947 – $1,759
Heat risk 10/10 · Severe
- Hot days now (above 106°F)
- 7 days/yr
- Hot days in 30 yrs
- 27 days/yr
Wind risk 10/10 · Severe
- Chance of severe wind over 30 yrs
- 99.0%
Air-quality risk 3/10 · Minor
- Unhealthy air days now
- 3 days/yr
- Unhealthy air days in 30 yrs
- 3 days/yr
Risk factors via First Street. Map © Google.
Why this score? — see what drove the D grade
The composite is a weighted blend of 9 inputs, each scored 0–100. Each bar is that input's sub-score; the figure is the points it added to the 100-point composite (weight × sub-score).
- Cash flow +8.3/30.0
- ARV discount +7.5/15.0
- 1% rule +5.4/10.0
- Appreciation +4.9/10.0
- Schools +4.3/10.0
- Rent growth +2.5/5.0
- Livability +2.5/5.0
- Condition / age +2.5/5.0
- DSCR +2.2/10.0
$409,000
🖨 Deal sheet 📄 Offer letter ✓ Due diligence
Listing remarks
Welcome to effortless island living in the highly sought-after waterfront and golf community of Isla Del Sol. This beautifully maintained ground-floor corner condo offers the perfect blend of resort-style comfort, investment potential, and everyday convenience—all just minutes from the sugar-sand beaches of St. Pete Beach and Pass-a-Grille. Enjoy convenient first-floor access and a fully furnished TURNKEY residence—just bring your suitcase (and maybe your flip-flops) and start living the island lifestyle. Whether you're searching for a full-time residence, seasonal retreat, or income-producing property, this move-in ready condo is an exceptional opportunity in one of St. Petersb
Key facts
- Natural light
- First floor access
- Move in ready
Tags
Property features AI
Finance
- Financial info: Lease restrictions apply
- HOA & community: HOA managed by Resource Management; Monthly condo fee of $783; total annual fees $9,396; Association approval required; Association fees cover pool, common area taxes, insurance, maintenance (structure and grounds), recreational facilities, sewer, trash, water, and escrow reserves; Community features include clubhouse, pool, deed restrictions, buyer approval required; Pets allowed with size/weight limit (max ~20 lbs)
Exterior
- Utilities: Public water; Public sewer; Electricity connected; Cable available; Broadband/high-speed internet available; Water connected; Sewer connected
- Home design: Residential condominium; One-level unit (floor 1); South-facing
- Construction: Stucco and frame construction; Tile roof; Slab foundation; Built as part of building 6085-1
- Exterior features: Covered rear porch; Outdoor lighting; Rain gutters; Sliding doors; Gunite in-ground pool; Mature landscaping; Corner lot; Paved road access
Interior
- Kitchen: Dishwasher; Microwave; Range; Refrigerator
- Bedrooms: 2 bedrooms
- Flooring: Ceramic tile
- Bathrooms: 2 full bathrooms
- Heating & cooling: Central heating; Central air conditioning
- Interior features: Ceiling fans; Crown molding; Eat-in kitchen; Living room/dining room combo; Open floorplan; Walk-in closets
- Laundry & utility: Inside laundry; Laundry closet
Neighborhood map
What this means for you Summary
Snapshot
- This is a 2-bed/2.0-bath condo listed at $409k.
Deal economics
- At list price, monthly cash flow is $-376 ($-5k/yr) — negative.
- To cash-flow at today's rent, offer at most $343k (16.3% below list).
- Meets the 1% rule at list price ($4k rent vs $409k).
- Recommended offer: $343k (16.3% below list) — sets the bar for cash-flow.
- Cap rate 5.2% vs local median 2.6% in St. Petersburg — top-decile yield for the area; either an underpriced asset or a hidden risk that comps aren't pricing in. Stress-test before assuming the spread holds.
Location & tenants
- Location reads: area grade D — affects rentability + tenant quality, not the cash-flow math above.
- Pinellas (suburban): math 51% / reading 51% proficiency, ranked #31 of 73 in FL (top 42%) — acceptable for families but not a draw, mixed tenant base, ~2y average lease.
- Zoned schools: Gulfport Montessori Elementary School (math 35% / reading 33%, grade F, #1,744 of 2,144 statewide, top 82%, 435 students, 86% FRL); Lakewood High School (math 27% / reading 44%, grade F, #367 of 667 statewide, top 57%, 915 students, 59% FRL) — zoned schools average 72% FRL vs 48% district-wide (24 pts higher); higher-poverty schools than district average — tighter screening recommended.
- Zoned-school proficiency averages 35% at this address vs 51% district-wide (-16 pts) — the specific schools serving this property underperform the Pinellas average; the district grade overstates school quality for this exact location.
- Market conditions: 282 active listings in the ZIP; 40 comparable units currently listed for rent nearby; rentals at typical pace (median 24d on market — plan ~3-4 weeks tenant-placement turnaround); solid renter incomes; 2,676 units permitted in Pinellas County in 2024 (1,422 in 5+ unit buildings).
- At $4,266/mo this rent would consume 50% of the median local household income ($103k/yr) (locally 106% of renters already pay >50% of income on rent) — very limited rent-growth headroom before tenants either downsize or default.
Forward outlook
- In year one you build about $2k of equity ($3k loan paydown + $-634 appreciation (-0.1% local appreciation)).
- Pinellas County population projected at +14% by 2050 — modest demand growth; plan on rents tracking national, not racing it.
- By year 9, paydown + projected appreciation supports a ~$31k cash-out refi (75% LTV) — recoverable capital for the next deal without selling this one.
Negotiation context
- It's been on market 33 days — a 3% lower offer ($397k) is reasonable based on typical stale-listing flexibility.
- 6 sale attempts since 15y ago with the ask held roughly flat each time — persistent listings suggest the price (not the market) is what's stuck; bring a comps-based counter.
Risks & watch-outs
- Climate carrying-cost: major flood risk; severe wind risk, 99% chance of damaging wind over 30y; extreme-heat days projected 7→27/yr by 2055 (HVAC capex compounding) — expect insurance premiums to compound above CPI over the hold.
Questions for the listing agent
- What do current leases actually rent for vs. the listed asking? Can we see a recent rent roll and the last 12 months of T-12 income?
- It's been on market 33 days. Have you received any prior offers? Is the seller open to a 16% concession, seller financing, or rate buy-down credit?
- What does the HOA fee cover, when was the last increase, and are there any pending special assessments or reserve-fund shortfalls?
- Any open or pending special assessments — roof, HVAC, plumbing, elevator, façade? What's the per-unit balance and payoff schedule, and is the seller paying it off at close or rolling it to the buyer?
- Is there a deadline driving the sale (1031 exchange, divorce, estate, relocation)? That informs how much negotiation room exists.
- The area grade is low — what's the realistic commute time and amenity access for the typical tenant pool here? Any planned neighborhood developments (good or bad) we should know about?
- What's the average days-on-market for RENTAL listings here right now (not sales)? A rising rental-DOM trend means longer vacancies and softer asking-rent achievability than the comps imply.
- What's the recent tenant-quality profile in this submarket — average credit score on applications, eviction rate, late-payment / NSF rate, and stable-employment percentage? A property-management company in the area should have these aggregated.
- How much new apartment / multifamily construction is in the pipeline within 1–3 miles? Heavy new supply (>2% of stock underway) typically softens rents 12–24 months out; light construction supports rent growth.
Investment metrics
- 1% rule
- 1.04% ✓
- Cap rate
- 5.19%
- Cash-on-cash
- -3.94%
- DSCR
- 0.82
- GRM
- 8.0
CMA / ARV
No comps found within radius.
Projected returns pro-forma
-0.15% appreciation · 3.0% rent growth · sell at horizon
- IRR
- -7.2%
- Equity multiple
- 0.67×
- Total profit
- $-38,272
- Equity at exit
- $115,603
- IRR
- -0.9%
- Equity multiple
- 0.90×
- Total profit
- $-11,305
- Equity at exit
- $136,465
Cash invested: $114,520 (down + closing). Projections, not guarantees.
Landlord ↔ Tenant lean methodology
- Overall (STATE)
- 87 Strongly Landlord-Friendly
- State Florida
- 87 Strongly Landlord-Friendly · R+3
- County
- — inherits STATE
- City
- — inherits STATE
ZIP-level market 33715
- Home prices YoY
- -0.1%
- Active inventory
- 282
- Price-to-rent
- 8.0×
Monthly cashflow live
- Estimated rent
- $4,266 high interval (Pro) →
- Mortgage (P&I)
- −$2,145
- Tax from tax record
- −$648 /mo · $7,776/yr
- Insurance
- −$170
- HOA
- −$783
- Vacancy / Maint / Mgmt
- −$896
- Net cashflow
- $-376
Break-even live
UW: 25.0% down · 7.5% · 30yr · 1.5% tax · 5.0% vac · 8.0% maint · 8.0% mgmt
Financing live
Cash to close
- Down payment
- $102,250
- Closing costs
- $12,270
- Reserves months
- —
- Total cash needed
- —
Loan-product check · same deal, 3 products live
Conventional
25% down · 7.5% · 30yr
- Down + closing
- —
- Monthly P&I
- —
- Monthly cashflow
- —
- DSCR
- —
- Eligible?
- —
Personal DTI + credit; lowest rate.
DSCR
20% down · 8.5% · 30yr
- Down + closing
- —
- Monthly P&I
- —
- Monthly cashflow
- —
- DSCR
- —
- Eligible?
- —
No personal income docs; deal must DSCR.
Hard money
10% down · 12.0% · 12mo
- Down + closing
- —
- Monthly P&I
- —
- Monthly cashflow
- —
- DSCR
- —
- Eligible?
- —
Short-term bridge; refi at stabilization.
Rent comps 40 comps
| Address | Beds | Baths | Sqft | Rent | $/sqft | DOM | Units | Dist |
|---|---|---|---|---|---|---|---|---|
| 6273 Bahia del Mar Blvd #216 Saint Petersburg, FL | 2.0 | 2.0 | 915 | $5,700 | $6.23 | 24d | 1 | 0.04mi |
| 6281 Bahia del Mar Blvd #208 Saint Petersburg, FL | 2.0 | 2.0 | 890 | $2,100 | $2.36 | 24d | 1 | 0.04mi |
| 6073 Bahia del Mar Blvd #129 Saint Petersburg, FL | 2.0 | 2.0 | 1145 | $2,200 | $1.92 | 24d | 1 | 0.06mi |
| 6077 Bahia del Mar Blvd St Petersburg, FL | 2.0 | 2.0 | 1107 | $2,198 | $1.98 | 12d | 2 | 0.06mi |
| 6141 Bahia Del Mar Blvd S Unit 1546330P St. Petersburg, FL | 2.0 | 2.0 | 1140 | $2,631 | $2.31 | 7d | 1 | 0.07mi |
| 6141 Bahia del Mar Blvd #229 Saint Petersburg, FL | 2.0 | 2.0 | 1145 | $6,090 | $5.32 | 24d | 1 | 0.07mi |
| 6107 Mirada Cir Saint Petersburg, FL | 3.0 | 2.5 | 1320 | $3,200 | $2.42 | 4d | 1 | 0.08mi |
| 6059 Bahia del Mar Blvd #241 Saint Petersburg, FL | 2.0 | 2.0 | 1070 | $5,170 | $4.83 | 17d | 1 | 0.09mi |
| 6294 Bahia del Mar Cir St Petersburg, FL | 2.0 | 2.0 | 945 | $4,142 | $4.38 | 24d | 3 | 0.10mi |
| 6100 Bahia del Mar Cir #103 Saint Petersburg, FL | 2.0 | 2.5 | 1145 | $5,580 | $4.87 | 4d | 1 | 0.11mi |
| 6151 Bahia del Mar Blvd St Petersburg, FL | 2.0 | 2.0 | 1107 | $4,540 | $4.10 | 24d | 3 | 0.11mi |
| 6100 Bahia del Mar Cir St Petersburg, FL | 2.0 | 2.0–2.5 | 1145 | $4,038 | $3.53 | 24d | 2 | 0.11mi |
| 6295 Bahia del Mar Cir St Petersburg, FL | 1.0–2.0 | 1.0–2.0 | 915 | $7,110 | $7.77 | 24d | 6 | 0.13mi |
| 6357 Bahia del Mar Blvd St Petersburg, FL | 1.0–2.0 | 1.5–2.0 | 915 | $7,000 | $7.65 | 24d | 2 | 0.14mi |
| 6191 Bahia del Mar Blvd #205 Saint Petersburg, FL | 2.0 | 2.0 | 1070 | $3,400 | $3.18 | 24d | 1 | 0.18mi |
| 5901 Bahia del Mar Cir #124 Saint Petersburg, FL | 2.0 | 2.0 | 1150 | $2,500 | $2.17 | 24d | 1 | 0.18mi |
| 5901 Bahia del Mar Cir #518 Saint Petersburg, FL | 2.0 | 2.0 | 1080 | $3,000 | $2.78 | 24d | 1 | 0.18mi |
| 5901 Bahia del Mar Cir #122 Saint Petersburg, FL | 2.0 | 2.0 | 1080 | $3,500 | $3.24 | 24d | 1 | 0.18mi |
| 5901 Bahia del Mar Cir #223 Saint Petersburg, FL | 2.0 | 2.0 | 1080 | $7,860 | $7.28 | 24d | 1 | 0.18mi |
| 5901 Bahia del Mar Cir #422 Saint Petersburg, FL | 2.0 | 2.0 | 1080 | $7,860 | $7.28 | 24d | 1 | 0.18mi |
| 6291 Bahia del Mar Cir St Petersburg, FL | 2.0 | 2.0 | 1222 | $3,830 | $3.13 | 24d | 2 | 0.19mi |
| 6361 Bahia del Mar Blvd St Petersburg, FL | 1.0–2.0 | 1.5–2.0 | 835 | $5,800 | $6.95 | 3d | 3 | 0.19mi |
| 6000 Bahia del Mar Cir St Petersburg, FL | 2.0 | 2.0 | 1107 | $4,095 | $3.70 | 24d | 3 | 0.19mi |
| 6000 Bahia del Mar Cir St Petersburg, FL | 2.0 | 2.0 | 1107 | $4,195 | $3.79 | 7d | 2 | 0.19mi |
| 6061 Bahia del Mar Cir #347 St Petersburg, FL | 2.0 | 2.0 | 1080 | $2,300 | $2.13 | 4d | 1 | 0.21mi |
| 6061 Bahia del Mar Cir #448 St Petersburg, FL | 2.0 | 2.0 | 1150 | $7,530 | $6.55 | 4d | 1 | 0.21mi |
| 6061 Bahia del Mar Cir #146 Saint Petersburg, FL | 2.0 | 2.0 | 1080 | $2,600 | $2.41 | 24d | 1 | 0.21mi |
| 6081 Bahia del Mar Cir #456 Saint Petersburg, FL | 2.0 | 2.0 | 1150 | $3,000 | $2.61 | 24d | 1 | 0.21mi |
| 6287 Bahia del Mar Cir #312 Saint Petersburg, FL | 2.0 | 2.0 | 890 | $3,200 | $3.60 | 4d | 1 | 0.22mi |
| 6287 Bahia del Mar Cir #311 St Petersburg, FL | 2.0 | 2.0 | 890 | $2,100 | $2.36 | 4d | 1 | 0.22mi |
| 5900 Bahia del Mar Cir #138 St Petersburg, FL | 2.0 | 2.0 | 1075 | $5,070 | $4.72 | 4d | 1 | 0.24mi |
| 6001 Bahia del Mar Cir #527 Saint Petersburg, FL | 2.0 | 2.0 | 1080 | $7,860 | $7.28 | 24d | 1 | 0.24mi |
| 6083 Bahia del Mar Cir #460 St Petersburg, FL | 2.0 | 2.0 | 1215 | $7,460 | $6.14 | 4d | 1 | 0.24mi |
| 6083 Bahia del Mar Cir #159 Saint Petersburg, FL | 2.0 | 2.0 | 1135 | $8,310 | $7.32 | 24d | 1 | 0.24mi |
| 6365 Bahia del Mar Blvd St Petersburg, FL | 1.0–2.0 | 1.5–2.0 | 827 | $2,500 | $3.02 | 17d | 3 | 0.24mi |
| 5801 Bahia del Mar Cir #512 Saint Petersburg, FL | 2.0 | 2.0 | 1075 | $7,510 | $6.99 | 24d | 1 | 0.27mi |
| 6085 Bahia del Mar Cir #468 Saint Petersburg, FL | 2.0 | 2.0 | 1215 | $9,398 | $7.73 | 24d | 1 | 0.28mi |
| 6085 Bahia del Mar Cir #467 Saint Petersburg, FL | 2.0 | 2.0 | 1135 | $6,960 | $6.13 | 24d | 1 | 0.28mi |
| 6085 Bahia del Mar Cir #272 Saint Petersburg, FL | 2.0 | 2.0 | 1170 | $3,500 | $2.99 | 23d | 1 | 0.28mi |
| 6093 Bahia del Mar Cir #277 Saint Petersburg, FL | 2.0 | 2.0 | 1215 | $3,500 | $2.88 | 24d | 1 | 0.29mi |
HOA detail condo
- Monthly dues
- $783 · $9,396/yr
- Likely covers
- water
- Assessments
- None detected in remarks — confirm with the listing agent.
Listing history 43 events
-
2026-06-18price $409,000 Active 33 DOM
-
2026-06-18days on market $414,988 Active 33 DOM
-
2026-06-17days on market $414,988 Active 32 DOM
-
2026-06-16days on market $414,988 Active 31 DOM
-
2026-06-15days on market $414,988 Active 30 DOM
-
2026-06-13days on market $414,988 Active 28 DOM
-
2026-06-09days on market $414,988 Active 24 DOM
-
2026-06-08days on market $414,988 Active 23 DOM
-
2026-06-07days on market $414,988 Active 22 DOM
-
2026-06-04days on market $414,988 Active 19 DOM
-
2026-06-03days on market $414,988 Active 18 DOM
-
2026-06-02price $414,988 Active 16 DOM
-
2026-06-01days on market $419,988 Active 16 DOM
-
2026-05-31days on market $419,988 Active 15 DOM
-
2026-05-16$419,988 Active
-
2025-09-30historical
-
2025-07-24price $459,900
-
2025-05-06$479,900 Active
-
2025-01-11historical
-
2024-09-10price $479,900
-
2024-07-14$499,900 Active
-
2024-07-11historical
-
2024-06-11price $509,999
-
2024-06-11price $509,999
-
2024-06-05price $528,850
-
2024-06-05price $528,850
-
2024-05-29price $528,900
-
2024-05-29price $528,900
-
2024-05-23price $528,950
-
2024-05-23price $528,950
-
2024-04-25price $529,000
-
2024-04-25price $529,000
-
2023-12-11$535,000 Active
-
2022-08-31soldstatus $475,000
-
2022-08-30soldstatus $475,000 Closed
-
2022-07-12status Pending
-
2022-07-06$499,900 Active
-
2013-02-19soldstatus $160,000
-
2013-02-11soldstatus $160,000
-
2011-12-15$163,500
-
2001-07-25soldstatus $125,000
-
1991-02-07soldstatus $100,000
-
1988-08-05soldstatus $80,000
ⓘ Source: listings_history table (triggers on properties + properties_extension) + one-shot
backfill from property_details.listing_events for pre-trigger history.
Tax reassessment forecast FL · Resets to sale price
- Current annual tax
- $7,776 · $648/mo
- Projected year-2 tax
- $7,776 · $648/mo
- Expected delta
- $0/yr ($0/mo · 0.0%)
ⓘ Screening estimate from a state-policy table — verify with the county assessor before closing.
Climate risk First Street
- Flood 6/10 Major FEMA zone X (shaded) · 69% chance over 30 yrs
- Wildfire 1/10 Low
- Heat 10/10 Extreme 7 d/yr ≥106°F today · 27 d/yr by 30 yrs out
- Wind 10/10 Extreme 99% chance of damaging wind over 30 yrs
- Air quality 3/10 Moderate 3 unhealthy d/yr today · 3 by 30 yrs out
Nearby sold comps map
Loading sold comps map…
Walkable amenities ~0.75 mi
Loading nearby amenities…
Taxation est. · year 1
- Rental income
- $51,188
- − Mortgage interest
- −$22,910
- − Property taxes
- −$7,776
- − Insurance
- −$2,045
- − Repairs & maintenance
- −$4,095
- − Management
- −$4,095
- − HOA
- −$9,396
- − Depreciation
- −$11,898
- Taxable loss
- −$11,027
- Est. tax savings @ 24.0%
- +$2,646
- After-tax cash flow
- $-1,869/yr
For passive investors: Depreciation is non-cash, so a rental often shows a tax loss while cash-flowing — sheltering income. Rental losses are passive: they offset passive income freely, and up to $25,000/yr can offset ordinary (W-2) income if you actively participate and your MAGI is under $100k (phasing out to $0 by $150k); unused losses carry forward. On sale, claimed depreciation is recaptured at up to 25%, and gains may owe capital-gains tax (a 1031 exchange can defer both). Figures are a year-1 estimate at your 24.0% rate — not tax advice; consult a CPA.
Schools (NCES district)
- District
- Pinellas
- NCES district ID
- 1201560
- Math proficiency
- 51% ▼ -5.00%
- Reading proficiency
- 51% ▼ -3.00%
- Median HH income
- $46,270
- Composite
- 43.27/100
- National rank
- #3046
- State rank
- #31 of 73 in FL
Livability — St. Petersburg
No livability data for this city. (Only ~50 U.S. cities are tracked.)
Census & demographics
- Census place
- St. Petersburg, FL
- County
- Pinellas County · 939,478 people
- City population
- 249,151
- Metro
- Tampa-St. Petersburg-Clearwater, FL
- Population (ZIP)
- 8,032
- Household income
- $102,782
- Rent vs Own
- Severe rent burden
- 106.0
Population outlook (Pinellas County) Hauer SSP2
- Today (2025)
- 1,027,532 people
- By 2030
- 1,063,586 · +3.5%
- By 2040
- 1,125,020 · +9.5%
- By 2050
- 1,168,637 · +13.7%
- By 2075
- 1,265,188 · +23.1%
- By 2100
- 1,260,357 · +22.7%
Race, ethnicity, and origin ACS 2023
- Neighborhood character
- Predominantly White (89%)
- Race & ethnicity
- White 89% Two or more races 5% Hispanic / Latino 5% Asian 2%
- Hispanic origin (detail)
- Puerto Rican 2%
- Common ancestry
- Romanian 6% Hungarian 3% Lithuanian 3%
- Foreign-born
- 11% · Canada, China
- Languages at home
- 88% English-only · Spanish 5% Russian/Polish/Slavic 2% Arabic 1%
Political lean MEDSL · Pinellas
- 2024 margin
- Lean R (+5.2) · D 46.9% · R 52.1%
- 2008→2024 swing
- -13.5pp toward R · 2008: 8.3pp · 2024: -5.2pp
- All cycles
- 2024: R+5.2 2020: D+0.2 2016: R+1.1 2012: D+5.6 2008: D+8.3
Not yet ingested
- Civics
- —
Market trends
- HPI YoY
- ▼ -0.15%
- Current HPI
- 264.9727
- Rent YoY
- —
- Metro
- Tampa-St. Petersburg-Clearwater, FL
- State GDP YoY
- ▲ 3.28%
- F500 in state
- 36
Industry mix (Fortune 500 HQ in FL)
| Industry | F500 HQs | Revenue |
|---|---|---|
| Industrial Technology | 2 | $29B |
|
||
| Insurance | 2 | $17B |
|
||
| Retail | 1 | $60B |
|
||
| Technology Distribution | 1 | $58B |
|
||
| Homebuilding | 1 | $35B |
|
||
| Technology Manufacturing | 1 | $35B |
|
||
Price history
+425.0% since first listed29 events — show timeline
- 2026-05-16 Listed $419,988 Stellar MLS as Distributed by MLS Grid
- 2025-09-30 Listing Removed — Stellar MLS as Distributed by MLS Grid
- 2025-07-24 Price Changed $459,900 Stellar MLS as Distributed by MLS Grid
- 2025-05-06 Listed $479,900 Stellar MLS as Distributed by MLS Grid
- 2025-01-11 Listing Removed — Stellar MLS as Distributed by MLS Grid
- 2024-09-10 Price Changed $479,900 Stellar MLS as Distributed by MLS Grid
- 2024-07-14 Listed $499,900 Stellar MLS as Distributed by MLS Grid
- 2024-07-11 Listing Removed — Stellar MLS as Distributed by MLS Grid
- 2024-06-11 Price Changed $509,999 Stellar MLS as Distributed by MLS Grid
- 2024-06-11 Price Changed $509,999 RACC
- 2024-06-05 Price Changed $528,850 RACC
- 2024-06-05 Price Changed $528,850 Stellar MLS as Distributed by MLS Grid
- 2024-05-29 Price Changed $528,900 RACC
- 2024-05-29 Price Changed $528,900 Stellar MLS as Distributed by MLS Grid
- 2024-05-23 Price Changed $528,950 RACC
- 2024-05-23 Price Changed $528,950 Stellar MLS as Distributed by MLS Grid
- 2024-04-25 Price Changed $529,000 RACC
- 2024-04-25 Price Changed $529,000 Stellar MLS as Distributed by MLS Grid
- 2023-12-11 Listed $535,000 Stellar MLS as Distributed by MLS Grid
- 2022-08-31 Sold (Public Records) $475,000 Public Records
- 2022-08-30 Sold (MLS) $475,000 Stellar MLS as Distributed by MLS Grid
- 2022-07-12 Pending — Stellar MLS as Distributed by MLS Grid
- 2022-07-06 Listed $499,900 Stellar MLS as Distributed by MLS Grid
- 2013-02-19 Sold (Public Records) $160,000 Public Records
- 2013-02-11 Sold (MLS) $160,000 Stellar MLS as Distributed by MLS Grid
- 2011-12-15 Listed $163,500 Stellar MLS as Distributed by MLS Grid
- 2001-07-25 Sold (Public Records) $125,000 Public Records
- 1991-02-07 Sold (Public Records) $100,000 Public Records
- 1988-08-05 Sold (Public Records) $80,000 Public Records
Property tax history
+6.8%/yrLatest (2025): $7,776 · -3.1% YoY. Source: county tax records.
Cash-flow waterfall
monthlySold comps — $/sqft
last 12 mo · ≤1 miLoading sold comps…