 🏷️ Likely Rental
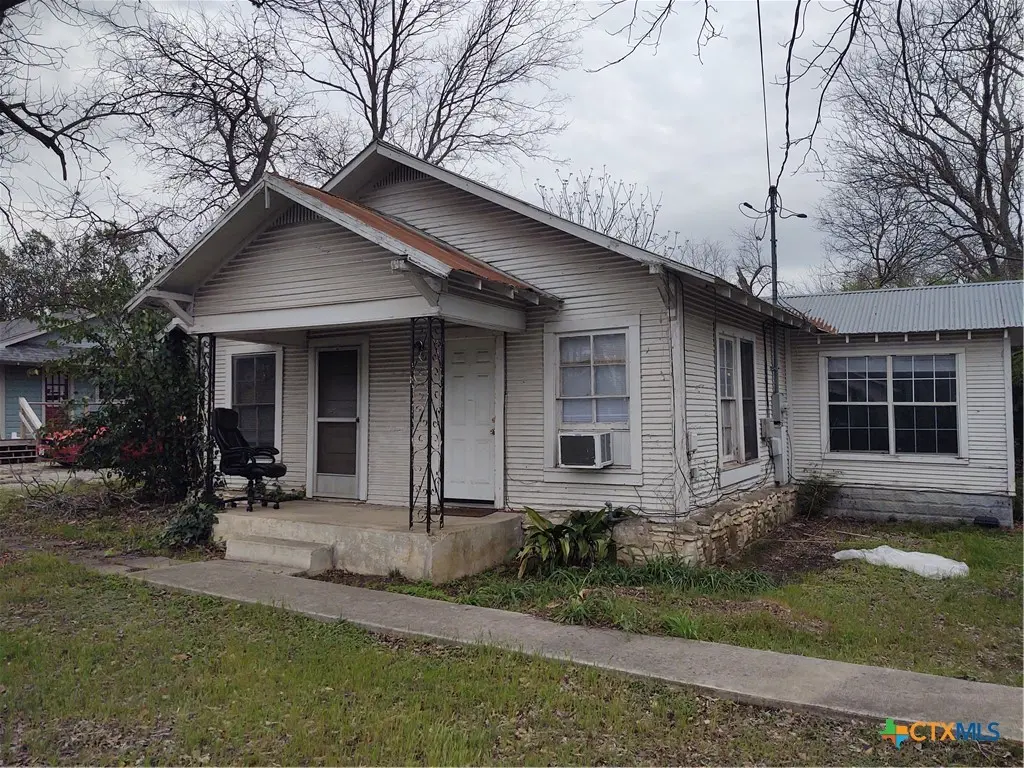
104 Eastwood St · San Marcos, TX
Flood risk 1/10 · Minimal
- FEMA flood zone
- X (unshaded)
- Chance of flooding over 30 yrs
- 0.0%
- Est. flood insurance / yr
- $507 – $1,088
Fire risk 4/10 · Minor
- Est. fire insurance / yr
- $1,222 – $2,270
Heat risk 8/10 · Major
- Hot days now (above 108°F)
- 7 days/yr
- Hot days in 30 yrs
- 21 days/yr
Wind risk 8/10 · Major
- Chance of severe wind over 30 yrs
- 80.0%
Air-quality risk 1/10 · Minimal
- Unhealthy air days now
- 0 days/yr
- Unhealthy air days in 30 yrs
- 0 days/yr
Risk factors via First Street. Map © Google.
Why this score? — see what drove the D grade
The composite is a weighted blend of 9 inputs, each scored 0–100. Each bar is that input's sub-score; the figure is the points it added to the 100-point composite (weight × sub-score).
- ARV discount +15.0/15.0
- Cash flow +8.4/30.0
- Livability +4.0/5.0
- 1% rule +3.0/10.0
- Rent growth +3.0/5.0
- Condition / age +2.5/5.0
- DSCR +2.3/10.0
- Schools +2.0/10.0
- Appreciation +0.0/10.0
$155,000
🖨 Deal sheet 📄 Offer letter ✓ Due diligence
Listing remarks MLS
2 BEDROOM 1 BATH HOUSE ON JUST OVER A QUARTER OF AN ACRE. 2 MIN TO HEB OR IH 35 OR THE SAN MARCOS RIVER. UNIT IS TENANT OCCUPIED, YOU WILL NEED TO CALL THE OFFICE AND SET UP AN APPOINTMENT 24 HOURS IN ADVANCE. PICK UP A KEY AT SKILES AND ASSOCIATES. THANKS FOR LOOKING. VIRTUAL TOUR AVAILABLE.
Key facts
- 0.25 acre lot
- Built 1998
- Listed 99 days
Neighborhood map
What this means for you Summary
Snapshot
- This is a 2-bed/1.0-bath single-family listed at $155k.
Deal economics
- At list price, monthly cash flow is $-140 ($-2k/yr) — negative.
- To cash-flow at today's rent, offer at most $130k (15.9% below list).
- To meet the 1% rule (rent ≥ 1% of price), the offer needs to be $125k (19.7% below list).
- Recommended offer: $125k (19.7% below list) — sets the bar for 1% rule.
- Cap rate 5.2% vs local median 3.1% in San Marcos — top-decile yield for the area; either an underpriced asset or a hidden risk that comps aren't pricing in. Stress-test before assuming the spread holds.
Location & tenants
- Location reads 81/100 on livability (#30 in TX, #1,601 nationally) — a professional / high-income tenant draw. Strengths: amenities A+, cost of living A+, health & safety A+; Watch: crime D+, schools F, employment F.
- San Marcos CISD (rural): math 18% / reading 31% proficiency, ranked #731 of 826 in TX (top 88%) — low school quality limits family demand, transient renter base, plan for 1-2y turnover; 63% free/reduced lunch — lower-income household profile, screen leases tightly.
- Market conditions: Rents rising (+2.0%/yr); 1122 active listings in the ZIP; 40 comparable units currently listed for rent nearby; rentals at typical pace (median 18d on market — plan ~3-4 weeks tenant-placement turnaround); 5,270 units permitted in Hays County in 2024 (1,464 in 5+ unit buildings).
Forward outlook
- Local home prices are declining (-3.0%/yr); year-one equity from $1k of loan paydown is wiped out by about $5k of value loss. Plan a longer hold.
- Hays County population projected at +93% by 2050 — long-run rental-demand tailwind backs the buy-and-hold thesis.
Negotiation context
- It's been on market 99 days — a 9% lower offer ($141k) is reasonable based on typical stale-listing flexibility.
- 4 sale attempts with the ask held roughly flat each time — persistent listings suggest the price (not the market) is what's stuck; bring a comps-based counter.
Risks & watch-outs
- Climate carrying-cost: severe wind risk, 80% chance of damaging wind over 30y; extreme-heat days projected 7→21/yr by 2055 (HVAC capex compounding) — expect insurance premiums to compound above CPI over the hold.
Questions for the listing agent
- What do current leases actually rent for vs. the listed asking? Can we see a recent rent roll and the last 12 months of T-12 income?
- It's been on market 99 days. Have you received any prior offers? Is the seller open to a 20% concession, seller financing, or rate buy-down credit?
- Why hasn't it sold? Are there any deal-killer items the seller is aware of (foundation, flood, title, zoning, code violations)?
- Is there a deadline driving the sale (1031 exchange, divorce, estate, relocation)? That informs how much negotiation room exists.
- Schools are F-rated, which usually means shorter tenancies and higher turnover. Who's the typical renter profile here, and what's been the actual vacancy rate?
- Crime grade is D in this area — have there been break-ins, vandalism, or insurance claims at this property in the last 3 years? What carrier currently insures it and at what premium?
- The area grade is low — what's the realistic commute time and amenity access for the typical tenant pool here? Any planned neighborhood developments (good or bad) we should know about?
- What's the average days-on-market for RENTAL listings here right now (not sales)? A rising rental-DOM trend means longer vacancies and softer asking-rent achievability than the comps imply.
- What's the recent tenant-quality profile in this submarket — average credit score on applications, eviction rate, late-payment / NSF rate, and stable-employment percentage? A property-management company in the area should have these aggregated.
- How much new for-sale + rental construction is in the pipeline within 1–3 miles? Heavy new supply typically softens prices + rents 12–24 months out; constrained supply supports both.
Investment metrics
- 1% rule
- 0.80% ✗
- Cap rate
- 5.21%
- Cash-on-cash
- -3.86%
- DSCR
- 0.83
- GRM
- 10.4
CMA / ARV
- ARV (median comp)
- $217,154
- List price
- $155,000
- Delta
- -28.62%
- Verdict
- UNDERPRICED
- Comps
- 5 within 1.0 mi
Projected returns pro-forma
-3.0% appreciation · 1.98% rent growth · sell at horizon
- IRR
- -24.0%
- Equity multiple
- 0.19×
- Total profit
- $-35,220
- Equity at exit
- $23,111
- IRR
- -22.2%
- Equity multiple
- -0.08×
- Total profit
- $-46,995
- Equity at exit
- $13,402
Cash invested: $43,400 (down + closing). Projections, not guarantees.
Landlord ↔ Tenant lean methodology
- Overall (STATE)
- 87 Strongly Landlord-Friendly
- State Texas
- 87 Strongly Landlord-Friendly · R+5
- County
- — inherits STATE
- City
- — inherits STATE
ZIP-level market 78666
- Rents YoY
- 2.0%
- Active inventory
- 1122
- Price-to-rent
- 10.4×
Monthly cashflow live
- Estimated rent
- $1,245 high interval (Pro) →
- Mortgage (P&I)
- −$813
- Tax from tax record
- −$246 /mo · $2,950/yr
- Insurance
- −$65
- HOA
- −$0
- Vacancy / Maint / Mgmt
- −$261
- Net cashflow
- $-140
Break-even live
UW: 25.0% down · 7.5% · 30yr · 1.5% tax · 5.0% vac · 8.0% maint · 8.0% mgmt
Financing live
Cash to close
- Down payment
- $38,750
- Closing costs
- $4,650
- Reserves months
- —
- Total cash needed
- —
Loan-product check · same deal, 3 products live
Conventional
25% down · 7.5% · 30yr
- Down + closing
- —
- Monthly P&I
- —
- Monthly cashflow
- —
- DSCR
- —
- Eligible?
- —
Personal DTI + credit; lowest rate.
DSCR
20% down · 8.5% · 30yr
- Down + closing
- —
- Monthly P&I
- —
- Monthly cashflow
- —
- DSCR
- —
- Eligible?
- —
No personal income docs; deal must DSCR.
Hard money
10% down · 12.0% · 12mo
- Down + closing
- —
- Monthly P&I
- —
- Monthly cashflow
- —
- DSCR
- —
- Eligible?
- —
Short-term bridge; refi at stabilization.
Rent comps 40 comps
| Address | Beds | Baths | Sqft | Rent | $/sqft | DOM | Units | Dist |
|---|---|---|---|---|---|---|---|---|
| 107 Meiners St Unit B San Marcos, TX | 1.0 | 1.0 | 600 | $1,200 | $2.00 | 44d | 1 | 0.04mi |
| 101 Lockhart St San Marcos, TX | 2.0 | 2.0 | 960 | $1,420 | $1.48 | 8d | 1 | 0.14mi |
| 109 West Ave San Marcos, TX | 2.0–4.0 | 2.0–3.0 | 1137 | $599 | $0.53 | 8d | 6 | 0.17mi |
| 1624 Aquarena Springs Dr San Marcos, TX | 2.0 | 2.0 | 720 | $1,050 | $1.46 | 24d | 1 | 0.19mi |
| 1624 Aquarena Springs Dr San Marcos, TX | 2.0 | 2.0 | 720 | $925 | $1.28 | 44d | 2 | 0.20mi |
| 1351 Thorpe Ln Unit 710 San Marcos, TX | 2.0 | 2.0 | 834 | $831 | $1.00 | 3d | 1 | 0.21mi |
| 1351 Thorpe Ln Unit 610 San Marcos, TX | 1.0 | 1.0 | 753 | $1,391 | $1.85 | 3d | 1 | 0.21mi |
| 1640 Aquarena Springs Dr San Marcos, TX | 1.0–2.0 | 1.0–1.5 | 817 | $1,200 | $1.47 | 2d | 7 | 0.25mi |
| 130 Jackson Ln San Marcos, TX | 2.0 | 1.0 | 725 | $850 | $1.17 | 44d | 1 | 0.26mi |
| 1623 Aquarena Springs Dr San Marcos, TX | 1.0–2.0 | 1.0–2.0 | 650 | $999 | $1.54 | 4d | 29 | 0.28mi |
| 208 Uhland Rd Unit 3 San Marcos, TX | 2.0 | 1.0 | 950 | $1,100 | $1.16 | 44d | 1 | 0.30mi |
| 1354 Thorpe Ln San Marcos, TX | 2.0 | 1.0–2.0 | 692 | $1,958 | $2.83 | 2d | 77 | 0.31mi |
| 1537 Post Rd #101 San Marcos, TX | 2.0 | 2.0 | 1050 | $1,400 | $1.33 | 18d | 1 | 0.34mi |
| 618 Mill St Unit B San Marcos, TX | 2.0 | 2.0 | 950 | $1,150 | $1.21 | 3d | 1 | 0.37mi |
| 622 Mill St Unit 622B San Marcos, TX | 2.0 | 1.0 | 816 | $975 | $1.19 | 44d | 1 | 0.38mi |
| 628 Mill St San Marcos, TX | 2.0 | 1.0 | 900 | $1,000 | $1.11 | 44d | 1 | 0.41mi |
| 1202 Thorpe Ln San Marcos, TX | 1.0–2.0 | 1.0–2.0 | 902 | $1,450 | $1.61 | 8d | 1 | 0.41mi |
| 503 Uhland Rd San Marcos, TX | 3.0 | 2.0 | 1052 | $1,695 | $1.61 | 44d | 1 | 0.46mi |
| 1629 Post Rd San Marcos, TX | 1.0–3.0 | 1.0–3.0 | 1025 | $914 | $0.89 | 3d | 1 | 0.56mi |
| 200 Springtown Way San Marcos, TX | 1.0–4.0 | 1.0–4.0 | 1059 | $2,293 | $2.16 | 4d | 1 | 0.58mi |
| 200 Springtown Way San Marcos, TX | 1.0–4.0 | 1.0–4.0 | 1059 | $1,093 | $1.03 | 44d | 13 | 0.58mi |
| 1805 N Interstate 35 San Marcos, TX | 2.0 | 1.0–2.0 | 852 | $1,059 | $1.24 | 18d | 6 | 0.68mi |
| 1805 Aquarena Springs Dr San Marcos, TX | 1.0–2.0 | 1.0–2.0 | 673 | $1,179 | $1.75 | 24d | 1 | 0.76mi |
| 1654 Post Rd San Marcos, TX | 1.0–2.0 | 1.0–2.0 | 594 | $980 | $1.65 | 18d | 3 | 0.84mi |
| 1647 Post Rd San Marcos, TX | 2.0–4.0 | 2.0–4.0 | 1144 | $775 | $0.68 | 16d | 14 | 0.84mi |
| 2113 River Rd San Marcos, TX | 1.0 | 1.0 | 525 | $1,000 | $1.90 | 44d | 1 | 0.97mi |
| 1005 Haynes St San Marcos, TX | 2.0 | 1.0 | 637 | $1,350 | $2.12 | 19d | 1 | 0.97mi |
| 520 Linda Dr San Marcos, TX | 2.0 | 2.0 | 810 | $1,050 | $1.30 | 24d | 18 | 0.99mi |
| 518 Linda Dr San Marcos, TX | 1.0–2.0 | 1.0–1.5 | 730 | $1,300 | $1.78 | 2d | 8 | 1.03mi |
| 1650 River Rd San Marcos, TX | 1.0–2.0 | 1.0–2.0 | 749 | $1,350 | $1.80 | 4d | 18 | 1.04mi |
| 1304 Conway Dr San Marcos, TX | 2.0 | 2.0 | 1092 | $1,500 | $1.37 | 18d | 1 | 1.06mi |
| 950 Field St San Marcos, TX | 3.0 | 1.0 | 1072 | $1,400 | $1.31 | 44d | 1 | 1.06mi |
| 1909 Pecan St Unit C San Marcos, TX | 2.0 | 1.0 | 855 | $1,245 | $1.46 | 44d | 1 | 1.08mi |
| 105 Riverside Dr San Marcos, TX | 3.0 | 2.0 | 1044 | $1,950 | $1.87 | 8d | 1 | 1.09mi |
| 400 Linda Dr San Marcos, TX | 2.0 | 1.0 | 750 | $805 | $1.07 | 10d | 2 | 1.12mi |
| 1800 Old Post Rd San Marcos, TX | 1.0–4.0 | 2.0 | 1076 | $1,132 | $1.05 | 4d | 1 | 1.15mi |
| 1800 Post Rd Unit 610 San Marcos, TX | 1.0 | 1.0 | 674 | $931 | $1.38 | 3d | 1 | 1.15mi |
| 1800 Post Rd Unit 710 San Marcos, TX | 2.0 | 2.0 | 892 | $1,031 | $1.16 | 3d | 1 | 1.15mi |
| 748 N LBJ Dr San Marcos, TX | 1.0–2.0 | 1.0 | 591 | $1,188 | $2.01 | 24d | 9 | 1.28mi |
| 314 E Hutchison St San Marcos, TX | 2.0 | 1.0 | 830 | $1,300 | $1.57 | 18d | 1 | 1.28mi |
Listing history 21 events
-
2026-06-18days on market $155,000 Active 99 DOM
-
2026-06-17days on market $155,000 Active 98 DOM
-
2026-06-16days on market $155,000 Active 97 DOM
-
2026-06-15days on market $155,000 Active 96 DOM
-
2026-06-13days on market $155,000 Active 94 DOM
-
2026-06-09days on market $155,000 Active 90 DOM
-
2026-06-08days on market $155,000 Active 89 DOM
-
2026-06-07days on market $155,000 Active 88 DOM
-
2026-06-05pricedays on market $155,000 Active 85 DOM
-
2026-06-03days on market $160,000 Active 84 DOM
-
2026-06-02days on market $160,000 Active 83 DOM
-
2026-06-01days on market $160,000 Active 82 DOM
-
2026-05-31days on market $160,000 Active 81 DOM
-
2026-03-26status Active 293-char remark
Show marketing remark (293 chars)
2 BEDROOM 1 BATH HOUSE ON JUST OVER A QUARTER OF AN ACRE. 2 MIN TO HEB OR IH 35 OR THE SAN MARCOS RIVER. UNIT IS TENANT OCCUPIED, YOU WILL NEED TO CALL THE OFFICE AND SET UP AN APPOINTMENT 24 HOURS IN ADVANCE. PICK UP A KEY AT SKILES AND ASSOCIATES. THANKS FOR LOOKING. VIRTUAL TOUR AVAILABLE.
-
2026-03-19historical Active Under Contract 293-char remark
Show marketing remark (293 chars)
2 BEDROOM 1 BATH HOUSE ON JUST OVER A QUARTER OF AN ACRE. 2 MIN TO HEB OR IH 35 OR THE SAN MARCOS RIVER. UNIT IS TENANT OCCUPIED, YOU WILL NEED TO CALL THE OFFICE AND SET UP AN APPOINTMENT 24 HOURS IN ADVANCE. PICK UP A KEY AT SKILES AND ASSOCIATES. THANKS FOR LOOKING. VIRTUAL TOUR AVAILABLE.
-
2026-03-10$160,000 Active 293-char remark
Show marketing remark (293 chars)
2 BEDROOM 1 BATH HOUSE ON JUST OVER A QUARTER OF AN ACRE. 2 MIN TO HEB OR IH 35 OR THE SAN MARCOS RIVER. UNIT IS TENANT OCCUPIED, YOU WILL NEED TO CALL THE OFFICE AND SET UP AN APPOINTMENT 24 HOURS IN ADVANCE. PICK UP A KEY AT SKILES AND ASSOCIATES. THANKS FOR LOOKING. VIRTUAL TOUR AVAILABLE.
-
2025-07-20historical $900
-
2025-06-30$900
-
2025-06-30historical $900
-
2025-06-04$900
-
2002-05-26soldstatus
ⓘ Source: listings_history table (triggers on properties + properties_extension) + one-shot
backfill from property_details.listing_events for pre-trigger history.
Tax reassessment forecast TX · Resets to sale price
- Current annual tax
- $2,950 · $246/mo
- Projected year-2 tax
- $2,950 · $246/mo
- Expected delta
- $0/yr ($0/mo · 0.0%)
ⓘ Screening estimate from a state-policy table — verify with the county assessor before closing.
Climate risk First Street
- Flood 1/10 Low FEMA zone X (unshaded) · 0% chance over 30 yrs
- Wildfire 4/10 Moderate
- Heat 8/10 Severe 7 d/yr ≥108°F today · 21 d/yr by 30 yrs out
- Wind 8/10 Severe 80% chance of damaging wind over 30 yrs
- Air quality 1/10 Low 0 unhealthy d/yr today · 0 by 30 yrs out
Nearby sold comps map
Loading sold comps map…
Walkable amenities ~0.75 mi
Loading nearby amenities…
Taxation est. · year 1
- Rental income
- $14,942
- − Mortgage interest
- −$8,682
- − Property taxes
- −$2,950
- − Insurance
- −$775
- − Repairs & maintenance
- −$1,195
- − Management
- −$1,195
- − Depreciation
- −$4,509
- Taxable loss
- −$4,365
- Est. tax savings @ 24.0%
- +$1,048
- After-tax cash flow
- $-627/yr
For passive investors: Depreciation is non-cash, so a rental often shows a tax loss while cash-flowing — sheltering income. Rental losses are passive: they offset passive income freely, and up to $25,000/yr can offset ordinary (W-2) income if you actively participate and your MAGI is under $100k (phasing out to $0 by $150k); unused losses carry forward. On sale, claimed depreciation is recaptured at up to 25%, and gains may owe capital-gains tax (a 1031 exchange can defer both). Figures are a year-1 estimate at your 24.0% rate — not tax advice; consult a CPA.
Schools (NCES district)
- District
- San Marcos CISD
- NCES district ID
- 4838970
- Math proficiency
- 18% ▼ -16.00%
- Reading proficiency
- 31% ▼ -8.00%
- Median HH income
- $34,538
- Composite
- 20.11/100
- National rank
- #8644
- State rank
- #731 of 826 in TX
Livability — San Marcos
- Score
- 81/100
- State rank
- #30
- US rank
- #1601
Category grades
Schools grade is shown separately in the Schools card above.
Census & demographics
- Census place
- San Marcos, TX
- County
- Hays County · 280,138 people
- City population
- 88,583
- Metro
- Austin-Round Rock-Georgetown, TX
- Population (ZIP)
- 88,583
- Household income
- $54,737
- Rent vs Own
- Severe rent burden
- 6504.0
Population outlook (Hays County) Hauer SSP2
- Today (2025)
- 286,948 people
- By 2030
- 336,923 · +17.4%
- By 2040
- 441,894 · +54.0%
- By 2050
- 553,462 · +92.9%
- By 2075
- 838,261 · +192.1%
- By 2100
- 1,063,658 · +270.7%
Race, ethnicity, and origin ACS 2023
- Neighborhood character
- Diverse neighborhood (Simpson 0.60)
- Race & ethnicity
- White 45% Hispanic / Latino 44% Two or more races 20% Black 5% Asian 2%
- Hispanic origin (detail)
- Mexican 37%
- Common ancestry
- Slovak 2% Lithuanian 2% Italian 1%
- Foreign-born
- 8% · Canada
- Languages at home
- 73% English-only · Spanish 24% Other Indo-European 1%
Political lean MEDSL · Hays
- 2024 margin
- Lean D (+5.7) · D 52.1% · R 46.5% · Other 1.4%
- 2008→2024 swing
- +7.7pp toward D · 2008: -2.0pp · 2024: 5.7pp
- All cycles
- 2024: D+5.7 2020: D+10.8 2016: R+0.9 2012: R+10.4 2008: R+2.0
Not yet ingested
- Civics
- —
Market trends
- HPI YoY
- ▼ -108.27%
- Current HPI
- 187.6679
- Rent YoY
- ▲ 1.98%
- Metro
- Austin-Round Rock-Georgetown, TX
- State GDP YoY
- ▲ 3.95%
- F500 in state
- 110
Industry mix (Fortune 500 HQ in TX)
| Industry | F500 HQs | Revenue |
|---|---|---|
| Energy | 16 | $1,198B |
|
||
| Technology | 5 | $198B |
|
||
| Engineering / Construction | 4 | $72B |
|
||
| Energy Services | 3 | $60B |
|
||
| Utilities | 3 | $41B |
|
||
| Healthcare | 2 | $330B |
|
||
Price history
8 events — show timeline
- 2026-03-26 Relisted — CTXMLS
- 2026-03-19 Contingent — CTXMLS
- 2026-03-10 Listed $160,000 CTXMLS
- 2025-07-20 Rental Removed $900 SHOWMOJO
- 2025-06-30 Listed for Rent $900 SHOWMOJO
- 2025-06-30 Rental Removed $900 APPFOLIO
- 2025-06-04 Listed for Rent $900 APPFOLIO
- 2002-05-26 Sold (Public Records) — Public Records
Property tax history
+5.7%/yrLatest (2025): $2,950 · -0.1% YoY. Source: county tax records.
Cash-flow waterfall
monthlySold comps — $/sqft
last 12 mo · ≤1 miLoading sold comps…