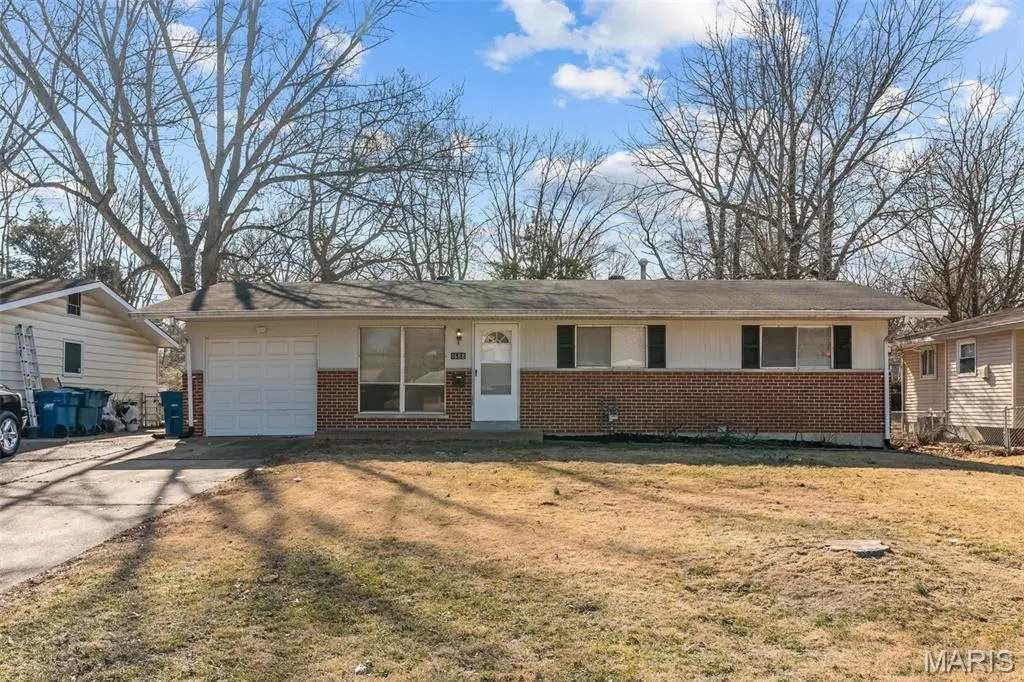
1688 Maldon Ln · Dellwood, MO
Flood risk 1/10 · Minimal
- FEMA flood zone
- X (unshaded)
- Chance of flooding over 30 yrs
- 0.0%
- Est. flood insurance / yr
- $473 – $860
Fire risk 1/10 · Minimal
- Est. fire insurance / yr
- $1,054 – $1,958
Heat risk 5/10 · Moderate
- Hot days now (above 106°F)
- 7 days/yr
- Hot days in 30 yrs
- 21 days/yr
Wind risk 2/10 · Minimal
- Chance of severe wind over 30 yrs
- 1.0%
Air-quality risk 3/10 · Minor
- Unhealthy air days now
- 3 days/yr
- Unhealthy air days in 30 yrs
- 5 days/yr
Risk factors via First Street. Map © Google.
Why this score? — see what drove the B grade
The composite is a weighted blend of 9 inputs, each scored 0–100. Each bar is that input's sub-score; the figure is the points it added to the 100-point composite (weight × sub-score).
- Cash flow +26.8/30.0
- ARV discount +13.7/15.0
- DSCR +9.2/10.0
- 1% rule +7.1/10.0
- Appreciation +6.9/10.0
- Rent growth +3.7/5.0
- Livability +3.3/5.0
- Condition / age +2.5/5.0
- Schools +0.4/10.0
$109,900
🖨 Deal sheet 📄 Offer letter ✓ Due diligence
Listing remarks MLS
Welcome to this renovated ranch home in Dellwood! You'll be just steps from Bon Oak Park and Dellwood Rec Center, with quick access to I-270, schools, and all of the shops and restaurants along W. Florissant Avenue. A brick front adds curb appeal and leads you inside to the bright living room with hardwood floors, a dining area, and charming window into the kitchen. You'll have brand new cabinets, counters, and luxury vinyl plank floors. All three bedrooms have hardwood floors, and the bathroom has been updated with new flooring, a tile-surround tub, vanity, lighting, and fixtures. There's plenty of room for storage in the unfinished basement. Enjoy the weather on the large patio overlooking the fenced backyard, shaded by trees. Schedule your showing today! Please note: this home cannot be used as a rental due to Dellwood restrictions.
Key facts
- Brick front
- Bright living room
- Renovated ranch home
Tags
Neighborhood map
What this means for you Summary
Snapshot
- This is a 3-bed/1.5-bath single-family listed at $110k.
Deal economics
- At list price, monthly cash flow is $302 ($4k/yr) — positive.
- The deal already cash-flows at list — no discount required.
- Meets the 1% rule at list price ($1k rent vs $110k).
- Recommended offer: $100k (9.0% below list) — sets the bar for market timing.
Location & tenants
- Location reads 66/100 on livability (#239 in MO) — a middle-class / working-renter tenant base. Strengths: cost of living A+, housing A+; Watch: health & safety C-, schools D, crime D-.
- Riverview Gardens (suburban): math 2% / reading 9% proficiency, ranked #324 of 324 in MO (top 100%) — low school quality limits family demand, transient renter base, plan for 1-2y turnover; 90% free/reduced lunch — lower-income household profile, screen leases tightly.
- Market conditions: Rents rising fast (+5.0%/yr); 372 active listings in the ZIP; 40 comparable units currently listed for rent nearby; rentals lingering (median 44d on market — plan ~5-8 weeks vacancy on turnover, expect pricing pressure); 50% of comp listings sitting > 30 days — soft ceiling on asking rent; lower-income renter base — watch delinquency; 920 units permitted in St. Louis County in 2024 (250 in 5+ unit buildings).
- This rent runs 39% of the median local income ($41k/yr) — at the standard rent-burdened threshold; future hikes will face affordability resistance.
Forward outlook
- In year one you build about $5k of equity ($760 loan paydown + $4k appreciation (3.8% local appreciation)).
- At projected returns (3.8% appreciation + 5.0% rent growth), your $31k cash investment doubles in ~4 years — after that, you're playing with house money.
- By year 7, paydown + projected appreciation supports a ~$31k cash-out refi (75% LTV) — recoverable capital for the next deal without selling this one.
Negotiation context
- It's been on market 108 days — a 9% lower offer ($100k) is reasonable based on typical stale-listing flexibility.
- 6 sale attempts since 2y ago; this cycle's ask has dropped $15k (12%) from the opening price — seller is motivated, your offer sets the floor, not the list.
- Current owner paid $38k; list at $110k implies a 193% gain — meaningful room to come down on a strong offer.
Risks & watch-outs
- Watch-outs: built in 1958 — expect roof / HVAC / electrical / plumbing capex.
- Climate carrying-cost: extreme-heat days projected 7→21/yr by 2055 (HVAC capex compounding) — expect insurance premiums to compound above CPI over the hold.
Questions for the listing agent
- It's been on market 108 days. Have you received any prior offers? Is the seller open to a 9% concession, seller financing, or rate buy-down credit?
- Built in 1958 — when were the roof, HVAC, electrical panel, plumbing, and water heater last replaced?
- Why hasn't it sold? Are there any deal-killer items the seller is aware of (foundation, flood, title, zoning, code violations)?
- Is there a deadline driving the sale (1031 exchange, divorce, estate, relocation)? That informs how much negotiation room exists.
- Schools are D-rated, which usually means shorter tenancies and higher turnover. Who's the typical renter profile here, and what's been the actual vacancy rate?
- Crime grade is D in this area — have there been break-ins, vandalism, or insurance claims at this property in the last 3 years? What carrier currently insures it and at what premium?
- What's the average days-on-market for RENTAL listings here right now (not sales)? A rising rental-DOM trend means longer vacancies and softer asking-rent achievability than the comps imply.
- What's the recent tenant-quality profile in this submarket — average credit score on applications, eviction rate, late-payment / NSF rate, and stable-employment percentage? A property-management company in the area should have these aggregated.
- How much new for-sale + rental construction is in the pipeline within 1–3 miles? Heavy new supply typically softens prices + rents 12–24 months out; constrained supply supports both.
Investment metrics
- 1% rule
- 1.21% ✓
- Cap rate
- 9.59%
- Cash-on-cash
- 11.77%
- DSCR
- 1.52
- GRM
- 6.9
CMA / ARV
- ARV (median comp)
- $127,323
- List price
- $109,900
- Delta
- -13.68%
- Verdict
- UNDERPRICED
- Comps
- 20 within 1.0 mi
Show comp detail 12 sales within ~0.75 mi
| Address | Dist | Beds/Ba | Sqft | Sold | Price | $/sf | Match |
|---|---|---|---|---|---|---|---|
| 9871 Medford Dr | 0.51mi | 3/1.0 | 950 (+4%) | 2mo | $124,900 | $131 | 66 |
| 1719 Newhall Ct | 0.52mi | 3/1.0 | 975 (+7%) | 0mo | $120,000 | $123 | 62 |
| 10038 Balboa Dr | 0.59mi | 3/1.0 | 864 (-5%) | 2mo | $49,900 | $58 | 60 |
| 1646 Hudson Rd | 0.38mi | 3/1.0 | 1,014 (+11%) | 2mo | $164,500 | $162 | 60 |
| 10418 Quaker Dr | 0.43mi | 3/1.5 | 1,014 (+11%) | 2mo | $64,900 | $64 | 60 |
| 10515 Alliance Dr | 0.48mi | 3/1.0 | 1,014 (+11%) | 0mo | $112,900 | $111 | 57 |
| 1354 Stein Rd | 0.51mi | 4/2.0 (+1) | 982 (+8%) | 2mo | $160,000 | $163 | 55 |
| 10020 Dellridge Ln | 0.43mi | 2/1.0 (-1) | 816 (-10%) | 1mo | $49,900 | $61 | 54 |
| 1923 Nashua Dr | 0.54mi | 3/1.0 | 1,014 (+11%) | 1mo | $149,900 | $148 | 53 |
| 1829 Chambers Rd | 0.54mi | 2/1.0 (-1) | 816 (-10%) | 1mo | $34,900 | $43 | 49 |
| 10269 Dacey Dr | 0.54mi | 4/1.0 (+1) | 1,014 (+11%) | 1mo | $169,000 | $167 | 49 |
| 9828 Lorna Ln | 0.61mi | 2/1.0 (-1) | 792 (-13%) | 2mo | $65,000 | $82 | 41 |
Match score weights: distance 35% · size 25% · config 20% · recency 20%. Top-matched comps best support the ARV.
Projected returns pro-forma
3.79% appreciation · 4.97% rent growth · sell at horizon
- IRR
- 21.6%
- Equity multiple
- 2.29×
- Total profit
- $39,829
- Equity at exit
- $54,377
- IRR
- 23.0%
- Equity multiple
- 4.69×
- Total profit
- $113,566
- Equity at exit
- $87,883
Cash invested: $30,772 (down + closing). Projections, not guarantees.
Landlord ↔ Tenant lean methodology
- Overall (STATE)
- 81 Strongly Landlord-Friendly
- State Missouri
- 81 Strongly Landlord-Friendly · R+10
- County
- — inherits STATE
- City
- — inherits STATE
ZIP-level market 63136
- Home prices YoY
- 0.9%
- Rents YoY
- 5.0%
- Active inventory
- 372
- Price-to-rent
- 6.9×
Monthly cashflow live
- Estimated rent
- $1,331 high interval (Pro) →
- Mortgage (P&I)
- −$576
- Tax from tax record
- −$128 /mo · $1,532/yr
- Insurance
- −$46
- HOA
- −$0
- Vacancy / Maint / Mgmt
- −$280
- Net cashflow
- $302
Break-even live
UW: 25.0% down · 7.5% · 30yr · 1.5% tax · 5.0% vac · 8.0% maint · 8.0% mgmt
Financing live
Cash to close
- Down payment
- $27,475
- Closing costs
- $3,297
- Reserves months
- —
- Total cash needed
- —
Loan-product check · same deal, 3 products live
Conventional
25% down · 7.5% · 30yr
- Down + closing
- —
- Monthly P&I
- —
- Monthly cashflow
- —
- DSCR
- —
- Eligible?
- —
Personal DTI + credit; lowest rate.
DSCR
20% down · 8.5% · 30yr
- Down + closing
- —
- Monthly P&I
- —
- Monthly cashflow
- —
- DSCR
- —
- Eligible?
- —
No personal income docs; deal must DSCR.
Hard money
10% down · 12.0% · 12mo
- Down + closing
- —
- Monthly P&I
- —
- Monthly cashflow
- —
- DSCR
- —
- Eligible?
- —
Short-term bridge; refi at stabilization.
Rent comps 40 comps
| Address | Beds | Baths | Sqft | Rent | $/sqft | DOM | Units | Dist |
|---|---|---|---|---|---|---|---|---|
| 1654 Mowbry Ln Saint Louis, MO | 3.0 | 1.0 | 936 | $1,300 | $1.39 | 23d | 1 | 0.16mi |
| 1547 Babcock Dr Saint Louis, MO | 3.0 | 1.0 | 1014 | $1,480 | $1.46 | 43d | 1 | 0.25mi |
| 10329 Chesley Dr Saint Louis, MO | 3.0 | 1.0 | 1014 | $1,350 | $1.33 | 23d | 1 | 0.36mi |
| 9868 Lorna Ln Saint Louis, MO | 3.0 | 1.0 | 1032 | $1,175 | $1.14 | 43d | 1 | 0.49mi |
| 10239 Green Valley Dr Saint Louis, MO | 3.0 | 1.0 | 1014 | $1,395 | $1.38 | 23d | 1 | 0.54mi |
| 10124 Winkler Dr Saint Louis, MO | 2.0 | 1.0 | 792 | $1,400 | $1.77 | 3d | 1 | 0.56mi |
| 9840 Medford Dr Saint Louis, MO | 3.0 | 1.0 | 912 | $1,095 | $1.20 | 43d | 1 | 0.56mi |
| 9850 Dennis Dr Saint Louis, MO | 2.0 | 1.0 | 1032 | $1,175 | $1.14 | 43d | 1 | 0.56mi |
| 9839 Medford Dr Saint Louis, MO | 3.0 | 1.0 | 912 | $1,095 | $1.20 | 43d | 1 | 0.59mi |
| 9845 Dennis Dr Saint Louis, MO | 3.0 | 1.0 | 960 | $1,550 | $1.61 | 12d | 1 | 0.59mi |
| 10078 Green Valley Dr Saint Louis, MO | 3.0 | 1.0 | 900 | $1,325 | $1.47 | 7d | 1 | 0.64mi |
| 1733 Kappel Ave Saint Louis, MO | 3.0 | 1.0 | 912 | $1,250 | $1.37 | 23d | 1 | 0.65mi |
| 10128 Cloverdale Dr Saint Louis, MO | 2.0 | 1.0 | 792 | $1,000 | $1.26 | 43d | 1 | 0.67mi |
| 10128 Cloverdale Dr Saint Louis, MO | 2.0 | 1.0 | 792 | $1,000 | $1.26 | 23d | 1 | 0.67mi |
| 1926 Chambers Rd Saint Louis, MO | 4.0 | 1.0 | 1095 | $995 | $0.91 | 14d | 1 | 0.71mi |
| 9750 Lorna Ln Saint Louis, MO | 3.0 | 1.0 | 1032 | $1,100 | $1.07 | 43d | 1 | 0.76mi |
| 10129 Cavalier Ct Saint Louis, MO | 3.0 | 1.5 | 912 | $1,250 | $1.37 | 23d | 1 | 0.80mi |
| 9725 Medford Dr Saint Louis, MO | 3.0 | 1.0 | 912 | $1,485 | $1.63 | 43d | 1 | 0.82mi |
| 9827 Winkler Dr Saint Louis, MO | 3.0 | 1.0 | 864 | $1,450 | $1.68 | 7d | 1 | 0.83mi |
| 9823 Winkler Dr Saint Louis, MO | 2.0 | 1.0 | 788 | $900 | $1.14 | 43d | 1 | 0.84mi |
| 9717 Dennis Dr Saint Louis, MO | 3.0 | 1.0 | 1056 | $1,323 | $1.25 | 43d | 1 | 0.94mi |
| 9709 Balboa Dr Saint Louis, MO | 3.0 | 1.0 | 1000 | $1,600 | $1.60 | 43d | 1 | 0.94mi |
| 920 Hutton Pl Saint Louis, MO | 3.0 | 1.0 | 912 | $1,195 | $1.31 | 43d | 1 | 0.97mi |
| 502 Averill Ave Saint Louis, MO | 2.0 | 1.0 | 840 | $1,250 | $1.49 | 43d | 1 | 0.97mi |
| 338 La Motte Ln Saint Louis, MO | 2.0 | 1.0 | 904 | $1,150 | $1.27 | 43d | 1 | 1.04mi |
| 104 Fenwick Dr Saint Louis, MO | 3.0 | 1.0 | 960 | $1,250 | $1.30 | 23d | 1 | 1.04mi |
| 2008 Kappel Dr Saint Louis, MO | 3.0 | 1.0 | 858 | $1,175 | $1.37 | 23d | 1 | 1.05mi |
| 1550 Northwinds Estates Dr St. Louis, MO | 1.0–2.0 | 1.0–1.5 | 877 | $1,050 | $1.20 | 43d | 1 | 1.10mi |
| 9547 Glen Owen Dr Saint Louis, MO | 2.0 | 1.0 | 923 | $985 | $1.07 | 23d | 1 | 1.14mi |
| 307 Coppinger Dr Saint Louis, MO | 3.0 | 1.0 | 960 | $1,095 | $1.14 | 17d | 1 | 1.15mi |
| 650 Robert Ave Ferguson, MO | 3.0 | 1.0 | 816 | $1,224 | $1.50 | 43d | 1 | 1.16mi |
| 415 Ames Pl Saint Louis, MO | 3.0 | 1.0 | 816 | $1,400 | $1.72 | 43d | 1 | 1.18mi |
| 945 Edgehill Dr Saint Louis, MO | 3.0 | 1.0 | 1110 | $1,575 | $1.42 | 43d | 1 | 1.24mi |
| 10322 Monarch Dr Saint Louis, MO | 3.0 | 2.0 | 1073 | $1,728 | $1.61 | 23d | 1 | 1.27mi |
| 2257 Luxmore Dr Saint Louis, MO | 3.0 | 3.0 | 1073 | $1,495 | $1.39 | 23d | 1 | 1.32mi |
| 227 Meadowcrest Dr Saint Louis, MO | 3.0 | 1.0 | 960 | $1,500 | $1.56 | 43d | 1 | 1.35mi |
| 401 Millman Dr Saint Louis, MO | 3.0 | 1.0 | 1008 | $1,450 | $1.44 | 16d | 1 | 1.36mi |
| 10113 Count Dr Saint Louis, MO | 2.0 | 1.0 | 882 | $775 | $0.88 | 43d | 1 | 1.36mi |
| 10409 Count Dr Saint Louis, MO | 3.0 | 1.0 | 912 | $1,100 | $1.21 | 21d | 1 | 1.38mi |
| 10504 Baron Dr Saint Louis, MO | 3.0 | 1.0 | 1000 | $1,300 | $1.30 | 7d | 1 | 1.38mi |
Listing history 36 events
-
2026-06-18days on market $109,900 Active 108 DOM
-
2026-06-17days on market $109,900 Active 107 DOM
-
2026-06-16days on market $109,900 Active 106 DOM
-
2026-06-15days on market $109,900 Active 105 DOM
-
2026-06-13days on market $109,900 Active 103 DOM
-
2026-06-13days on market $109,900 Active 102 DOM
-
2026-06-10price $109,900 Active 99 DOM
-
2026-06-09days on market $114,900 Active 99 DOM
-
2026-06-08days on market $114,900 Active 98 DOM
-
2026-06-07days on market $114,900 Active 97 DOM
-
2026-06-05days on market $114,900 Active 94 DOM
-
2026-06-03days on market $114,900 Active 93 DOM
-
2026-06-02days on market $114,900 Active 92 DOM
-
2026-06-01days on market $114,900 Active 91 DOM
-
2026-05-31days on market $114,900 Active 90 DOM
-
2026-05-11status Active 847-char remark
Show marketing remark (847 chars)
Welcome to this renovated ranch home in Dellwood! You'll be just steps from Bon Oak Park and Dellwood Rec Center, with quick access to I-270, schools, and all of the shops and restaurants along W. Florissant Avenue. A brick front adds curb appeal and leads you inside to the bright living room with hardwood floors, a dining area, and charming window into the kitchen. You'll have brand new cabinets, counters, and luxury vinyl plank floors. All three bedrooms have hardwood floors, and the bathroom has been updated with new flooring, a tile-surround tub, vanity, lighting, and fixtures. There's plenty of room for storage in the unfinished basement. Enjoy the weather on the large patio overlooking the fenced backyard, shaded by trees. Schedule your showing today! Please note: this home cannot be used as a rental due to Dellwood restrictions.
-
2026-04-23status Pending 847-char remark
Show marketing remark (847 chars)
Welcome to this renovated ranch home in Dellwood! You'll be just steps from Bon Oak Park and Dellwood Rec Center, with quick access to I-270, schools, and all of the shops and restaurants along W. Florissant Avenue. A brick front adds curb appeal and leads you inside to the bright living room with hardwood floors, a dining area, and charming window into the kitchen. You'll have brand new cabinets, counters, and luxury vinyl plank floors. All three bedrooms have hardwood floors, and the bathroom has been updated with new flooring, a tile-surround tub, vanity, lighting, and fixtures. There's plenty of room for storage in the unfinished basement. Enjoy the weather on the large patio overlooking the fenced backyard, shaded by trees. Schedule your showing today! Please note: this home cannot be used as a rental due to Dellwood restrictions.
-
2026-04-09price $114,900 847-char remark
Show marketing remark (847 chars)
Welcome to this renovated ranch home in Dellwood! You'll be just steps from Bon Oak Park and Dellwood Rec Center, with quick access to I-270, schools, and all of the shops and restaurants along W. Florissant Avenue. A brick front adds curb appeal and leads you inside to the bright living room with hardwood floors, a dining area, and charming window into the kitchen. You'll have brand new cabinets, counters, and luxury vinyl plank floors. All three bedrooms have hardwood floors, and the bathroom has been updated with new flooring, a tile-surround tub, vanity, lighting, and fixtures. There's plenty of room for storage in the unfinished basement. Enjoy the weather on the large patio overlooking the fenced backyard, shaded by trees. Schedule your showing today! Please note: this home cannot be used as a rental due to Dellwood restrictions.
-
2026-03-26price $119,900 847-char remark
Show marketing remark (847 chars)
Welcome to this renovated ranch home in Dellwood! You'll be just steps from Bon Oak Park and Dellwood Rec Center, with quick access to I-270, schools, and all of the shops and restaurants along W. Florissant Avenue. A brick front adds curb appeal and leads you inside to the bright living room with hardwood floors, a dining area, and charming window into the kitchen. You'll have brand new cabinets, counters, and luxury vinyl plank floors. All three bedrooms have hardwood floors, and the bathroom has been updated with new flooring, a tile-surround tub, vanity, lighting, and fixtures. There's plenty of room for storage in the unfinished basement. Enjoy the weather on the large patio overlooking the fenced backyard, shaded by trees. Schedule your showing today! Please note: this home cannot be used as a rental due to Dellwood restrictions.
-
2026-02-12$125,000 Active 847-char remark
Show marketing remark (847 chars)
Welcome to this renovated ranch home in Dellwood! You'll be just steps from Bon Oak Park and Dellwood Rec Center, with quick access to I-270, schools, and all of the shops and restaurants along W. Florissant Avenue. A brick front adds curb appeal and leads you inside to the bright living room with hardwood floors, a dining area, and charming window into the kitchen. You'll have brand new cabinets, counters, and luxury vinyl plank floors. All three bedrooms have hardwood floors, and the bathroom has been updated with new flooring, a tile-surround tub, vanity, lighting, and fixtures. There's plenty of room for storage in the unfinished basement. Enjoy the weather on the large patio overlooking the fenced backyard, shaded by trees. Schedule your showing today! Please note: this home cannot be used as a rental due to Dellwood restrictions.
-
2025-07-18status Active
-
2025-07-08historical Active Under Contract
-
2025-06-08price $99,000
-
2025-05-22price $104,900
-
2025-05-07$109,900 Active
-
2025-05-03historical
-
2025-04-01historical
-
2024-12-19historical $1,275
-
2024-12-14$118,950 Active
-
2024-12-03price $1,275
-
2024-11-05$1,495
-
2015-03-13soldstatus $37,500
-
2009-12-30soldstatus $38,500
-
2009-12-30soldstatus $43,500
-
2004-01-08soldstatus $360,000
-
1994-04-22soldstatus
ⓘ Source: listings_history table (triggers on properties + properties_extension) + one-shot
backfill from property_details.listing_events for pre-trigger history.
Tax reassessment forecast MO · Resets to sale price
- Current annual tax
- $1,532 · $128/mo
- Projected year-2 tax
- $1,532 · $128/mo
- Expected delta
- $0/yr ($0/mo · 0.0%)
ⓘ Screening estimate from a state-policy table — verify with the county assessor before closing.
Climate risk First Street
- Flood 1/10 Low FEMA zone X (unshaded) · 0% chance over 30 yrs
- Wildfire 1/10 Low
- Heat 5/10 Major 7 d/yr ≥106°F today · 21 d/yr by 30 yrs out
- Wind 2/10 Low 100% chance of damaging wind over 30 yrs
- Air quality 3/10 Moderate 3 unhealthy d/yr today · 5 by 30 yrs out
Nearby sold comps map
Loading sold comps map…
Walkable amenities ~0.75 mi
Loading nearby amenities…
Taxation est. · year 1
- Rental income
- $15,974
- − Mortgage interest
- −$6,156
- − Property taxes
- −$1,532
- − Insurance
- −$550
- − Repairs & maintenance
- −$1,278
- − Management
- −$1,278
- − Depreciation
- −$3,197
- Taxable income
- $1,983
- Est. tax owed @ 24.0%
- −$476
- After-tax cash flow
- $3,146/yr
For passive investors: Depreciation is non-cash, so a rental often shows a tax loss while cash-flowing — sheltering income. Rental losses are passive: they offset passive income freely, and up to $25,000/yr can offset ordinary (W-2) income if you actively participate and your MAGI is under $100k (phasing out to $0 by $150k); unused losses carry forward. On sale, claimed depreciation is recaptured at up to 25%, and gains may owe capital-gains tax (a 1031 exchange can defer both). Figures are a year-1 estimate at your 24.0% rate — not tax advice; consult a CPA.
Schools (NCES district)
- District
- Riverview Gardens
- NCES district ID
- 2926670
- Math proficiency
- 2% ▼ -6.00%
- Reading proficiency
- 9% ▼ -6.00%
- Median HH income
- $32,759
- Composite
- 4.22/100
- National rank
- #10058
- State rank
- #324 of 324 in MO
Livability — Dellwood
- Score
- 66/100
- State rank
- #239
- US rank
- #11618
Category grades
Schools grade is shown separately in the Schools card above.
Census & demographics
- Census place
- Dellwood, MO
- County
- Saint Louis County · 888,823 people
- Metro
- St. Louis, MO-IL
- Population (ZIP)
- 40,929
- Household income
- $41,154
- Rent vs Own
- Severe rent burden
- 3085.0
Population outlook (St. Louis County) Hauer SSP2
- Today (2025)
- 1,025,227 people
- By 2030
- 1,028,023 · +0.3%
- By 2040
- 1,020,940 · -0.4%
- By 2050
- 1,007,280 · -1.8%
- By 2075
- 987,277 · -3.7%
- By 2100
- 921,984 · -10.1%
Race, ethnicity, and origin ACS 2023
- Neighborhood character
- Predominantly Black (90%)
- Race & ethnicity
- Black 90% White 5% Two or more races 3%
- Foreign-born
- 1% · Canada
Political lean MEDSL · St. Louis
- 2024 margin
- Strong D (+23.4) · D 60.8% · R 37.4% · Other 1.7%
- 2008→2024 swing
- +3.5pp toward D · 2008: 19.9pp · 2024: 23.4pp
- All cycles
- 2024: D+23.4 2020: D+24.0 2016: D+16.2 2012: D+13.7 2008: D+19.9
Not yet ingested
- Civics
- —
Market trends
- HPI YoY
- ▲ 3.79%
- Current HPI
- 420.28
- Rent YoY
- ▲ 4.97%
- Metro
- St. Louis, MO-IL
- State GDP YoY
- ▲ 1.84%
- F500 in state
- 20
Industry mix (Fortune 500 HQ in MO)
| Industry | F500 HQs | Revenue |
|---|---|---|
| Healthcare | 1 | $163B |
|
||
| Insurance | 1 | $21B |
|
||
| Industrial Technology | 1 | $17B |
|
||
| Retail | 1 | $16B |
|
||
| Industrial Distribution | 1 | $10B |
|
||
| Utilities | 1 | $9B |
|
||
Price history
-68.1% since first listed21 events — show timeline
- 2026-05-11 Relisted — MARIS as Distributed by MLS Grid
- 2026-04-23 Pending — MARIS as Distributed by MLS Grid
- 2026-04-09 Price Changed $114,900 MARIS as Distributed by MLS Grid
- 2026-03-26 Price Changed $119,900 MARIS as Distributed by MLS Grid
- 2026-02-12 Listed $125,000 MARIS as Distributed by MLS Grid
- 2025-07-18 Relisted — MARIS as Distributed by MLS Grid
- 2025-07-08 Contingent — MARIS as Distributed by MLS Grid
- 2025-06-08 Price Changed $99,000 MARIS as Distributed by MLS Grid
- 2025-05-22 Price Changed $104,900 MARIS as Distributed by MLS Grid
- 2025-05-07 Listed $109,900 MARIS as Distributed by MLS Grid
- 2025-05-03 Coming Soon — MARIS as Distributed by MLS Grid
- 2025-04-01 Delisted — MARIS as Distributed by MLS Grid
- 2024-12-19 Rental Removed $1,275 RENT.
- 2024-12-14 Listed $118,950 MARIS as Distributed by MLS Grid
- 2024-12-03 Price Changed $1,275 RENT.
- 2024-11-05 Listed for Rent $1,495 RENT.
- 2015-03-13 Sold (Public Records) $37,500 Public Records
- 2009-12-30 Sold (Public Records) $43,500 Public Records
- 2009-12-30 Sold (Public Records) $38,500 Public Records
- 2004-01-08 Sold (Public Records) $360,000 Public Records
- 1994-04-22 Sold (Public Records) — Public Records
Property tax history
+0.9%/yrLatest (2022): $1,532 · +0.4% YoY. Source: county tax records.
Cash-flow waterfall
monthlySold comps — $/sqft
last 12 mo · ≤1 miLoading sold comps…