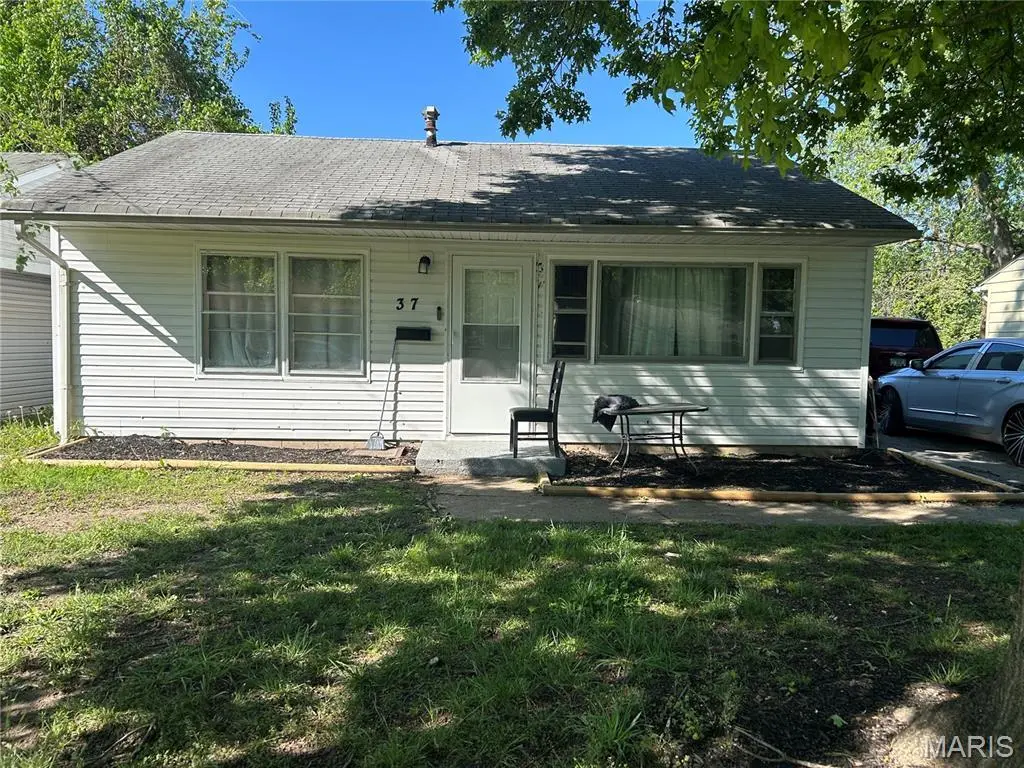
37 Louise Ln · Cahokia Heights, IL
Flood risk 1/10 · Minimal
- FEMA flood zone
- X (shaded)
- Chance of flooding over 30 yrs
- 0.0%
- Est. flood insurance / yr
- $507 – $1,088
Fire risk 1/10 · Minimal
- Est. fire insurance / yr
- $804 – $1,492
Heat risk 5/10 · Moderate
- Hot days now (above 107°F)
- 7 days/yr
- Hot days in 30 yrs
- 21 days/yr
Wind risk 2/10 · Minimal
- Chance of severe wind over 30 yrs
- 1.0%
Air-quality risk 3/10 · Minor
- Unhealthy air days now
- 3 days/yr
- Unhealthy air days in 30 yrs
- 4 days/yr
Risk factors via First Street. Map © Google.
Why this score? — see what drove the C- grade
The composite is a weighted blend of 9 inputs, each scored 0–100. Each bar is that input's sub-score; the figure is the points it added to the 100-point composite (weight × sub-score).
- Cash flow +28.2/30.0
- DSCR +10.0/10.0
- 1% rule +7.6/10.0
- Rent growth +2.5/5.0
- Livability +2.5/5.0
- Condition / age +2.5/5.0
- Schools +0.6/10.0
- ARV discount +0.0/15.0
- Appreciation +0.0/10.0
$105,000
🖨 Deal sheet (PDF) 📄 Offer letter ✓ Due diligence
Listing remarks
3 bedroom 1.5 bath home. Tenanted Property The following updates have been made recently: Updated landscaping, fence line cleaned up, new flooring in the living room, hallway, kitchen and laundry room. Repainted the kitchen cabinets. Full bath received a brand new renovation with the following upgrades, new floors, fixtures, vanity, mirror and tub glazed. This property was tenant occupied therefore we could not include interior photos. Add this to your portfolio today. Close to Shopping Areas, Schools, Public Transportation and Interstate Highways. This is a Must See!!!!! Buyer to verify all Listing data including but not limited to sq. ft. , measurements, features, lot size, taxes/exempti
Key facts
- 6,098 sq ft lot
- Built 1955
Neighborhood map
What this means for you Summary
Snapshot
- This is a 3-bed/3.0-bath single-family listed at $105k.
Deal economics
- At list price, monthly cash flow is $333 ($4k/yr) — positive.
- The deal already cash-flows at list — no discount required.
- Meets the 1% rule at list price ($1k rent vs $105k).
- Cap rate 10.1% vs local median 13.6% in Cahokia Heights — below-typical yield; the buyer is paying a premium for something (appreciation thesis, condition, location) that the cap rate doesn't capture.
Location & tenants
- Location reads: area grade C — affects rentability + tenant quality, not the cash-flow math above.
- Cahokia CUSD 187 (suburban): math 3% / reading 5% proficiency, ranked #864 of 919 in IL (top 94%) — low school quality limits family demand, transient renter base, plan for 1-2y turnover; 85% free/reduced lunch — lower-income household profile, screen leases tightly.
- Zoned schools: Cahokia High School (math 8% / reading 2%, grade F, #614 of 693 statewide, top 95%, 845 students, 0% FRL) — zoned schools average 0% FRL vs 85% district-wide (85 pts lower); this property's tenant base skews higher-income than the district average.
- Market conditions: 153 active listings in the ZIP; 18 comparable units currently listed for rent nearby; rentals at typical pace (median 23d on market — plan ~3-4 weeks tenant-placement turnaround); lower-income renter base — watch delinquency; 783 units permitted in St. Clair County in 2024 (378 in 5+ unit buildings).
- At $1,328/mo this rent would consume 47% of the median local household income ($34k/yr) (locally 729% of renters already pay >50% of income on rent) — very limited rent-growth headroom before tenants either downsize or default.
Forward outlook
- Local home prices are declining (-3.0%/yr); year-one equity from $726 of loan paydown is wiped out by about $3k of value loss. Plan a longer hold.
- St. Clair County population projected at -23% by 2050 — secular population decline; favor cash flow + early exit over multi-decade hold.
- At projected returns (-3.0% appreciation + 3.0% rent growth), your $29k cash investment doubles in ~9 years — after that, you're playing with house money.
Negotiation context
- Only 0 days on market — expect competitive offers; lowballing is unlikely to land.
Risks & watch-outs
- Watch-outs: built in 1955 — expect roof / HVAC / electrical / plumbing capex.
- Climate carrying-cost: extreme-heat days projected 7→21/yr by 2055 (HVAC capex compounding) — expect insurance premiums to compound above CPI over the hold.
Questions for the listing agent
- Built in 1955 — when were the roof, HVAC, electrical panel, plumbing, and water heater last replaced?
- Is there a deadline driving the sale (1031 exchange, divorce, estate, relocation)? That informs how much negotiation room exists.
- What's the average days-on-market for RENTAL listings here right now (not sales)? A rising rental-DOM trend means longer vacancies and softer asking-rent achievability than the comps imply.
- What's the recent tenant-quality profile in this submarket — average credit score on applications, eviction rate, late-payment / NSF rate, and stable-employment percentage? A property-management company in the area should have these aggregated.
- How much new for-sale + rental construction is in the pipeline within 1–3 miles? Heavy new supply typically softens prices + rents 12–24 months out; constrained supply supports both.
Investment metrics
- 1% rule
- 1.26% ✓
- Cap rate
- 10.10%
- Cash-on-cash
- 13.59%
- DSCR
- 1.60
- GRM
- 6.6
CMA / ARV
- ARV (on-the-fly)
- $87,216
- Comps found
- 12
Show comp detail 12 sales within ~0.75 mi
| Address | Dist | Beds/Ba | Sqft | Sold | Price | $/sf | Match |
|---|---|---|---|---|---|---|---|
| 37 Louise Ln | 0.00mi | 3/1.5 | 1,104 (0%) | 0mo | $105,000 | $95 | 94 |
| 1 Helen Ct | 0.17mi | 3/1.0 | 1,116 (+1%) | 2mo | $105,000 | $94 | 80 |
| 20 Goodman Rd | 0.09mi | 4/2.0 (+1) | 1,104 (0%) | 14mo | $87,000 | $79 | 75 |
| 34 Louise Ln | 0.04mi | 3/1.0 | 1,072 (-3%) | 14mo | $69,000 | $64 | 73 |
| 3 Dora Dr | 0.18mi | 4/1.0 (+1) | 1,158 (+5%) | 5mo | $110,000 | $95 | 66 |
| 13 Marilyn Ln | 0.08mi | 3/1.0 | 995 (-10%) | 14mo | $11,000 | $11 | 60 |
| 2 Margie Dr | 0.55mi | 4/2.0 (+1) | 1,152 (+4%) | 8mo | $110,000 | $95 | 52 |
| 21 Westwood Dr | 0.54mi | 4/1.0 (+1) | 1,100 (-0%) | 12mo | $56,000 | $51 | 51 |
| 38 Westwood Dr | 0.55mi | 4/1.0 (+1) | 1,225 (+11%) | 2mo | $90,000 | $73 | 41 |
| 11 Westwood Dr | 0.53mi | 4/1.0 (+1) | 1,225 (+11%) | 6mo | $110,000 | $90 | 39 |
| 43 Drexel Dr | 0.51mi | 4/1.0 (+1) | 1,225 (+11%) | 8mo | $90,000 | $73 | 38 |
| 2350 Lorraine Dr | 0.55mi | 3/1.5 | 966 (-12%) | 11mo | $69,900 | $72 | 38 |
Match score weights: distance 35% · size 25% · config 20% · recency 20%. Top-matched comps best support the ARV.
Projected returns pro-forma
-3.0% appreciation · 3.0% rent growth · sell at horizon
- IRR
- 3.7%
- Equity multiple
- 1.14×
- Total profit
- $4,207
- Equity at exit
- $15,656
- IRR
- 13.2%
- Equity multiple
- 2.06×
- Total profit
- $31,028
- Equity at exit
- $9,078
Cash invested: $29,400 (down + closing). Projections, not guarantees.
Landlord ↔ Tenant lean methodology
- Overall (STATE)
- 43 Moderately Tenant-Leaning
- State Illinois
- 43 Moderately Tenant-Leaning · D+7
- County
- — inherits STATE
- City
- — inherits STATE
ZIP-level market 62206
- Home prices YoY
- -20.2%
- Active inventory
- 153
- Price-to-rent
- 6.6×
Monthly cashflow live
- Estimated rent
- $1,328 high interval (Pro) →
- Mortgage (P&I)
- −$551
- Tax from tax record
- −$121 /mo · $1,457/yr
- Insurance
- −$44
- HOA
- −$0
- Vacancy / Maint / Mgmt
- −$279
- Net cashflow
- $333
Break-even live
Sensitivity live
| Price | -10% $392 | -5% $363 | +0% $333 | +5% $303 | +10% $274 |
|---|---|---|---|---|---|
| Rent | -10% $228 | -5% $281 | +0% $333 | +5% $385 | +10% $438 |
| Rate | -1.0pp $386 | -0.5pp $360 | base $333 | +0.5pp $306 | +1.0pp $278 |
UW: 25.0% down · 7.5% · 30yr · 1.5% tax · 5.0% vac · 8.0% maint · 8.0% mgmt
Financing live
Cash to close
- Down payment
- $26,250
- Closing costs
- $3,150
- Reserves months
- —
- Total cash needed
- —
Loan-product check · same deal, 3 products live
Conventional
25% down · 7.5% · 30yr
- Down + closing
- —
- Monthly P&I
- —
- Monthly cashflow
- —
- DSCR
- —
- Eligible?
- —
Personal DTI + credit; lowest rate.
DSCR
20% down · 8.5% · 30yr
- Down + closing
- —
- Monthly P&I
- —
- Monthly cashflow
- —
- DSCR
- —
- Eligible?
- —
No personal income docs; deal must DSCR.
Hard money
10% down · 12.0% · 12mo
- Down + closing
- —
- Monthly P&I
- —
- Monthly cashflow
- —
- DSCR
- —
- Eligible?
- —
Short-term bridge; refi at stabilization.
Rent comps 18 comps
| Address | Beds | Baths | Sqft | Rent | $/sqft | DOM | Units | Dist |
|---|---|---|---|---|---|---|---|---|
| 13 Marilyn Ln East Saint Louis, IL | 3.0 | 1.0 | 995 | $1,150 | $1.16 | 44d | 1 | 0.05mi |
| 8 Louise Ln East Saint Louis, IL | 3.0 | 1.0 | 1150 | $1,275 | $1.11 | 17d | 1 | 0.17mi |
| 6 Delores Dr East Saint Louis, IL | 3.0 | 1.0 | 864 | $1,300 | $1.50 | 24d | 1 | 0.26mi |
| 6 Delores Dr East Saint Louis, IL | 3.0 | 1.0 | 864 | $1,300 | $1.50 | 13d | 1 | 0.26mi |
| 21 Agnes Dr Cahokia, IL | 3.0 | 1.0 | 864 | $1,050 | $1.22 | 22d | 1 | 0.28mi |
| 2231 Loren St Cahokia Heights, IL | 2.0 | 1.0 | 1000 | $1,195 | $1.20 | 45d | 1 | 0.34mi |
| 32 Drexel Dr East Saint Louis, IL | 4.0 | 1.0 | 1362 | $1,675 | $1.23 | 16d | 1 | 0.41mi |
| 2 E Adams Dr East Saint Louis, IL | 3.0 | 1.0 | 925 | $885 | $0.96 | 44d | 1 | 0.42mi |
| 13 Drexel Dr East Saint Louis, IL | 3.0 | 1.0 | 925 | $995 | $1.08 | 13d | 1 | 0.43mi |
| 70 W Adams Dr East Saint Louis, IL | 3.0 | 1.0 | 925 | $1,200 | $1.30 | 44d | 1 | 0.57mi |
| 2116 Doris Ave Cahokia Heights, IL | 3.0 | 1.0 | 880 | $1,400 | $1.59 | 22d | 1 | 0.77mi |
| 2008 Delores St East Saint Louis, IL | 3.0 | 1.0 | 925 | $1,250 | $1.35 | 5d | 1 | 1.09mi |
| 1808 Mullens Ave Cahokia Heights, IL | 3.0 | 1.0 | 992 | $1,500 | $1.51 | 3d | 1 | 1.22mi |
| 1713 Loretta Ave East Saint Louis, IL | 3.0 | 1.0 | 944 | $1,095 | $1.16 | 44d | 1 | 1.35mi |
| 1716 # E Unit Loretta Ave unit East St Louis, IL | 2.0 | 1.0 | 720 | $1,000 | $1.39 | 44d | 1 | 1.35mi |
| 1420 Williams St East Saint Louis, IL | 4.0 | 1.0 | 1300 | $1,500 | $1.15 | 44d | 1 | 1.46mi |
| 1421 Richard Dr East Saint Louis, IL | 3.0 | 1.0 | 936 | $1,100 | $1.18 | 2d | 1 | 1.47mi |
| 1417 Richard Dr East Saint Louis, IL | 3.0 | 1.0 | 936 | $1,400 | $1.50 | 22d | 1 | 1.49mi |
Listing history 3 events
-
2026-05-13$105,000
-
2026-05-13historical
-
2025-12-18soldstatus $500,000
ⓘ Source: listings_history table (triggers on properties + properties_extension) + one-shot
backfill from property_details.listing_events for pre-trigger history.
Tax reassessment forecast IL · Partial reset (capped growth)
- Current annual tax
- $1,457 · $121/mo
- Projected year-2 tax
- $1,920 · $160/mo
- Expected delta
- +$463/yr (+$39/mo · 31.8%)
ⓘ Screening estimate from a state-policy table — verify with the county assessor before closing.
Climate risk First Street
- Flood 1/10 Low FEMA zone X (shaded) · 0% chance over 30 yrs
- Wildfire 1/10 Low
- Heat 5/10 Major 7 d/yr ≥107°F today · 21 d/yr by 30 yrs out
- Wind 2/10 Low 100% chance of damaging wind over 30 yrs
- Air quality 3/10 Moderate 3 unhealthy d/yr today · 4 by 30 yrs out
Nearby sold comps map
Loading sold comps map…
Walkable amenities ~0.75 mi
Loading nearby amenities…
Taxation est. · year 1
- Rental income
- $15,931
- − Mortgage interest
- −$5,882
- − Property taxes
- −$1,457
- − Insurance
- −$525
- − Repairs & maintenance
- −$1,274
- − Management
- −$1,274
- − Depreciation
- −$3,055
- Taxable income
- $2,464
- Est. tax owed @ 24.0%
- −$591
- After-tax cash flow
- $3,404/yr
For passive investors: Depreciation is non-cash, so a rental often shows a tax loss while cash-flowing — sheltering income. Rental losses are passive: they offset passive income freely, and up to $25,000/yr can offset ordinary (W-2) income if you actively participate and your MAGI is under $100k (phasing out to $0 by $150k); unused losses carry forward. On sale, claimed depreciation is recaptured at up to 25%, and gains may owe capital-gains tax (a 1031 exchange can defer both). Figures are a year-1 estimate at your 24.0% rate — not tax advice; consult a CPA.
Schools (NCES district)
- District
- Cahokia CUSD 187
- NCES district ID
- 1708040
- Math proficiency
- 3% ▼ -2.00%
- Reading proficiency
- 5% ▬ 0.00%
- Median HH income
- $28,028
- Composite
- 6.44/100
- National rank
- #14827
- State rank
- #864 of 919 in IL
Livability — Cahokia Heights
No livability data for this city. (Only ~50 U.S. cities are tracked.)
Census & demographics
- Census place
- Cahokia Heights, IL
- County
- Saint Clair County · 169,691 people
- City population
- 19,956
- Metro
- St. Louis, MO-IL
- Population (ZIP)
- 12,959
- Household income
- $33,838
- Rent vs Own
- Severe rent burden
- 729.0
Population outlook (St. Clair County) Hauer SSP2
- Today (2025)
- 250,366 people
- By 2030
- 240,511 · -3.9%
- By 2040
- 217,391 · -13.2%
- By 2050
- 192,699 · -23.0%
- By 2075
- 140,637 · -43.8%
- By 2100
- 100,499 · -59.9%
Race, ethnicity, and origin ACS 2023
- Neighborhood character
- Diverse neighborhood (Simpson 0.56)
- Race & ethnicity
- Black 59% White 29% Two or more races 6% Hispanic / Latino 3% Asian 2%
- Common ancestry
- Romanian 2% Lithuanian 1% Iranian 1%
- Foreign-born
- 2% · China
- Languages at home
- 95% English-only · Spanish 3% Other Indo-European 1% Chinese 1%
Political lean MEDSL · St. Clair
- 2024 margin
- Lean D (+7.9) · D 53.0% · R 45.1% · Other 1.8%
- 2008→2024 swing
- -14.6pp toward R · 2008: 22.4pp · 2024: 7.9pp
- All cycles
- 2024: D+7.9 2020: D+8.7 2016: D+5.6 2012: D+14.5 2008: D+22.4
Not yet ingested
- Civics
- —
Market trends
- HPI YoY
- ▼ -33.26%
- Current HPI
- 131.5144
- Rent YoY
- —
- Metro
- St. Louis, MO-IL
- State GDP YoY
- ▲ 1.59%
- F500 in state
- 60
Industry mix (Fortune 500 HQ in IL)
| Industry | F500 HQs | Revenue |
|---|---|---|
| Insurance | 4 | $201B |
|
||
| Consumer Goods | 4 | $87B |
|
||
| Industrial Machinery | 3 | $64B |
|
||
| Healthcare | 2 | $55B |
|
||
| Retail / Pharmacy | 1 | $148B |
|
||
| Agriculture / Food | 1 | $86B |
|
||
Price history
-79.0% since first listed3 events — show timeline
- 2026-05-13 Delisted — MARIS as Distributed by MLS Grid
- 2026-05-13 Listed $105,000 MARIS as Distributed by MLS Grid
- 2025-12-18 Sold (Public Records) $500,000 Public Records
Property tax history
-0.8%/yrLatest (2024): $1,457 · +10.8% YoY. Source: county tax records.
Cash-flow waterfall
monthlySold comps — $/sqft
last 12 mo · ≤1 miLoading sold comps…