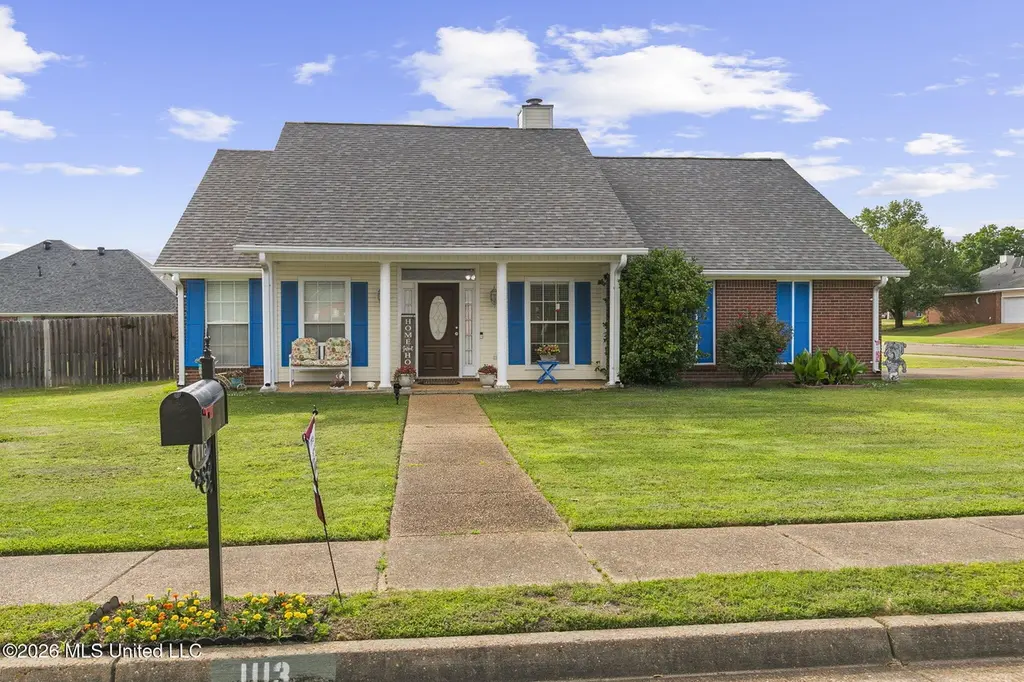
1113 Orchardview Cv · Brandon, MS
Flood risk 1/10 · Minimal
- FEMA flood zone
- X (unshaded)
- Chance of flooding over 30 yrs
- 0.0%
- Est. flood insurance / yr
- $507 – $1,088
Fire risk 4/10 · Minor
- Est. fire insurance / yr
- $1,241 – $2,305
Heat risk 7/10 · Major
- Hot days now (above 109°F)
- 7 days/yr
- Hot days in 30 yrs
- 20 days/yr
Wind risk 8/10 · Major
- Chance of severe wind over 30 yrs
- 80.0%
Air-quality risk 2/10 · Minimal
- Unhealthy air days now
- 1 days/yr
- Unhealthy air days in 30 yrs
- 1 days/yr
Risk factors via First Street. Map © Google.
Why this score? — see what drove the D grade
The composite is a weighted blend of 9 inputs, each scored 0–100. Each bar is that input's sub-score; the figure is the points it added to the 100-point composite (weight × sub-score).
- Cash flow +12.6/30.0
- ARV discount +6.2/15.0
- Schools +4.6/10.0
- Rent growth +4.3/5.0
- Livability +4.0/5.0
- DSCR +3.8/10.0
- Condition / age +2.5/5.0
- 1% rule +2.4/10.0
- Appreciation +0.0/10.0
$274,900
🖨 Deal sheet 📄 Offer letter ✓ Due diligence
Listing remarks MLS
Mint condition 3/2 split plan with ceramic tile in kit, dining and baths, informal plan, huge fenced back yard ideal for the kids or pool owner are moving, tasteful wallpaper,blinds remain, small dog usually in laundry room, easy to show, one of the most spacious homes in the neighborhood, on cul-de-sac
Key facts
- Electric range
- Built in microwave
- Cul-de-sac
Tags
Property features AI
Finance
- Other: Property listed as move-in ready; Located at 1113 Orchardview Cove, corner lot
- HOA & community: Annual association fee of $150 (includes grounds maintenance); Community features include biking and hiking/walking trails, boating, fishing, horse trails, park, nearby restaurants and entertainment
Exterior
- Parking: Attached 2-car garage with garage door opener; garage faces side; Paved parking
- Security: Security system; Smoke detectors
- Utilities: Public water; Public sewer; Electricity connected; Natural gas connected; Cable connected
- Home design: Single-family house; One level; Move-in ready
- Construction: Brick construction; Asphalt shingle roof; Slab foundation; Built in public records year
- Exterior features: Covered courtyard; Patio; Rear porch; Pergola; Portable building; Exterior lighting; Wood fencing; Landscaped corner lot; Rectangular lot
Interior
- Kitchen: Dishwasher; Disposal; Free-standing electric oven and range; Refrigerator; Microwave; Range hood; Granite counters
- Flooring: Luxury vinyl; Carpet; Ceramic tile
- Bathrooms: 2 full bathrooms
- Heating & cooling: Central heating (natural gas); Central air conditioning
- Interior features: Breakfast bar; Ceiling fans; Crown molding; Double vanity; Granite counters; Tray ceilings; Walk-in closets; Gas log fireplace in the living room; Aluminum-framed windows with blinds, screens and shutters; Metal insulated doors
- Laundry & utility: Washer hookup; Electric dryer hookup; Gas water heater
Neighborhood map
What this means for you Summary
Snapshot
- This is a 3-bed/2.0-bath single-family listed at $275k.
Deal economics
- At list price, monthly cash flow is $-35 ($-415/yr) — negative.
- To cash-flow at today's rent, offer at most $269k (2.2% below list).
- To meet the 1% rule (rent ≥ 1% of price), the offer needs to be $203k (26.2% below list).
- Recommended offer: $203k (26.2% below list) — sets the bar for 1% rule.
- Cap rate 6.1% vs local median 4.2% in Brandon — top-decile yield for the area; either an underpriced asset or a hidden risk that comps aren't pricing in. Stress-test before assuming the spread holds.
Location & tenants
- Location reads 81/100 on livability (#3 in MS, #1,514 nationally) — a professional / high-income tenant draw. Strengths: crime A+, employment A+, cost of living A+; Watch: amenities F, commute F.
- Rankin County School District (rural): math 56% / reading 48% proficiency, ranked #6 of 130 in MS (top 5%) — acceptable for families but not a draw, mixed tenant base, ~2y average lease.
- Zoned schools: Brandon Elementary School (math 69% / reading 65%, grade B+, #11 of 375 statewide, top 3%, 741 students, 100% FRL); Brandon Middle School (math 67% / reading 49%, grade B, #11 of 179 statewide, top 6%, 1,193 students, 100% FRL); Brandon High School (math 47% / reading 49%, grade D, #27 of 197 statewide, top 13%, 1,648 students, 100% FRL) — zoned schools average 100% FRL vs 35% district-wide (65 pts higher); higher-poverty schools than district average — tighter screening recommended.
- Market conditions: Rents rising fast (+7.1%/yr); 302 active listings in the ZIP; 4 comparable units currently listed for rent nearby; rentals leasing fast (median 14d on market — plan ~1-2 weeks tenant-placement turnaround); solid renter incomes; 343 units permitted in Rankin County in 2024 (0 in 5+ unit buildings).
Forward outlook
- Local home prices are declining (-3.0%/yr); year-one equity from $2k of loan paydown is wiped out by about $8k of value loss. Plan a longer hold.
- Rankin County population projected at +17% by 2050 — long-run rental-demand tailwind backs the buy-and-hold thesis.
Negotiation context
- It's been on market 18 days — a 2% lower offer ($271k) is reasonable based on typical stale-listing flexibility.
- 2 sale attempts since 25y ago; this cycle's ask is 4% above the opening price — seller raised mid-cycle; expect resistance to lowballs.
Risks & watch-outs
- Climate carrying-cost: severe wind risk, 80% chance of damaging wind over 30y; extreme-heat days projected 7→20/yr by 2055 (HVAC capex compounding) — expect insurance premiums to compound above CPI over the hold.
Questions for the listing agent
- What do current leases actually rent for vs. the listed asking? Can we see a recent rent roll and the last 12 months of T-12 income?
- What does the HOA fee cover, when was the last increase, and are there any pending special assessments or reserve-fund shortfalls?
- Is there a deadline driving the sale (1031 exchange, divorce, estate, relocation)? That informs how much negotiation room exists.
- Schools are A-rated — typically a magnet for longer-tenancy family renters. What's the average tenant stay here, and is there a school-zone premium baked into asking?
- The area grade is low — what's the realistic commute time and amenity access for the typical tenant pool here? Any planned neighborhood developments (good or bad) we should know about?
- What's the average days-on-market for RENTAL listings here right now (not sales)? A rising rental-DOM trend means longer vacancies and softer asking-rent achievability than the comps imply.
- What's the recent tenant-quality profile in this submarket — average credit score on applications, eviction rate, late-payment / NSF rate, and stable-employment percentage? A property-management company in the area should have these aggregated.
- How much new for-sale + rental construction is in the pipeline within 1–3 miles? Heavy new supply typically softens prices + rents 12–24 months out; constrained supply supports both.
Investment metrics
- 1% rule
- 0.74% ✗
- Cap rate
- 6.14%
- Cash-on-cash
- -0.54%
- DSCR
- 0.98
- GRM
- 11.3
CMA / ARV
- ARV (median comp)
- $267,363
- List price
- $274,900
- Delta
- 2.82%
- Verdict
- FAIR
- Comps
- 20 within 1.0 mi
Show comp detail 12 sales within ~0.75 mi
| Address | Dist | Beds/Ba | Sqft | Sold | Price | $/sf | Match |
|---|---|---|---|---|---|---|---|
| 1113 Orchardview Cv | 0.00mi | 3/2.0 | 1,603 (+0%) | 0mo | $274,900 | $171 | 100 |
| 300 Peachtree St | 0.13mi | 3/2.0 | 1,610 (+0%) | 1mo | $272,900 | $170 | 92 |
| 505 Stuart Xing | 0.51mi | 3/2.0 | 1,608 (+0%) | 0mo | $264,000 | $164 | 75 |
| 305 Peachtree St | 0.18mi | 3/2.0 | 1,687 (+5%) | 10mo | $261,485 | $155 | 74 |
| 452 Pecan Cir | 0.50mi | 3/2.0 | 1,593 (-1%) | 10mo | $264,900 | $166 | 68 |
| 434 Pecan Cir | 0.36mi | 3/2.0 | 1,442 (-10%) | 0mo | $255,000 | $177 | 66 |
| 550 Pecan Blvd | 0.39mi | 3/2.0 | 1,450 (-10%) | 3mo | $245,000 | $169 | 63 |
| 614 Spencer Dr | 0.53mi | 3/2.0 | 1,485 (-7%) | 1mo | $245,000 | $165 | 62 |
| 429 Pecan Cir | 0.38mi | 3/2.0 | 1,465 (-9%) | 12mo | $220,000 | $150 | 58 |
| 2017 Rolling Hill Dr | 0.68mi | 3/2.0 | 1,515 (-5%) | 3mo | $243,000 | $160 | 57 |
| 0 Pecan Cir | 0.53mi | 4/2.0 (+1) | 1,706 (+6%) | 9mo | $314,900 | $185 | 52 |
| 116 Pavilion Dr | 0.66mi | 2/2.0 (-1) | 1,512 (-6%) | 7mo | $229,900 | $152 | 49 |
Match score weights: distance 35% · size 25% · config 20% · recency 20%. Top-matched comps best support the ARV.
Projected returns pro-forma
-3.0% appreciation · 7.13% rent growth · sell at horizon
- IRR
- -13.3%
- Equity multiple
- 0.50×
- Total profit
- $-38,104
- Equity at exit
- $40,988
- IRR
- 0.4%
- Equity multiple
- 1.03×
- Total profit
- $2,672
- Equity at exit
- $23,768
Cash invested: $76,972 (down + closing). Projections, not guarantees.
Landlord ↔ Tenant lean methodology
- Overall (STATE)
- 90 Strongly Landlord-Friendly
- State Mississippi
- 90 Strongly Landlord-Friendly · R+11
- County
- — inherits STATE
- City
- — inherits STATE
ZIP-level market 39042
- Home prices YoY
- -34.3%
- Rents YoY
- 7.1%
- Active inventory
- 302
- Price-to-rent
- 11.3×
Monthly cashflow live
- Estimated rent
- $2,028 medium interval (Pro) →
- Mortgage (P&I)
- −$1,442
- Tax from tax record
- −$68 /mo · $811/yr
- Insurance
- −$115
- HOA
- −$13
- Vacancy / Maint / Mgmt
- −$426
- Net cashflow
- $-35
Break-even live
UW: 25.0% down · 7.5% · 30yr · 1.5% tax · 5.0% vac · 8.0% maint · 8.0% mgmt
Financing live
Cash to close
- Down payment
- $68,725
- Closing costs
- $8,247
- Reserves months
- —
- Total cash needed
- —
Loan-product check · same deal, 3 products live
Conventional
25% down · 7.5% · 30yr
- Down + closing
- —
- Monthly P&I
- —
- Monthly cashflow
- —
- DSCR
- —
- Eligible?
- —
Personal DTI + credit; lowest rate.
DSCR
20% down · 8.5% · 30yr
- Down + closing
- —
- Monthly P&I
- —
- Monthly cashflow
- —
- DSCR
- —
- Eligible?
- —
No personal income docs; deal must DSCR.
Hard money
10% down · 12.0% · 12mo
- Down + closing
- —
- Monthly P&I
- —
- Monthly cashflow
- —
- DSCR
- —
- Eligible?
- —
Short-term bridge; refi at stabilization.
Rent comps 4 comps
| Address | Beds | Baths | Sqft | Rent | $/sqft | DOM | Units | Dist |
|---|---|---|---|---|---|---|---|---|
| 1290 W Government St Brandon, MS | 1.0–3.0 | 1.0–2.0 | 1129 | $1,915 | $1.70 | 13d | 27 | 0.79mi |
| 31 Pebble Hill Dr Brandon, MS | 4.0 | 2.0 | 1531 | $1,950 | $1.27 | 13d | 1 | 1.13mi |
| 7 Sandway Dr Brandon, MS | 3.0 | 2.0 | 1985 | $2,156 | $1.09 | 43d | 1 | 1.15mi |
| 77 Fern Valley Rd Brandon, MS | 3.0 | 2.0 | 1585 | $1,800 | $1.14 | 13d | 1 | 1.42mi |
HOA detail
- Monthly dues
- $13 · $156/yr
- Likely covers
- pool
Listing history 5 events
-
2026-05-12status Pending 616-char remark
-
2026-05-05price $274,900 616-char remark
-
2026-04-24$264,900 Active 616-char remark
-
2002-07-02soldstatus 304-char remark
Show marketing remark (304 chars)
Mint condition 3/2 split plan with ceramic tile in kit, dining and baths, informal plan, huge fenced back yard ideal for the kids or pool owner are moving, tasteful wallpaper,blinds remain, small dog usually in laundry room, easy to show, one of the most spacious homes in the neighborhood, on cul-de-sac
-
2001-12-01$126,900 304-char remark
Show marketing remark (304 chars)
Mint condition 3/2 split plan with ceramic tile in kit, dining and baths, informal plan, huge fenced back yard ideal for the kids or pool owner are moving, tasteful wallpaper,blinds remain, small dog usually in laundry room, easy to show, one of the most spacious homes in the neighborhood, on cul-de-sac
ⓘ Source: listings_history table (triggers on properties + properties_extension) + one-shot
backfill from property_details.listing_events for pre-trigger history.
Tax reassessment forecast MS · Resets to sale price
- Current annual tax
- $811 · $68/mo
- Projected year-2 tax
- $2,172 · $181/mo
- Expected delta
- +$1,361/yr (+$113/mo · 167.8%)
ⓘ Screening estimate from a state-policy table — verify with the county assessor before closing.
Climate risk First Street
- Flood 1/10 Low FEMA zone X (unshaded) · 0% chance over 30 yrs
- Wildfire 4/10 Moderate
- Heat 7/10 Severe 7 d/yr ≥109°F today · 20 d/yr by 30 yrs out
- Wind 8/10 Severe 80% chance of damaging wind over 30 yrs
- Air quality 2/10 Low 1 unhealthy d/yr today · 1 by 30 yrs out
Nearby sold comps map
Loading sold comps map…
Walkable amenities ~0.75 mi
Loading nearby amenities…
Taxation est. · year 1
- Rental income
- $24,336
- − Mortgage interest
- −$15,399
- − Property taxes
- −$811
- − Insurance
- −$1,374
- − Repairs & maintenance
- −$1,947
- − Management
- −$1,947
- − HOA
- −$156
- − Depreciation
- −$7,997
- Taxable loss
- −$5,295
- Est. tax savings @ 24.0%
- +$1,271
- After-tax cash flow
- $856/yr
For passive investors: Depreciation is non-cash, so a rental often shows a tax loss while cash-flowing — sheltering income. Rental losses are passive: they offset passive income freely, and up to $25,000/yr can offset ordinary (W-2) income if you actively participate and your MAGI is under $100k (phasing out to $0 by $150k); unused losses carry forward. On sale, claimed depreciation is recaptured at up to 25%, and gains may owe capital-gains tax (a 1031 exchange can defer both). Figures are a year-1 estimate at your 24.0% rate — not tax advice; consult a CPA.
Schools (NCES district)
- District
- Rankin County School District
- NCES district ID
- 2803830
- Math proficiency
- 56% ▼ -4.00%
- Reading proficiency
- 48% ▼ -6.00%
- Median HH income
- $61,867
- Composite
- 45.62/100
- National rank
- #2587
- State rank
- #6 of 130 in MS
Livability — Brandon
- Score
- 81/100
- State rank
- #3
- US rank
- #1514
Category grades
Schools grade is shown separately in the Schools card above.
Census & demographics
- Census place
- Brandon, MS
- County
- Rankin County · 123,614 people
- City population
- 79,950
- Metro
- Jackson, MS
- Population (ZIP)
- 39,142
- Household income
- $88,597
- Rent vs Own
- Severe rent burden
- 474.0
Population outlook (Rankin County) Hauer SSP2
- Today (2025)
- 164,317 people
- By 2030
- 171,013 · +4.1%
- By 2040
- 182,723 · +11.2%
- By 2050
- 192,376 · +17.1%
- By 2075
- 209,535 · +27.5%
- By 2100
- 209,534 · +27.5%
Race, ethnicity, and origin ACS 2023
- Neighborhood character
- Predominantly White (75%)
- Race & ethnicity
- White 75% Black 21% Hispanic / Latino 2% Two or more races 2%
- Common ancestry
- Italian 5% Slovak 2% Iranian 2%
- Foreign-born
- 2% · Canada
- Languages at home
- 97% English-only · Spanish 2%
Political lean MEDSL · Rankin
- 2024 margin
- Solid R (+47.1) · D 25.9% · R 73.0% · Other 1.0%
- 2008→2024 swing
- +6.4pp toward D · 2008: -53.5pp · 2024: -47.1pp
- All cycles
- 2024: R+47.1 2020: R+45.4 2016: R+52.9 2012: R+51.9 2008: R+53.5
Not yet ingested
- Civics
- —
Market trends
- HPI YoY
- ▼ -90.04%
- Current HPI
- 172.5248
- Rent YoY
- ▲ 7.13%
- Metro
- Jackson, MS
- State GDP YoY
- —
- F500 in state
- 0
Price history
+116.6% since first listed6 events — show timeline
- 2026-06-12 Sold (MLS) — MLSU
- 2026-05-12 Pending — MLSU
- 2026-05-05 Price Changed $274,900 MLSU
- 2026-04-24 Listed $264,900 MLSU
- 2002-07-02 Sold (MLS) — MLSU
- 2001-12-01 Listed $126,900 MLSU
Property tax history
+1.3%/yrLatest (2025): $811 · +1.4% YoY. Source: county tax records.
Cash-flow waterfall
monthlySold comps — $/sqft
last 12 mo · ≤1 miLoading sold comps…