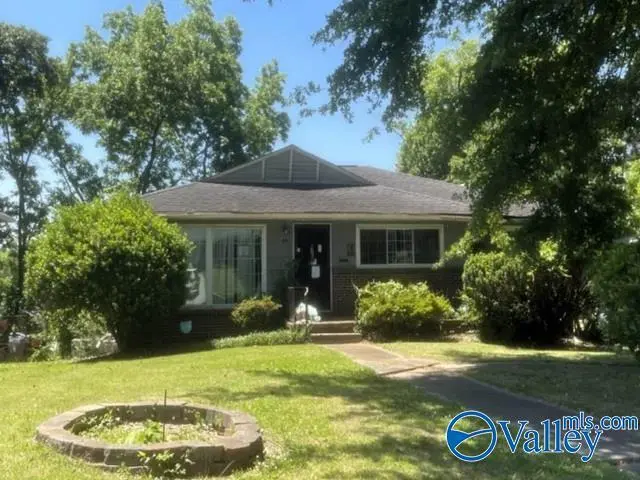
1045 50th St W · Birmingham, AL
Flood risk 1/10 · Minimal
- FEMA flood zone
- X (unshaded)
- Chance of flooding over 30 yrs
- 0.0%
- Est. flood insurance / yr
- $507 – $1,088
Fire risk 1/10 · Minimal
- Est. fire insurance / yr
- $916 – $1,700
Heat risk 6/10 · Moderate
- Hot days now (above 106°F)
- 7 days/yr
- Hot days in 30 yrs
- 17 days/yr
Wind risk 6/10 · Moderate
- Chance of severe wind over 30 yrs
- 27.0%
Air-quality risk 4/10 · Minor
- Unhealthy air days now
- 6 days/yr
- Unhealthy air days in 30 yrs
- 8 days/yr
Risk factors via First Street. Map © Google.
Why this score? — see what drove the B- grade
The composite is a weighted blend of 9 inputs, each scored 0–100. Each bar is that input's sub-score; the figure is the points it added to the 100-point composite (weight × sub-score).
- Cash flow +30.0/30.0
- 1% rule +10.0/10.0
- DSCR +10.0/10.0
- ARV discount +7.5/15.0
- Rent growth +4.3/5.0
- Livability +3.4/5.0
- Condition / age +2.5/5.0
- Schools +0.9/10.0
- Appreciation +0.0/10.0
$122,544
🖨 Deal sheet 📄 Offer letter ✓ Due diligence
Listing remarks
NO ACCESS OR VIEWINGS of this property. Please DO NOT DISTURB the occupant. Take a drive by this three bedroom, one bath home and see if it may be your next investment. "As is" cash only sale with no contingencies or inspections. Buyer will be responsible for obtaining possession of the property upon closing. May be subject to right of redemption.
Key facts
- 9,147 sq ft lot
- Built 1955
- Listed 30 days
Property features AI
Finance
- Other: Lot size about 0.21 acres
- HOA & community: No homeowners association; Subdivision: Other
Exterior
- Parking: No parking
- Utilities: Public water; Public sewer; Electric service (standard)
- Home design: Single-family residence; One story; Built in 1955; Frame construction
- Construction: Slab foundation
- Exterior features: Public water; Public sewer
Interior
- Bedrooms: Total rooms: 6
- Bathrooms: 1 full bathroom
- Heating & cooling: Central heating; Central cooling
- Interior features: Fireplace (one)
Neighborhood map
What this means for you Summary
Snapshot
- This is a 3-bed/1.0-bath single-family listed at $123k.
Deal economics
- At list price, monthly cash flow is $878 ($11k/yr) — positive.
- The deal already cash-flows at list — no discount required.
- Meets the 1% rule at list price ($2k rent vs $123k).
- Recommended offer: $121k (1.5% below list) — sets the bar for market timing.
- Cap rate 14.9% vs local median 6.2% in Birmingham — top-decile yield for the area; either an underpriced asset or a hidden risk that comps aren't pricing in. Stress-test before assuming the spread holds.
Location & tenants
- Location reads 67/100 on livability (#78 in AL) — a middle-class / working-renter tenant base. Strengths: commute A+, cost of living A+, housing A+; Watch: amenities C-, crime F, employment F.
- Birmingham City (urban): math 4% / reading 20% proficiency, ranked #116 of 129 in AL (top 90%) — low school quality limits family demand, transient renter base, plan for 1-2y turnover; 82% free/reduced lunch — lower-income household profile, screen leases tightly.
- Zoned schools: Bush Hills Steam Academy (math 0% / reading 13%, grade F, #249 of 257 statewide, top 98%, 433 students, 92% FRL).
- Market conditions: Rents rising fast (+7.2%/yr); 122 active listings in the ZIP; 2 comparable units currently listed for rent nearby; lower-income renter base — watch delinquency; 2,114 units permitted in Jefferson County in 2024 (556 in 5+ unit buildings).
- At $2,106/mo this rent would consume 66% of the median local household income ($39k/yr) (locally 573% of renters already pay >50% of income on rent) — very limited rent-growth headroom before tenants either downsize or default.
Forward outlook
- Local home prices are declining (-3.0%/yr); year-one equity from $847 of loan paydown is wiped out by about $4k of value loss. Plan a longer hold.
- Jefferson County population projected to shrink 4% by 2050 — rents likely to lag national; underwrite the cash flow, not the appreciation.
- At projected returns (-3.0% appreciation + 7.2% rent growth), your $34k cash investment doubles in ~4 years — after that, you're playing with house money.
Negotiation context
- It's been on market 30 days — a 2% lower offer ($121k) is reasonable based on typical stale-listing flexibility.
- Current owner paid $70k; list at $123k implies a 75% gain — meaningful room to come down on a strong offer.
Risks & watch-outs
- Watch-outs: built in 1955 — expect roof / HVAC / electrical / plumbing capex.
- Climate carrying-cost: major wind risk, 27% chance of damaging wind over 30y; extreme-heat days projected 7→17/yr by 2055 (HVAC capex compounding) — expect insurance premiums to compound above CPI over the hold.
Questions for the listing agent
- Built in 1955 — when were the roof, HVAC, electrical panel, plumbing, and water heater last replaced?
- Is there a deadline driving the sale (1031 exchange, divorce, estate, relocation)? That informs how much negotiation room exists.
- Schools are F-rated, which usually means shorter tenancies and higher turnover. Who's the typical renter profile here, and what's been the actual vacancy rate?
- Crime grade is F in this area — have there been break-ins, vandalism, or insurance claims at this property in the last 3 years? What carrier currently insures it and at what premium?
- What's the average days-on-market for RENTAL listings here right now (not sales)? A rising rental-DOM trend means longer vacancies and softer asking-rent achievability than the comps imply.
- What's the recent tenant-quality profile in this submarket — average credit score on applications, eviction rate, late-payment / NSF rate, and stable-employment percentage? A property-management company in the area should have these aggregated.
- How much new for-sale + rental construction is in the pipeline within 1–3 miles? Heavy new supply typically softens prices + rents 12–24 months out; constrained supply supports both.
Investment metrics
- 1% rule
- 1.72% ✓
- Cap rate
- 14.89%
- Cash-on-cash
- 30.70%
- DSCR
- 2.37
- GRM
- 4.8
CMA / ARV
- ARV (on-the-fly)
- $570,152
- Comps found
- 12
Show comp detail 12 sales within ~0.75 mi
| Address | Dist | Beds/Ba | Sqft | Sold | Price | $/sf | Match |
|---|---|---|---|---|---|---|---|
| 1240 51st St S | 0.34mi | 4/3.0 (+1) | 2,792 (+2%) | 3mo | $505,000 | $181 | 65 |
| 4708 Overwood Cir | 0.43mi | 4/2.0 (+1) | 2,804 (+3%) | 3mo | $562,000 | $200 | 64 |
| 1037 52nd Pl S | 0.18mi | 3/3.0 | 2,419 (-11%) | 8mo | $385,000 | $159 | 58 |
| 4826 Clairmont Ave | 0.39mi | 4/4.0 (+1) | 2,812 (+3%) | 4mo | $589,000 | $209 | 56 |
| 5148 6th Ave S | 0.62mi | 3/2.0 | 2,544 (-7%) | 1mo | $410,000 | $161 | 55 |
| 1225 51st St S | 0.30mi | 4/3.0 (+1) | 2,454 (-10%) | 1mo | $515,000 | $210 | 55 |
| 4421 Overlook Rd | 0.64mi | 3/3.0 | 2,536 (-7%) | 0mo | $595,000 | $235 | 50 |
| 912 Rockford Rd | 0.61mi | 3/2.0 | 2,448 (-10%) | 8mo | $424,000 | $173 | 44 |
| 745 Linwood Rd | 0.54mi | 4/2.5 (+1) | 2,978 (+9%) | 8mo | $980,000 | $329 | 42 |
| 5405 9th Ave S | 0.64mi | 4/3.0 (+1) | 2,924 (+7%) | 8mo | $585,000 | $200 | 39 |
| 925 Conroy Rd | 0.71mi | 3/3.5 | 2,459 (-10%) | 4mo | $950,000 | $386 | 37 |
| 712 43rd St S | 0.70mi | 4/2.5 (+1) | 2,431 (-11%) | 4mo | $560,000 | $230 | 35 |
Match score weights: distance 35% · size 25% · config 20% · recency 20%. Top-matched comps best support the ARV.
Projected returns pro-forma
-3.0% appreciation · 7.24% rent growth · sell at horizon
- IRR
- 30.0%
- Equity multiple
- 2.32×
- Total profit
- $45,407
- Equity at exit
- $18,272
- IRR
- 39.5%
- Equity multiple
- 5.47×
- Total profit
- $153,456
- Equity at exit
- $10,595
Cash invested: $34,312 (down + closing). Projections, not guarantees.
Landlord ↔ Tenant lean methodology
- Overall (STATE)
- 90 Strongly Landlord-Friendly
- State Alabama
- 90 Strongly Landlord-Friendly · R+15
- County
- — inherits STATE
- City
- — inherits STATE
ZIP-level market 35208
- Home prices YoY
- -18.1%
- Rents YoY
- 7.2%
- Active inventory
- 122
- Price-to-rent
- 4.8×
Monthly cashflow live
- Estimated rent
- $2,106 medium interval (Pro) →
- Mortgage (P&I)
- −$643
- Tax from tax record
- −$92 /mo · $1,106/yr
- Insurance
- −$51
- HOA
- −$0
- Vacancy / Maint / Mgmt
- −$442
- Net cashflow
- $878
Break-even live
UW: 25.0% down · 7.5% · 30yr · 1.5% tax · 5.0% vac · 8.0% maint · 8.0% mgmt
Financing live
Cash to close
- Down payment
- $30,636
- Closing costs
- $3,676
- Reserves months
- —
- Total cash needed
- —
Loan-product check · same deal, 3 products live
Conventional
25% down · 7.5% · 30yr
- Down + closing
- —
- Monthly P&I
- —
- Monthly cashflow
- —
- DSCR
- —
- Eligible?
- —
Personal DTI + credit; lowest rate.
DSCR
20% down · 8.5% · 30yr
- Down + closing
- —
- Monthly P&I
- —
- Monthly cashflow
- —
- DSCR
- —
- Eligible?
- —
No personal income docs; deal must DSCR.
Hard money
10% down · 12.0% · 12mo
- Down + closing
- —
- Monthly P&I
- —
- Monthly cashflow
- —
- DSCR
- —
- Eligible?
- —
Short-term bridge; refi at stabilization.
Rent comps 2 comps
| Address | Beds | Baths | Sqft | Rent | $/sqft | DOM | Units | Dist |
|---|---|---|---|---|---|---|---|---|
| 1316 Southhall Rd Birmingham, AL | 3.0 | 2.0 | 2044 | $2,300 | $1.13 | 43d | 1 | 1.22mi |
| 3723 5th Ave S Birmingham, AL | 3.0 | 2.0 | 1840 | $3,400 | $1.85 | 43d | 1 | 1.26mi |
Listing history 16 events
-
2026-06-18days on market $122,544 Active 30 DOM
-
2026-06-17days on market $122,544 Active 29 DOM
-
2026-06-16days on market $122,544 Active 28 DOM
-
2026-06-15days on market $122,544 Active 27 DOM
-
2026-06-13days on market $122,544 Active 25 DOM
-
2026-06-10days on market $122,544 Active 22 DOM
-
2026-06-09days on market $122,544 Active 21 DOM
-
2026-06-08days on market $122,544 Active 20 DOM
-
2026-06-07days on market $122,544 Active 19 DOM
-
2026-06-03days on market $122,544 Active 15 DOM
-
2026-06-02days on market $122,544 Active 14 DOM
-
2026-06-01days on market $122,544 Active 13 DOM
-
2026-05-31days on market $122,544 Active 12 DOM
-
2026-05-19$122,544 Active
-
1999-06-24soldstatus $69,900
-
1999-05-18soldstatus $69,900
ⓘ Source: listings_history table (triggers on properties + properties_extension) + one-shot
backfill from property_details.listing_events for pre-trigger history.
Tax reassessment forecast AL · Resets to sale price
- Current annual tax
- $1,106 · $92/mo
- Projected year-2 tax
- $1,106 · $92/mo
- Expected delta
- $0/yr ($0/mo · 0.0%)
ⓘ Screening estimate from a state-policy table — verify with the county assessor before closing.
Climate risk First Street
- Flood 1/10 Low FEMA zone X (unshaded) · 0% chance over 30 yrs
- Wildfire 1/10 Low
- Heat 6/10 Major 7 d/yr ≥106°F today · 17 d/yr by 30 yrs out
- Wind 6/10 Major 27% chance of damaging wind over 30 yrs
- Air quality 4/10 Moderate 6 unhealthy d/yr today · 8 by 30 yrs out
Nearby sold comps map
Loading sold comps map…
Walkable amenities ~0.75 mi
Loading nearby amenities…
Taxation est. · year 1
- Rental income
- $25,269
- − Mortgage interest
- −$6,864
- − Property taxes
- −$1,106
- − Insurance
- −$613
- − Repairs & maintenance
- −$2,022
- − Management
- −$2,022
- − Depreciation
- −$3,565
- Taxable income
- $9,079
- Est. tax owed @ 24.0%
- −$2,179
- After-tax cash flow
- $8,354/yr
For passive investors: Depreciation is non-cash, so a rental often shows a tax loss while cash-flowing — sheltering income. Rental losses are passive: they offset passive income freely, and up to $25,000/yr can offset ordinary (W-2) income if you actively participate and your MAGI is under $100k (phasing out to $0 by $150k); unused losses carry forward. On sale, claimed depreciation is recaptured at up to 25%, and gains may owe capital-gains tax (a 1031 exchange can defer both). Figures are a year-1 estimate at your 24.0% rate — not tax advice; consult a CPA.
Schools (NCES district)
- District
- Birmingham City
- NCES district ID
- 0100390
- Math proficiency
- 4% ▼ -17.00%
- Reading proficiency
- 20% ▼ -4.00%
- Median HH income
- $31,988
- Composite
- 9.49/100
- National rank
- #9850
- State rank
- #116 of 129 in AL
Livability — Birmingham
- Score
- 67/100
- State rank
- #78
- US rank
- #10412
Category grades
Schools grade is shown separately in the Schools card above.
Census & demographics
- Census place
- Birmingham, AL
- County
- Jefferson County · 527,445 people
- City population
- 210,422
- Metro
- Birmingham-Hoover, AL
- Population (ZIP)
- 13,412
- Household income
- $38,561
- Rent vs Own
- Severe rent burden
- 573.0
Population outlook (Jefferson County) Hauer SSP2
- Today (2025)
- 669,185 people
- By 2030
- 669,694 · +0.1%
- By 2040
- 661,388 · -1.2%
- By 2050
- 643,086 · -3.9%
- By 2075
- 577,267 · -13.7%
- By 2100
- 474,758 · -29.1%
Race, ethnicity, and origin ACS 2023
- Neighborhood character
- Predominantly Black (94%)
- Race & ethnicity
- Black 94% White 4% Hispanic / Latino 2% Two or more races 1%
- Foreign-born
- 3% · Canada
- Languages at home
- 96% English-only · Spanish 2%
Political lean MEDSL · Jefferson
- 2024 margin
- D (+10.4) · D 54.6% · R 44.2% · Other 1.2%
- 2008→2024 swing
- +5.4pp toward D · 2008: 5.1pp · 2024: 10.4pp
- All cycles
- 2024: D+10.4 2020: D+13.2 2016: D+7.2 2012: D+6.0 2008: D+5.1
Not yet ingested
- Civics
- —
Market trends
- HPI YoY
- ▼ -33.99%
- Current HPI
- 153.414
- Rent YoY
- ▲ 7.24%
- Metro
- Birmingham-Hoover, AL
- State GDP YoY
- ▲ 2.94%
- F500 in state
- 4
Industry mix (Fortune 500 HQ in AL)
| Industry | F500 HQs | Revenue |
|---|---|---|
| Financial Services | 1 | $8B |
|
||
| Healthcare | 1 | $5B |
|
||
Price history
+75.3% since first listed3 events — show timeline
- 2026-05-19 Listed $122,544 VMLS
- 1999-06-24 Sold (Public Records) $69,900 Public Records
- 1999-05-18 Sold (Public Records) $69,900 Public Records
Property tax history
+0.0%/yrLatest (2025): $1,106 · +0.0% YoY. Source: county tax records.
Cash-flow waterfall
monthlySold comps — $/sqft
last 12 mo · ≤1 miLoading sold comps…