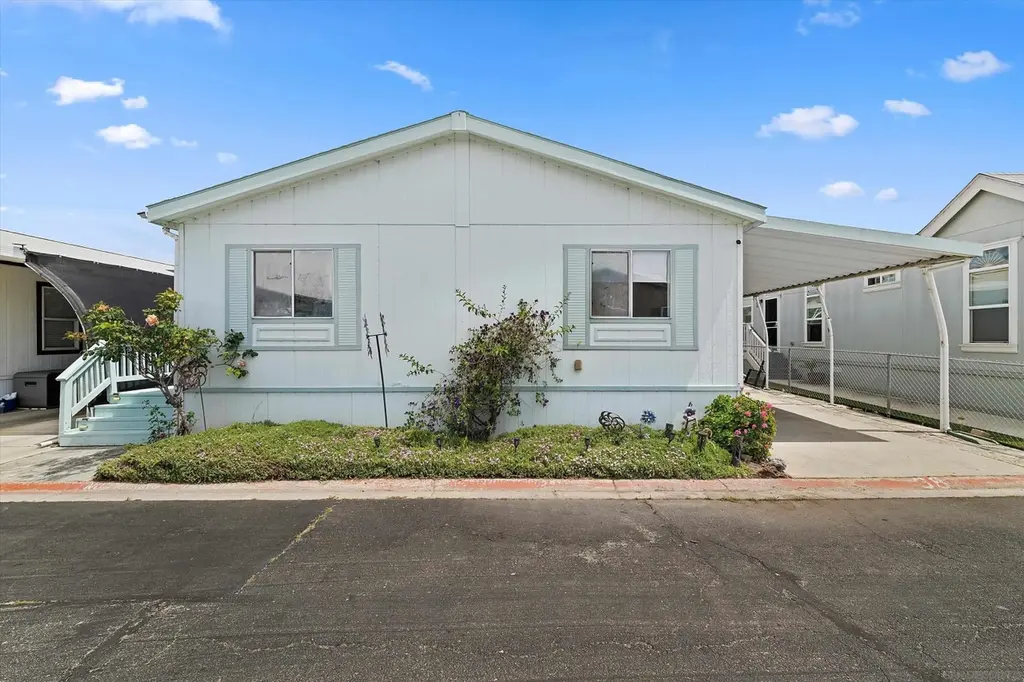
4616 N River Ave Spc 68 · Oceanside, CA
Flood risk 1/10 · Minimal
- FEMA flood zone
- X (shaded)
- Chance of flooding over 30 yrs
- 0.0%
- Est. flood insurance / yr
- $507 – $1,088
Fire risk 4/10 · Minor
- Est. fire insurance / yr
- $659 – $1,223
Heat risk 6/10 · Moderate
- Hot days now (above 87°F)
- 8 days/yr
- Hot days in 30 yrs
- 24 days/yr
Wind risk 1/10 · Minimal
- Chance of severe wind over 30 yrs
- —
Air-quality risk 4/10 · Minor
- Unhealthy air days now
- 5 days/yr
- Unhealthy air days in 30 yrs
- 5 days/yr
Risk factors via First Street. Map © Google.
Why this score? — see what drove the C+ grade
The composite is a weighted blend of 9 inputs, each scored 0–100. Each bar is that input's sub-score; the figure is the points it added to the 100-point composite (weight × sub-score).
- Cash flow +28.9/30.0
- DSCR +10.0/10.0
- 1% rule +6.9/10.0
- ARV discount +4.3/15.0
- Schools +3.6/10.0
- Rent growth +3.3/5.0
- Livability +3.2/5.0
- Condition / age +2.5/5.0
- Appreciation +0.0/10.0
$319,000
🖨 Deal sheet 📄 Offer letter ✓ Due diligence
Listing remarks MLS
Welcome to this beautifully updated manufactured home located in a rent controlled all-ages community in Oceanside! This inviting residence features new flooring throughout and an updated kitchen, creating a fresh and modern living space ready for its next owner. Enjoy the convenience of an indoor laundry room, adding ease to your daily routine. Easy access to nearby shopping, dining, and major freeways, this home offers both comfort and convenience. A great opportunity for first-time buyers, down sizers, or those seeking an affordable coastal lifestyle!
Key facts
- Updated kitchen
- Indoor laundry room
- 9.33 acre lot
Tags
Neighborhood map
What this means for you Summary
Snapshot
- This is a 4-bed/2.0-bath manufactured listed at $319k.
Deal economics
- At list price, monthly cash flow is $1k ($13k/yr) — positive.
- The deal already cash-flows at list — no discount required.
- Meets the 1% rule at list price ($4k rent vs $319k).
- Recommended offer: $300k (6.0% below list) — sets the bar for market timing.
- Cap rate 10.4% vs local median 2.5% in Oceanside — top-decile yield for the area; either an underpriced asset or a hidden risk that comps aren't pricing in. Stress-test before assuming the spread holds.
Location & tenants
- Location reads 64/100 on livability (#413 in CA) — a middle-class / working-renter tenant base. Strengths: amenities A+, commute A+, employment A; Watch: schools D+, crime D, cost of living F.
- Oceanside Unified (suburban): math 31% / reading 51% proficiency, ranked #221 of 517 in CA (top 43%) — families likely to look elsewhere, expect single-tenant / working-renter base with shorter leases.
- Market conditions: Rents rising (+3.3%/yr); 245 active listings in the ZIP; 18 comparable units currently listed for rent nearby; rentals at typical pace (median 24d on market — plan ~3-4 weeks tenant-placement turnaround); solid renter incomes; 11,759 units permitted in San Diego County in 2024 (7,244 in 5+ unit buildings).
- This rent runs 42% of the median local income ($109k/yr) — at the standard rent-burdened threshold; future hikes will face affordability resistance.
Forward outlook
- Local home prices are declining (-3.0%/yr); year-one equity from $2k of loan paydown is wiped out by about $10k of value loss. Plan a longer hold.
- San Diego County population projected at +20% by 2050 — long-run rental-demand tailwind backs the buy-and-hold thesis.
- At projected returns (-3.0% appreciation + 3.3% rent growth), your $89k cash investment doubles in ~8 years — after that, you're playing with house money.
Negotiation context
- It's been on market 62 days — a 6% lower offer ($300k) is reasonable based on typical stale-listing flexibility.
- 3 sale attempts since 22y ago; this cycle's ask is 7% above the opening price — seller raised mid-cycle; expect resistance to lowballs.
Risks & watch-outs
- Climate carrying-cost: extreme-heat days projected 8→24/yr by 2055 (HVAC capex compounding) — expect insurance premiums to compound above CPI over the hold.
Questions for the listing agent
- It's been on market 62 days. Have you received any prior offers? Is the seller open to a 6% concession, seller financing, or rate buy-down credit?
- Why hasn't it sold? Are there any deal-killer items the seller is aware of (foundation, flood, title, zoning, code violations)?
- Is there a deadline driving the sale (1031 exchange, divorce, estate, relocation)? That informs how much negotiation room exists.
- Schools are D-rated, which usually means shorter tenancies and higher turnover. Who's the typical renter profile here, and what's been the actual vacancy rate?
- Crime grade is D in this area — have there been break-ins, vandalism, or insurance claims at this property in the last 3 years? What carrier currently insures it and at what premium?
- What's the average days-on-market for RENTAL listings here right now (not sales)? A rising rental-DOM trend means longer vacancies and softer asking-rent achievability than the comps imply.
- What's the recent tenant-quality profile in this submarket — average credit score on applications, eviction rate, late-payment / NSF rate, and stable-employment percentage? A property-management company in the area should have these aggregated.
- How much new for-sale + rental construction is in the pipeline within 1–3 miles? Heavy new supply typically softens prices + rents 12–24 months out; constrained supply supports both.
Investment metrics
- 1% rule
- 1.19% ✓
- Cap rate
- 10.36%
- Cash-on-cash
- 14.54%
- DSCR
- 1.65
- GRM
- 7.0
CMA / ARV
- ARV (median comp)
- $298,042
- List price
- $319,000
- Delta
- 7.03%
- Verdict
- FAIR
- Comps
- 20 within 1.0 mi
Show comp detail 11 sales within ~0.75 mi
| Address | Dist | Beds/Ba | Sqft | Sold | Price | $/sf | Match |
|---|---|---|---|---|---|---|---|
| 4660 N River Rd #36 | 0.13mi | 4/2.0 | 1,493 (0%) | 12mo | $420,000 | $281 | 84 |
| 4616 N RIVER Rd #83 | 0.00mi | 4/2.0 | 1,546 (+4%) | 15mo | $270,000 | $175 | 82 |
| 4616 North River Rd #8 | 0.00mi | 3/2.0 (-1) | 1,325 (-11%) | 1mo | $262,000 | $198 | 75 |
| 4660 N River Rd #64 | 0.13mi | 4/2.0 | 1,605 (+8%) | 9mo | $430,000 | $268 | 74 |
| 4616 North River Rd #64 | 0.03mi | 4/2.0 | 1,440 (-4%) | 23mo | $350,000 | $243 | 73 |
| 4660 N River Rd #17 | 0.13mi | 3/2.0 (-1) | 1,626 (+9%) | 1mo | $370,000 | $228 | 73 |
| 4660 N River Rd #116 | 0.13mi | 4/2.0 | 1,674 (+12%) | 2mo | $390,000 | $233 | 72 |
| 4616 N River Rd Spc 15 | 0.00mi | 3/2.0 (-1) | 1,344 (-10%) | 9mo | $245,000 | $182 | 71 |
| 4660 N River Rd #133 | 0.18mi | 3/3.0 (-1) | 1,440 (-4%) | 11mo | $399,000 | $277 | 67 |
| 4660 N River Rd #136 | 0.18mi | 3/3.0 (-1) | 1,344 (-10%) | 1mo | $428,000 | $318 | 65 |
| 4660 N River Rd #96 | 0.18mi | 3/2.0 (-1) | 1,440 (-4%) | 22mo | $295,000 | $205 | 62 |
Match score weights: distance 35% · size 25% · config 20% · recency 20%. Top-matched comps best support the ARV.
Projected returns pro-forma
-3.0% appreciation · 3.29% rent growth · sell at horizon
- IRR
- 5.2%
- Equity multiple
- 1.20×
- Total profit
- $18,213
- Equity at exit
- $47,564
- IRR
- 14.9%
- Equity multiple
- 2.22×
- Total profit
- $108,689
- Equity at exit
- $27,581
Cash invested: $89,320 (down + closing). Projections, not guarantees.
Landlord ↔ Tenant lean methodology
- Overall (STATE)
- 18 Strongly Tenant-Friendly
- State California
- 18 Strongly Tenant-Friendly · D+13
- County
- — inherits STATE
- City
- — inherits STATE
ZIP-level market 92057
- Rents YoY
- 3.3%
- Active inventory
- 245
- Price-to-rent
- 7.0×
Monthly cashflow live
- Estimated rent
- $3,793 high interval (Pro) →
- Mortgage (P&I)
- −$1,673
- Tax from tax record
- −$109 /mo · $1,303/yr
- Insurance
- −$133
- HOA
- −$0
- Vacancy / Maint / Mgmt
- −$797
- Net cashflow
- $1,082
Break-even live
UW: 25.0% down · 7.5% · 30yr · 1.5% tax · 5.0% vac · 8.0% maint · 8.0% mgmt
Financing live
Cash to close
- Down payment
- $79,750
- Closing costs
- $9,570
- Reserves months
- —
- Total cash needed
- —
Loan-product check · same deal, 3 products live
Conventional
25% down · 7.5% · 30yr
- Down + closing
- —
- Monthly P&I
- —
- Monthly cashflow
- —
- DSCR
- —
- Eligible?
- —
Personal DTI + credit; lowest rate.
DSCR
20% down · 8.5% · 30yr
- Down + closing
- —
- Monthly P&I
- —
- Monthly cashflow
- —
- DSCR
- —
- Eligible?
- —
No personal income docs; deal must DSCR.
Hard money
10% down · 12.0% · 12mo
- Down + closing
- —
- Monthly P&I
- —
- Monthly cashflow
- —
- DSCR
- —
- Eligible?
- —
Short-term bridge; refi at stabilization.
Rent comps 18 comps
| Address | Beds | Baths | Sqft | Rent | $/sqft | DOM | Units | Dist |
|---|---|---|---|---|---|---|---|---|
| 4459 Anne Sladon St Oceanside, CA | 3.0 | 1.0 | 1161 | $2,950 | $2.54 | 24d | 1 | 0.24mi |
| 757 Sunningdale Dr Oceanside, CA | 3.0 | 2.0 | 1400 | $4,200 | $3.00 | 17d | 1 | 0.58mi |
| 746 Point Arguello Oceanside, CA | 3.0 | 2.0 | 1260 | $3,495 | $2.77 | 24d | 1 | 0.72mi |
| 4504 Goldfinch Way Oceanside, CA | 3.0 | 2.5 | 1436 | $3,400 | $2.37 | 24d | 1 | 0.75mi |
| 619 Monica Cir Oceanside, CA | 4.0 | 2.0 | 1200 | $4,000 | $3.33 | 2d | 1 | 1.02mi |
| 266 Manzanita Dr Oceanside, CA | 3.0 | 2.0 | 1140 | $3,750 | $3.29 | 43d | 1 | 1.02mi |
| 4907 Stephanie Pl Oceanside, CA | 3.0 | 2.0 | 1074 | $3,000 | $2.79 | 10d | 1 | 1.04mi |
| 3925 Estancia Dr Oceanside, CA | 3.0 | 2.0 | 1501 | $4,495 | $2.99 | 43d | 1 | 1.05mi |
| 4211 Mission Ranch Way Oceanside, CA | 3.0 | 3.0 | 1548 | $3,949 | $2.55 | 44d | 1 | 1.06mi |
| 4724 Ventana Way Oceanside, CA | 3.0 | 2.5 | 1532 | $3,800 | $2.48 | 24d | 1 | 1.09mi |
| 4140 Sitio Flor Oceanside, CA | 3.0 | 3.0 | 1548 | $3,725 | $2.41 | 43d | 1 | 1.10mi |
| 4110 Sitio Flor Oceanside, CA | 3.0 | 2.0 | 1366 | $3,595 | $2.63 | 43d | 1 | 1.13mi |
| 185 Avenida Las Brisas Apt A Oceanside, CA | 3.0 | 2.0 | 1350 | $3,100 | $2.30 | 43d | 1 | 1.16mi |
| 283 Douglas Dr Oceanside, CA | 2.0–3.0 | 2.0 | 1017 | $3,127 | $3.07 | 1d | 7 | 1.17mi |
| 4912 Tyler St Oceanside, CA | 4.0 | 2.0 | 1443 | $3,800 | $2.63 | 3d | 1 | 1.20mi |
| 4401 Mission Ave Oceanside, CA | 1.0–3.0 | 1.0–2.0 | 975 | $3,848 | $3.95 | 1d | 12 | 1.35mi |
| 3679 Branch Ct Oceanside, CA | 3.0 | 2.0 | 1625 | $3,895 | $2.40 | 3d | 1 | 1.38mi |
| 225 Melinda Way Oceanside, CA | 3.0 | 2.5 | 1610 | $4,000 | $2.48 | 43d | 1 | 1.44mi |
Listing history 22 events
-
2026-06-18days on market $319,000 Active 62 DOM
-
2026-06-17days on market $319,000 Active 61 DOM
-
2026-06-16days on market $319,000 Active 60 DOM
-
2026-06-15days on market $319,000 Active 59 DOM
-
2026-06-13days on market $319,000 Active 57 DOM
-
2026-06-13days on market $319,000 Active 56 DOM
-
2026-06-09days on market $319,000 Active 53 DOM
-
2026-06-08days on market $319,000 Active 52 DOM
-
2026-06-07days on market $319,000 Active 51 DOM
-
2026-06-04days on market $319,000 Active 48 DOM
-
2026-06-03days on market $319,000 Active 47 DOM
-
2026-06-02days on market $319,000 Active 46 DOM
-
2026-06-01days on market $319,000 Active 45 DOM
-
2026-05-31days on market $319,000 Active 44 DOM
-
2026-04-27price $319,000 560-char remark
Show marketing remark (560 chars)
Welcome to this beautifully updated manufactured home located in a rent controlled all-ages community in Oceanside! This inviting residence features new flooring throughout and an updated kitchen, creating a fresh and modern living space ready for its next owner. Enjoy the convenience of an indoor laundry room, adding ease to your daily routine. Easy access to nearby shopping, dining, and major freeways, this home offers both comfort and convenience. A great opportunity for first-time buyers, down sizers, or those seeking an affordable coastal lifestyle!
-
2026-04-17$299,000 Active 560-char remark
Show marketing remark (560 chars)
Welcome to this beautifully updated manufactured home located in a rent controlled all-ages community in Oceanside! This inviting residence features new flooring throughout and an updated kitchen, creating a fresh and modern living space ready for its next owner. Enjoy the convenience of an indoor laundry room, adding ease to your daily routine. Easy access to nearby shopping, dining, and major freeways, this home offers both comfort and convenience. A great opportunity for first-time buyers, down sizers, or those seeking an affordable coastal lifestyle!
-
2022-10-21soldstatus $349,000 Sold 515-char remark
Show marketing remark (515 chars)
* * FOUR BEDROOM ALL AGES UNICORN * * Very rare 2001 4BR / 2BA manufactured home in an all ages community in Oceanside, California. Great floor plan with large family room. Updated kitchen with granite counters and dining. Private master and en suite span the rear of the home. And the 3 large bedrooms allow everybody to have their privacy. This pet friendly park has great amenities including a friendly clubhouse, pool and playground. Listing Broker is Mortgage Originator NMLS DFPI 1007484. Excellent terms.
-
2022-08-24status Pending 515-char remark
Show marketing remark (515 chars)
* * FOUR BEDROOM ALL AGES UNICORN * * Very rare 2001 4BR / 2BA manufactured home in an all ages community in Oceanside, California. Great floor plan with large family room. Updated kitchen with granite counters and dining. Private master and en suite span the rear of the home. And the 3 large bedrooms allow everybody to have their privacy. This pet friendly park has great amenities including a friendly clubhouse, pool and playground. Listing Broker is Mortgage Originator NMLS DFPI 1007484. Excellent terms.
-
2022-07-22$349,000 Active 515-char remark
Show marketing remark (515 chars)
* * FOUR BEDROOM ALL AGES UNICORN * * Very rare 2001 4BR / 2BA manufactured home in an all ages community in Oceanside, California. Great floor plan with large family room. Updated kitchen with granite counters and dining. Private master and en suite span the rear of the home. And the 3 large bedrooms allow everybody to have their privacy. This pet friendly park has great amenities including a friendly clubhouse, pool and playground. Listing Broker is Mortgage Originator NMLS DFPI 1007484. Excellent terms.
-
2008-05-01price $125,000 Sold
-
2005-02-18soldstatus $119,000
-
2004-09-02$121,000
ⓘ Source: listings_history table (triggers on properties + properties_extension) + one-shot
backfill from property_details.listing_events for pre-trigger history.
Tax reassessment forecast CA · Resets to sale price
- Current annual tax
- $1,303 · $109/mo
- Projected year-2 tax
- $2,424 · $202/mo
- Expected delta
- +$1,121/yr (+$93/mo · 86.1%)
ⓘ Screening estimate from a state-policy table — verify with the county assessor before closing.
Climate risk First Street
- Flood 1/10 Low FEMA zone X (shaded) · 0% chance over 30 yrs
- Wildfire 4/10 Moderate
- Heat 6/10 Major 8 d/yr ≥87°F today · 24 d/yr by 30 yrs out
- Wind 1/10 Low
- Air quality 4/10 Moderate 5 unhealthy d/yr today · 5 by 30 yrs out
Nearby sold comps map
Loading sold comps map…
Walkable amenities ~0.75 mi
Loading nearby amenities…
Taxation est. · year 1
- Rental income
- $45,515
- − Mortgage interest
- −$17,869
- − Property taxes
- −$1,303
- − Insurance
- −$1,595
- − Repairs & maintenance
- −$3,641
- − Management
- −$3,641
- − Depreciation
- −$9,280
- Taxable income
- $8,186
- Est. tax owed @ 24.0%
- −$1,965
- After-tax cash flow
- $11,020/yr
For passive investors: Depreciation is non-cash, so a rental often shows a tax loss while cash-flowing — sheltering income. Rental losses are passive: they offset passive income freely, and up to $25,000/yr can offset ordinary (W-2) income if you actively participate and your MAGI is under $100k (phasing out to $0 by $150k); unused losses carry forward. On sale, claimed depreciation is recaptured at up to 25%, and gains may owe capital-gains tax (a 1031 exchange can defer both). Figures are a year-1 estimate at your 24.0% rate — not tax advice; consult a CPA.
Schools (NCES district)
- District
- Oceanside Unified
- NCES district ID
- 0628250
- Math proficiency
- 31% ▼ -5.00%
- Reading proficiency
- 51% ▲ 6.00%
- Median HH income
- $55,158
- Composite
- 35.74/100
- National rank
- #4853
- State rank
- #221 of 517 in CA
Livability — Oceanside
- Score
- 64/100
- State rank
- #413
- US rank
- #14081
Category grades
Schools grade is shown separately in the Schools card above.
Census & demographics
- Census place
- Oceanside, CA
- County
- San Diego County · 3,178,799 people
- City population
- 198,702
- Metro
- San Diego-Chula Vista-Carlsbad, CA
- Population (ZIP)
- 56,835
- Household income
- $108,814
- Rent vs Own
- Severe rent burden
- 1509.0
Population outlook (San Diego County) Hauer SSP2
- Today (2025)
- 3,678,185 people
- By 2030
- 3,856,546 · +4.8%
- By 2040
- 4,171,407 · +13.4%
- By 2050
- 4,421,607 · +20.2%
- By 2075
- 4,831,599 · +31.4%
- By 2100
- 4,832,502 · +31.4%
Race, ethnicity, and origin ACS 2023
- Neighborhood character
- Diverse neighborhood (Simpson 0.68)
- Race & ethnicity
- Hispanic / Latino 40% White 40% Two or more races 24% Asian 9% Black 5%
- Hispanic origin (detail)
- Mexican 33% Puerto Rican 1%
- Common ancestry
- Slovak 2% Romanian 2% Lithuanian 2%
- Foreign-born
- 21% · Canada, Vietnam, China
- Languages at home
- 66% English-only · Spanish 25% Tagalog/Filipino 2% Other Asian/Pacific 1%
Political lean MEDSL · San Diego
- 2024 margin
- D (+16.8) · D 56.9% · R 40.1% · Other 2.9%
- 2008→2024 swing
- +6.6pp toward D · 2008: 10.2pp · 2024: 16.8pp
- All cycles
- 2024: D+16.8 2020: D+22.8 2016: D+17.8 2012: D+5.1 2008: D+10.2
Not yet ingested
- Civics
- —
Market trends
- HPI YoY
- ▼ -1014.18%
- Current HPI
- 393.7681
- Rent YoY
- ▲ 3.29%
- Metro
- San Diego-Chula Vista-Carlsbad, CA
- State GDP YoY
- ▲ 3.21%
- F500 in state
- 116
Industry mix (Fortune 500 HQ in CA)
| Industry | F500 HQs | Revenue |
|---|---|---|
| Technology | 27 | $1,492B |
|
||
| Financial Services | 3 | $174B |
|
||
| Retail | 3 | $44B |
|
||
| Insurance | 3 | $26B |
|
||
| Media / Entertainment | 2 | $115B |
|
||
| Pharmaceuticals / Biotech | 2 | $62B |
|
||
Price history
+163.6% since first listed8 events — show timeline
- 2026-04-27 Price Changed $319,000 SDMLS
- 2026-04-17 Listed $299,000 SDMLS
- 2022-10-21 Sold (MLS) $349,000 SDMLS
- 2022-08-24 Pending — SDMLS
- 2022-07-22 Listed $349,000 SDMLS
- 2008-05-01 Price Changed $125,000 SDMLS
- 2005-02-18 Sold (MLS) $119,000 CRMLS
- 2004-09-02 Listed $121,000 CRMLS
Property tax history
+4.4%/yrLatest (2013): $1,303 · +2.1% YoY. Source: county tax records.
Cash-flow waterfall
monthlySold comps — $/sqft
last 12 mo · ≤1 miLoading sold comps…