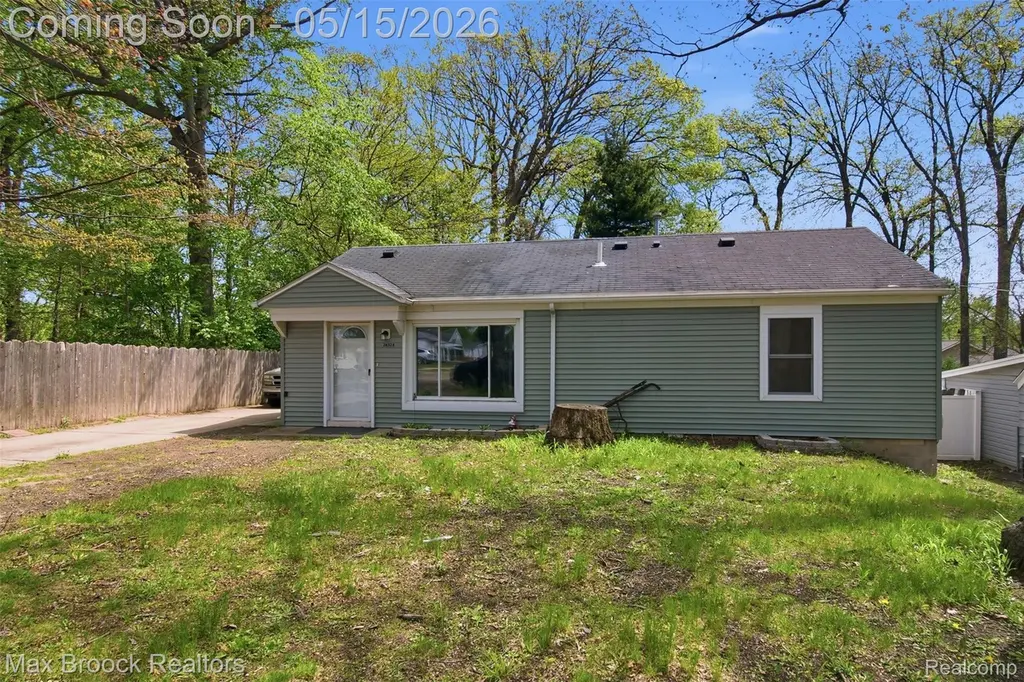
24324 Hebe Ave · Warren, MI
Flood risk 1/10 · Minimal
- FEMA flood zone
- X (unshaded)
- Chance of flooding over 30 yrs
- 0.0%
- Est. flood insurance / yr
- $507 – $1,088
Fire risk 1/10 · Minimal
- Est. fire insurance / yr
- $784 – $1,456
Heat risk 3/10 · Minor
- Hot days now (above 97°F)
- 7 days/yr
- Hot days in 30 yrs
- 15 days/yr
Wind risk 1/10 · Minimal
- Chance of severe wind over 30 yrs
- —
Air-quality risk 3/10 · Minor
- Unhealthy air days now
- 3 days/yr
- Unhealthy air days in 30 yrs
- 5 days/yr
Risk factors via First Street. Map © Google.
Why this score? — see what drove the D+ grade
The composite is a weighted blend of 9 inputs, each scored 0–100. Each bar is that input's sub-score; the figure is the points it added to the 100-point composite (weight × sub-score).
- Cash flow +16.2/30.0
- ARV discount +13.7/15.0
- DSCR +5.0/10.0
- 1% rule +4.0/10.0
- Livability +3.7/5.0
- Rent growth +3.1/5.0
- Condition / age +2.5/5.0
- Schools +1.3/10.0
- Appreciation +0.0/10.0
$130,000
🖨 Deal sheet 📄 Offer letter ✓ Due diligence
Listing remarks MLS
Charming Warren Ranch with Mature Oak Trees Welcome to this well-maintained 2-bedroom, 1-bath ranch-style home in Warren, surrounded by beautiful mature oak trees that provide shade and curb appeal. This cozy home features a functional layout, comfortable living spaces, and a spacious 1.5-car garage with 220 amp service - perfect for hobbies, workshop space, or additional storage. Conveniently located near shopping, dining, and major roadways, this home offers both comfort and practicality.
Key facts
- 8,276 sq ft lot
- Garage
- Built 1946
Property features AI
Exterior
- Parking: Detached garage; Approximately 1.5 garage spaces
- Utilities: Public water; Public sewer
- Home design: Single family residence; One story; Ground-level entry; Vinyl siding
- Construction: Asphalt roof; Slab foundation
- Exterior features: Back yard fencing; Shed(s); Gravel road access
Interior
- Kitchen: Free-standing gas oven; Free-standing refrigerator; Dishwasher; Range hood; Garbage disposal
- Bedrooms: 5 total rooms (includes bedrooms and living spaces)
- Bathrooms: 1 full bathroom
- Heating & cooling: Central air; Ceiling fan(s); Forced air heating; Natural gas heating
- Interior features: Dishwasher; Garbage disposal; Range hood; Gas water heater; Crawl space basement
- Laundry & utility: Washer; Dryer
Neighborhood map
What this means for you Summary
Snapshot
- This is a 1-bed/1.0-bath single-family listed at $130k.
Deal economics
- At list price, monthly cash flow is $69 ($830/yr) — positive.
- The deal already cash-flows at list — no discount required.
- To meet the 1% rule (rent ≥ 1% of price), the offer needs to be $117k (9.8% below list).
- Recommended offer: $117k (9.8% below list) — sets the bar for 1% rule.
- Cap rate 6.9% vs local median 5.3% in Warren — top-decile yield for the area; either an underpriced asset or a hidden risk that comps aren't pricing in. Stress-test before assuming the spread holds.
Location & tenants
- Location reads 74/100 on livability (#171 in MI, #4,491 nationally) — a middle-class / working-renter tenant base. Strengths: commute A+, cost of living A+, housing A+; Watch: schools D, amenities D, employment D.
- Fitzgerald Public Schools (urban): math 8% / reading 23% proficiency, ranked #503 of 540 in MI (top 93%) — low school quality limits family demand, transient renter base, plan for 1-2y turnover; 77% free/reduced lunch — lower-income household profile, screen leases tightly.
- Market conditions: Rents rising (+2.4%/yr); 168 active listings in the ZIP; 9 comparable units currently listed for rent nearby; rentals leasing fast (median 13d on market — plan ~1-2 weeks tenant-placement turnaround); 1,321 units permitted in Macomb County in 2024 (86 in 5+ unit buildings).
Forward outlook
- Local home prices are declining (-3.0%/yr); year-one equity from $899 of loan paydown is wiped out by about $4k of value loss. Plan a longer hold.
- Macomb County population projected at +9% by 2050 — modest demand growth; plan on rents tracking national, not racing it.
Negotiation context
- It's been on market 15 days — a 2% lower offer ($128k) is reasonable based on typical stale-listing flexibility.
- 6 sale attempts with the ask held roughly flat each time — persistent listings suggest the price (not the market) is what's stuck; bring a comps-based counter.
- Current owner paid $55k; list at $130k implies a 136% gain — meaningful room to come down on a strong offer.
Risks & watch-outs
- Watch-outs: built in 1946 — expect roof / HVAC / electrical / plumbing capex.
Questions for the listing agent
- Built in 1946 — when were the roof, HVAC, electrical panel, plumbing, and water heater last replaced?
- Is there a deadline driving the sale (1031 exchange, divorce, estate, relocation)? That informs how much negotiation room exists.
- Schools are D-rated, which usually means shorter tenancies and higher turnover. Who's the typical renter profile here, and what's been the actual vacancy rate?
- Crime grade is D in this area — have there been break-ins, vandalism, or insurance claims at this property in the last 3 years? What carrier currently insures it and at what premium?
- The area grade is low — what's the realistic commute time and amenity access for the typical tenant pool here? Any planned neighborhood developments (good or bad) we should know about?
- What's the average days-on-market for RENTAL listings here right now (not sales)? A rising rental-DOM trend means longer vacancies and softer asking-rent achievability than the comps imply.
- What's the recent tenant-quality profile in this submarket — average credit score on applications, eviction rate, late-payment / NSF rate, and stable-employment percentage? A property-management company in the area should have these aggregated.
- How much new for-sale + rental construction is in the pipeline within 1–3 miles? Heavy new supply typically softens prices + rents 12–24 months out; constrained supply supports both.
Investment metrics
- 1% rule
- 0.90% ✗
- Cap rate
- 6.93%
- Cash-on-cash
- 2.28%
- DSCR
- 1.10
- GRM
- 9.2
CMA / ARV
- ARV (median comp)
- $150,618
- List price
- $130,000
- Delta
- -13.69%
- Verdict
- UNDERPRICED
- Comps
- 20 within 1.0 mi
Show comp detail 12 sales within ~0.75 mi
| Address | Dist | Beds/Ba | Sqft | Sold | Price | $/sf | Match |
|---|---|---|---|---|---|---|---|
| 4259 Stephens Rd | 0.17mi | 2/1.0 (+1) | 950 (-2%) | 13mo | $128,800 | $136 | 72 |
| 24596 Eureka Ave | 0.15mi | 2/1.0 (+1) | 1,005 (+3%) | 13mo | $139,000 | $138 | 72 |
| 24248 Cunningham Ave | 0.16mi | 2/1.0 (+1) | 845 (-13%) | 7mo | $99,000 | $117 | 60 |
| 3342 Bart St | 0.67mi | 2/1.0 (+1) | 942 (-3%) | 1mo | $95,000 | $101 | 58 |
| 23220 Audrey Ave | 0.73mi | 2/1.0 (+1) | 952 (-2%) | 1mo | $169,900 | $178 | 57 |
| 23241 Hill Ave | 0.72mi | 2/1.0 (+1) | 912 (-6%) | 1mo | $145,000 | $159 | 50 |
| 25540 Eureka Dr Dr | 0.62mi | 2/1.0 (+1) | 988 (+2%) | 19mo | $110,000 | $111 | 48 |
| 3785 Norbert Ave | 0.30mi | 2/1.0 (+1) | 1,075 (+11%) | 19mo | $157,000 | $146 | 47 |
| 25435 Eureka Dr | 0.53mi | 2/1.0 (+1) | 930 (-4%) | 19mo | $105,000 | $113 | 47 |
| 3594 Los Angeles Ave | 0.73mi | 2/1.0 (+1) | 1,000 (+3%) | 18mo | $116,000 | $116 | 41 |
| 3103 Bart St | 0.74mi | 2/1.0 (+1) | 1,070 (+10%) | 15mo | $110,000 | $103 | 31 |
| 3979 Bart Ave | 0.46mi | 2/1.5 (+1) | 832 (-14%) | 22mo | $123,000 | $148 | 29 |
Match score weights: distance 35% · size 25% · config 20% · recency 20%. Top-matched comps best support the ARV.
Projected returns pro-forma
-3.0% appreciation · 2.35% rent growth · sell at horizon
- IRR
- -13.4%
- Equity multiple
- 0.52×
- Total profit
- $-17,431
- Equity at exit
- $19,383
- IRR
- -5.5%
- Equity multiple
- 0.65×
- Total profit
- $-12,625
- Equity at exit
- $11,240
Cash invested: $36,400 (down + closing). Projections, not guarantees.
Landlord ↔ Tenant lean methodology
- Overall (STATE)
- 62 Landlord-Friendly
- State Michigan
- 62 Landlord-Friendly · EVEN
- County
- — inherits STATE
- City
- — inherits STATE
ZIP-level market 48091
- Rents YoY
- 2.4%
- Active inventory
- 168
- Price-to-rent
- 9.2×
Monthly cashflow live
- Estimated rent
- $1,173 high interval (Pro) →
- Mortgage (P&I)
- −$682
- Tax from tax record
- −$122 /mo · $1,461/yr
- Insurance
- −$54
- HOA
- −$0
- Vacancy / Maint / Mgmt
- −$246
- Net cashflow
- $69
Break-even live
UW: 25.0% down · 7.5% · 30yr · 1.5% tax · 5.0% vac · 8.0% maint · 8.0% mgmt
Financing live
Cash to close
- Down payment
- $32,500
- Closing costs
- $3,900
- Reserves months
- —
- Total cash needed
- —
Loan-product check · same deal, 3 products live
Conventional
25% down · 7.5% · 30yr
- Down + closing
- —
- Monthly P&I
- —
- Monthly cashflow
- —
- DSCR
- —
- Eligible?
- —
Personal DTI + credit; lowest rate.
DSCR
20% down · 8.5% · 30yr
- Down + closing
- —
- Monthly P&I
- —
- Monthly cashflow
- —
- DSCR
- —
- Eligible?
- —
No personal income docs; deal must DSCR.
Hard money
10% down · 12.0% · 12mo
- Down + closing
- —
- Monthly P&I
- —
- Monthly cashflow
- —
- DSCR
- —
- Eligible?
- —
Short-term bridge; refi at stabilization.
Rent comps 9 comps
| Address | Beds | Baths | Sqft | Rent | $/sqft | DOM | Units | Dist |
|---|---|---|---|---|---|---|---|---|
| 4652 E 10 Mile Rd Warren, MI | 2.0 | 1.0 | 950 | $1,200 | $1.26 | 44d | 1 | 0.35mi |
| 4385 Frazho Rd Warren, MI | 1.0–2.0 | 1.0 | 825 | $968 | $1.17 | 3d | 6 | 0.83mi |
| 1771 E Woodward Heights Blvd #8 Hazel Park, MI | 1.0 | 1.0 | 800 | $990 | $1.24 | 3d | 1 | 1.24mi |
| 1770 E Woodward Heights Blvd Hazel Park, MI | 1.0–2.0 | 1.0 | 712 | $1,075 | $1.51 | 5d | 1 | 1.25mi |
| 1770 E Woodward Heights Blvd Unit C1 Hazel Park, MI | 1.0 | 1.0 | 550 | $1,350 | $2.45 | 24d | 1 | 1.25mi |
| 1770 E Woodward Heights Blvd Hazel Park, MI | 2.0 | 1.0 | 850 | $1,525 | $1.79 | 13d | 1 | 1.25mi |
| 1770 E Woodward Heights Blvd Unit E3 Hazel Park, MI | 2.0 | 1.0 | 850 | $1,300 | $1.53 | 24d | 1 | 1.25mi |
| 1770 E Woodward Heights Blvd Unit C6 Hazel Park, MI | 1.0 | 1.0 | 550 | $1,100 | $2.00 | 24d | 1 | 1.25mi |
| 3974 Berkshire Ave Warren, MI | 1.0 | 1.0 | 900 | $1,500 | $1.67 | 3d | 1 | 1.38mi |
Listing history 16 events
-
2026-05-15$130,000 Active 495-char remark
Show marketing remark (495 chars)
Charming Warren Ranch with Mature Oak Trees Welcome to this well-maintained 2-bedroom, 1-bath ranch-style home in Warren, surrounded by beautiful mature oak trees that provide shade and curb appeal. This cozy home features a functional layout, comfortable living spaces, and a spacious 1.5-car garage with 220 amp service - perfect for hobbies, workshop space, or additional storage. Conveniently located near shopping, dining, and major roadways, this home offers both comfort and practicality.
-
2026-05-15$130,000 Active 500-char remark
Show marketing remark (495 chars)
Charming Warren Ranch with Mature Oak Trees Welcome to this well-maintained 2-bedroom, 1-bath ranch-style home in Warren, surrounded by beautiful mature oak trees that provide shade and curb appeal. This cozy home features a functional layout, comfortable living spaces, and a spacious 1.5-car garage with 220 amp service - perfect for hobbies, workshop space, or additional storage. Conveniently located near shopping, dining, and major roadways, this home offers both comfort and practicality.
-
2026-05-13historical $130,000 495-char remark
Show marketing remark (495 chars)
Charming Warren Ranch with Mature Oak Trees Welcome to this well-maintained 2-bedroom, 1-bath ranch-style home in Warren, surrounded by beautiful mature oak trees that provide shade and curb appeal. This cozy home features a functional layout, comfortable living spaces, and a spacious 1.5-car garage with 220 amp service - perfect for hobbies, workshop space, or additional storage. Conveniently located near shopping, dining, and major roadways, this home offers both comfort and practicality.
-
2025-11-10historical
-
2025-10-10price $129,899
-
2025-10-09price $129,899
-
2025-10-05status Active
-
2025-10-05status Active
-
2025-10-01historical Active Under Contract
-
2025-10-01historical Accepting Backup Offers
-
2025-09-20$129,900 Active
-
2025-09-20$129,900 Active
-
2025-09-19historical
-
2003-10-07soldstatus $55,000
-
1997-05-22soldstatus $25,000
-
1991-07-03soldstatus $20,000
ⓘ Source: listings_history table (triggers on properties + properties_extension) + one-shot
backfill from property_details.listing_events for pre-trigger history.
Tax reassessment forecast MI · Partial reset (capped growth)
- Current annual tax
- $1,461 · $122/mo
- Projected year-2 tax
- $1,732 · $144/mo
- Expected delta
- +$270/yr (+$23/mo · 18.5%)
ⓘ Screening estimate from a state-policy table — verify with the county assessor before closing.
Climate risk First Street
- Flood 1/10 Low FEMA zone X (unshaded) · 0% chance over 30 yrs
- Wildfire 1/10 Low
- Heat 3/10 Moderate 7 d/yr ≥97°F today · 15 d/yr by 30 yrs out
- Wind 1/10 Low
- Air quality 3/10 Moderate 3 unhealthy d/yr today · 5 by 30 yrs out
Nearby sold comps map
Loading sold comps map…
Walkable amenities ~0.75 mi
Loading nearby amenities…
Taxation est. · year 1
- Rental income
- $14,079
- − Mortgage interest
- −$7,282
- − Property taxes
- −$1,461
- − Insurance
- −$650
- − Repairs & maintenance
- −$1,126
- − Management
- −$1,126
- − Depreciation
- −$3,782
- Taxable loss
- −$1,349
- Est. tax savings @ 24.0%
- +$324
- After-tax cash flow
- $1,154/yr
For passive investors: Depreciation is non-cash, so a rental often shows a tax loss while cash-flowing — sheltering income. Rental losses are passive: they offset passive income freely, and up to $25,000/yr can offset ordinary (W-2) income if you actively participate and your MAGI is under $100k (phasing out to $0 by $150k); unused losses carry forward. On sale, claimed depreciation is recaptured at up to 25%, and gains may owe capital-gains tax (a 1031 exchange can defer both). Figures are a year-1 estimate at your 24.0% rate — not tax advice; consult a CPA.
Schools (NCES district)
- District
- Fitzgerald Public Schools
- NCES district ID
- 2614460
- Math proficiency
- 8% ▼ -8.00%
- Reading proficiency
- 23% ▼ -11.00%
- Median HH income
- $34,828
- Composite
- 12.67/100
- National rank
- #9608
- State rank
- #503 of 540 in MI
Livability — Warren
- Score
- 74/100
- State rank
- #171
- US rank
- #4491
Category grades
Schools grade is shown separately in the Schools card above.
Census & demographics
- Census place
- Warren, MI
- County
- Macomb County · 638,552 people
- City population
- 114,937
- Metro
- Detroit-Warren-Dearborn, MI
- Population (ZIP)
- 30,696
- Household income
- $54,230
- Rent vs Own
- Severe rent burden
- 1296.0
Population outlook (Macomb County) Hauer SSP2
- Today (2025)
- 925,296 people
- By 2030
- 948,226 · +2.5%
- By 2040
- 983,961 · +6.3%
- By 2050
- 1,010,200 · +9.2%
- By 2075
- 1,076,222 · +16.3%
- By 2100
- 1,077,065 · +16.4%
Race, ethnicity, and origin ACS 2023
- Neighborhood character
- Diverse neighborhood (Simpson 0.68)
- Race & ethnicity
- White 47% Black 25% Asian 19% Two or more races 5% Hispanic / Latino 3% Native American 2%
- Common ancestry
- Romanian 7% Lithuanian 2% Slovak 1%
- Foreign-born
- 16% · Canada
- Languages at home
- 77% English-only · Other Indo-European 14% Other Asian/Pacific 3% Russian/Polish/Slavic 2%
Political lean MEDSL · Macomb
- 2024 margin
- R (+13.7) · D 42.2% · R 55.9% · Other 1.9%
- 2008→2024 swing
- -22.3pp toward R · 2008: 8.6pp · 2024: -13.7pp
- All cycles
- 2024: R+13.7 2020: R+8.1 2016: R+11.6 2012: D+4.0 2008: D+8.6
Not yet ingested
- Civics
- —
Market trends
- HPI YoY
- ▼ -199.66%
- Current HPI
- 177.9273
- Rent YoY
- ▲ 2.35%
- Metro
- Detroit-Warren-Dearborn, MI
- State GDP YoY
- ▲ 1.37%
- F500 in state
- 28
Industry mix (Fortune 500 HQ in MI)
| Industry | F500 HQs | Revenue |
|---|---|---|
| Automotive Parts | 3 | $48B |
|
||
| Automotive | 2 | $372B |
|
||
| Chemicals | 1 | $45B |
|
||
| Automotive Retail | 1 | $29B |
|
||
| Healthcare / Medical Devices | 1 | $23B |
|
||
| Automotive Technology | 1 | $20B |
|
||
Price history
+550.0% since first listed18 events — show timeline
- 2026-05-29 Pending — MiRealSource-MiMLS
- 2026-05-29 Pending — REALCOMP
- 2026-05-15 Listed $130,000 MiRealSource-MiMLS
- 2026-05-15 Listed $130,000 REALCOMP
- 2026-05-13 Coming Soon $130,000 MiRealSource-MiMLS
- 2025-11-10 Listing Removed — MiRealSource-MiMLS
- 2025-10-10 Price Changed $129,899 MiRealSource-MiMLS
- 2025-10-09 Price Changed $129,899 REALCOMP
- 2025-10-05 Relisted — REALCOMP
- 2025-10-05 Relisted — MiRealSource-MiMLS
- 2025-10-01 Contingent — REALCOMP
- 2025-10-01 Contingent — MiRealSource-MiMLS
- 2025-09-20 Listed $129,900 REALCOMP
- 2025-09-20 Listed $129,900 MiRealSource-MiMLS
- 2025-09-19 Coming Soon — MiRealSource-MiMLS
- 2003-10-07 Sold (Public Records) $55,000 Public Records
- 1997-05-22 Sold (Public Records) $25,000 Public Records
- 1991-07-03 Sold (Public Records) $20,000 Public Records
Property tax history
+1.5%/yrLatest (2025): $1,461 · +1.7% YoY. Source: county tax records.
Cash-flow waterfall
monthlySold comps — $/sqft
last 12 mo · ≤1 miLoading sold comps…