602 Crescent Dr · Ness City, KS
Flood risk No data
- FEMA flood zone
- —
- Chance of flooding over 30 yrs
- —
- Est. flood insurance / yr
- —
Fire risk No data
- Est. fire insurance / yr
- —
Heat risk No data
- Hot days now (above threshold)
- —
- Hot days in 30 yrs
- —
Wind risk No data
- Chance of severe wind over 30 yrs
- —
Air-quality risk No data
- Unhealthy air days now
- —
- Unhealthy air days in 30 yrs
- —
Risk factors via First Street. Map © Google.
Why this score? — see what drove the C grade
The composite is a weighted blend of 9 inputs, each scored 0–100. Each bar is that input's sub-score; the figure is the points it added to the 100-point composite (weight × sub-score).
- Cash flow +20.6/30.0
- ARV discount +7.5/15.0
- Appreciation +7.5/10.0
- DSCR +6.5/10.0
- 1% rule +5.4/10.0
- Livability +3.6/5.0
- Rent growth +2.5/5.0
- Condition / age +2.5/5.0
- Schools +1.4/10.0
$109,500
🖨 Deal sheet (PDF) 📄 Offer letter ✓ Due diligence
Listing remarks MLS
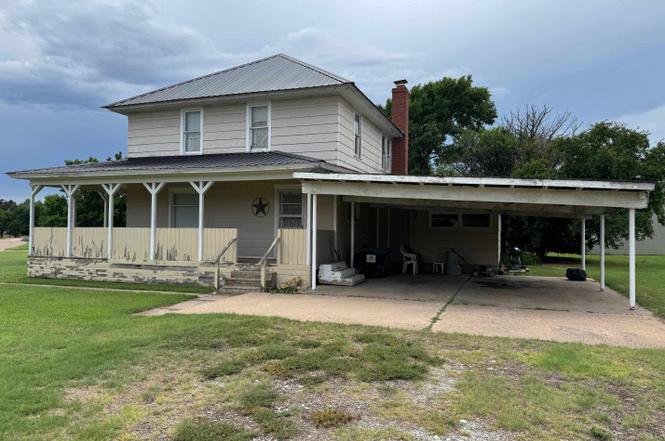
A spacious home on a large lot in the NW subdivision of Ness City. The home has beautiful woodwork throughout. With some TLC this home could easily become your dream home. Contact Tara @ 785~443~0385..
Key facts
- Original doors
- Large lot
- Beautiful woodwork
Tags
Property features AI
Exterior
- Utilities: Public water; Public sewer
- Home design: Single-story residential home; Entry level: 1
- Construction: Basement construction: Concrete
- Exterior features: Approximately 0.7-acre lot; Zoning: Other
Interior
- Bedrooms: Total of 8 rooms (bedroom count not specified)
- Heating & cooling: Central air
- Interior features: Window coverings; Concrete basement
Neighborhood map
What this means for you Summary
Snapshot
- This is a 4-bed/1.5-bath single-family listed at $110k.
Deal economics
- At list price, monthly cash flow is $145 ($2k/yr) — positive.
- The deal already cash-flows at list — no discount required.
- Meets the 1% rule at list price ($1k rent vs $110k).
- Recommended offer: $96k (12.0% below list) — sets the bar for market timing.
Location & tenants
- Location reads 72/100 on livability (#102 in KS) — a middle-class / working-renter tenant base. Strengths: cost of living A+, housing A+, health & safety A+; Watch: schools F, amenities F, commute F.
- Ness City (rural): math 6% / reading 15% proficiency, ranked #280 of 280 in KS (top 100%) — low school quality limits family demand, transient renter base, plan for 1-2y turnover.
- Market conditions: 13 active listings in the ZIP; 2 units permitted in Ness County in 2024 (0 in 5+ unit buildings).
Forward outlook
- In year one you build about $6k of equity ($757 loan paydown + $5k appreciation (5.0% local appreciation)).
- Ness County population projected to shrink 7% by 2050 — rents likely to lag national; underwrite the cash flow, not the appreciation.
- At projected returns (5.0% appreciation + 3.0% rent growth), your $31k cash investment doubles in ~4 years — after that, you're playing with house money.
- By year 6, paydown + projected appreciation supports a ~$33k cash-out refi (75% LTV) — recoverable capital for the next deal without selling this one.
Negotiation context
- It's been on market 346 days — a 12% lower offer ($96k) is reasonable based on typical stale-listing flexibility.
- 2 sale attempts since 12y ago with the ask held roughly flat each time — persistent listings suggest the price (not the market) is what's stuck; bring a comps-based counter.
- Current owner paid $66k; list at $110k implies a 67% gain — meaningful room to come down on a strong offer.
Risks & watch-outs
- Watch-outs: built in 1930 — expect roof / HVAC / electrical / plumbing capex.
Questions for the listing agent
- It's been on market 346 days. Have you received any prior offers? Is the seller open to a 12% concession, seller financing, or rate buy-down credit?
- Built in 1930 — when were the roof, HVAC, electrical panel, plumbing, and water heater last replaced?
- Why hasn't it sold? Are there any deal-killer items the seller is aware of (foundation, flood, title, zoning, code violations)?
- Is there a deadline driving the sale (1031 exchange, divorce, estate, relocation)? That informs how much negotiation room exists.
- Schools are F-rated, which usually means shorter tenancies and higher turnover. Who's the typical renter profile here, and what's been the actual vacancy rate?
- What's the average days-on-market for RENTAL listings here right now (not sales)? A rising rental-DOM trend means longer vacancies and softer asking-rent achievability than the comps imply.
- What's the recent tenant-quality profile in this submarket — average credit score on applications, eviction rate, late-payment / NSF rate, and stable-employment percentage? A property-management company in the area should have these aggregated.
- How much new for-sale + rental construction is in the pipeline within 1–3 miles? Heavy new supply typically softens prices + rents 12–24 months out; constrained supply supports both.
Investment metrics
- 1% rule
- 1.04% ✓
- Cap rate
- 7.89%
- Cash-on-cash
- 5.69%
- DSCR
- 1.25
- GRM
- 8.0
CMA / ARV
No comps found within radius.
Projected returns pro-forma
4.98% appreciation · 3.0% rent growth · sell at horizon
- IRR
- 17.7%
- Equity multiple
- 2.12×
- Total profit
- $34,416
- Equity at exit
- $61,940
- IRR
- 17.9%
- Equity multiple
- 4.14×
- Total profit
- $96,133
- Equity at exit
- $106,809
Cash invested: $30,660 (down + closing). Projections, not guarantees.
Landlord ↔ Tenant lean methodology
- Overall (STATE)
- 83 Strongly Landlord-Friendly
- State Kansas
- 83 Strongly Landlord-Friendly · R+10
- County
- — inherits STATE
- City
- — inherits STATE
ZIP-level market 67560
- Home prices YoY
- 2.8%
- Active inventory
- 13
- Price-to-rent
- 8.0×
Monthly cashflow live
- Estimated rent
- $1,142 medium interval (Pro) →
- Mortgage (P&I)
- −$574
- Tax est. 1.5%
- −$137 /mo · $1,642/yr
- Insurance
- −$46
- HOA
- −$0
- Vacancy / Maint / Mgmt
- −$240
- Net cashflow
- $145
Break-even live
Sensitivity live
| Price | -10% $221 | -5% $183 | +0% $145 | +5% $108 | +10% $70 |
|---|---|---|---|---|---|
| Rent | -10% $55 | -5% $100 | +0% $145 | +5% $191 | +10% $236 |
| Rate | -1.0pp $201 | -0.5pp $173 | base $145 | +0.5pp $117 | +1.0pp $88 |
UW: 25.0% down · 7.5% · 30yr · 1.5% tax · 5.0% vac · 8.0% maint · 8.0% mgmt
Financing live
Cash to close
- Down payment
- $27,375
- Closing costs
- $3,285
- Reserves months
- —
- Total cash needed
- —
Loan-product check · same deal, 3 products live
Conventional
25% down · 7.5% · 30yr
- Down + closing
- —
- Monthly P&I
- —
- Monthly cashflow
- —
- DSCR
- —
- Eligible?
- —
Personal DTI + credit; lowest rate.
DSCR
20% down · 8.5% · 30yr
- Down + closing
- —
- Monthly P&I
- —
- Monthly cashflow
- —
- DSCR
- —
- Eligible?
- —
No personal income docs; deal must DSCR.
Hard money
10% down · 12.0% · 12mo
- Down + closing
- —
- Monthly P&I
- —
- Monthly cashflow
- —
- DSCR
- —
- Eligible?
- —
Short-term bridge; refi at stabilization.
Listing history 24 events
-
2026-06-21days on market $109,500 Active 346 DOM
-
2026-06-21days on market $109,500 Active 345 DOM
-
2026-06-18days on market $109,500 Active 343 DOM
-
2026-06-17days on market $109,500 Active 342 DOM
-
2026-06-16days on market $109,500 Active 341 DOM
-
2026-06-15days on market $109,500 Active 340 DOM
-
2026-06-13days on market $109,500 Active 338 DOM
-
2026-06-12days on market $109,500 Active 337 DOM
-
2026-06-09days on market $109,500 Active 334 DOM
-
2026-06-08days on market $109,500 Active 333 DOM
-
2026-06-07days on market $109,500 Active 332 DOM
-
2026-06-05days on market $109,500 Active 330 DOM
-
2026-06-04days on market $109,500 Active 328 DOM
-
2026-06-02days on market $109,500 Active 327 DOM
-
2026-06-01days on market $109,500 Active 326 DOM
-
2026-05-31days on market $109,500 Active 325 DOM
-
2026-05-31days on market $109,500 Active 324 DOM
-
2025-09-21price $109,500
-
2025-07-10$114,500 Active
-
2015-09-23soldstatus 201-char remark
Show marketing remark (201 chars)
A spacious home on a large lot in the NW subdivision of Ness City. The home has beautiful woodwork throughout. With some TLC this home could easily become your dream home. Contact Tara @ 785~443~0385..
-
2014-06-30$79,995 201-char remark
Show marketing remark (201 chars)
A spacious home on a large lot in the NW subdivision of Ness City. The home has beautiful woodwork throughout. With some TLC this home could easily become your dream home. Contact Tara @ 785~443~0385..
-
2008-05-01soldstatus $65,500
-
2008-05-01soldstatus $65,500
-
2007-06-01soldstatus $60,000
ⓘ Source: listings_history table (triggers on properties + properties_extension) + one-shot
backfill from property_details.listing_events for pre-trigger history.
Nearby sold comps map
Loading sold comps map…
Walkable amenities ~0.75 mi
Loading nearby amenities…
Taxation est. · year 1
- Rental income
- $13,704
- − Mortgage interest
- −$6,134
- − Property taxes
- −$1,642
- − Insurance
- −$548
- − Repairs & maintenance
- −$1,096
- − Management
- −$1,096
- − Depreciation
- −$3,185
- Taxable income
- $3
- Est. tax owed @ 24.0%
- −$1
- After-tax cash flow
- $1,745/yr
For passive investors: Depreciation is non-cash, so a rental often shows a tax loss while cash-flowing — sheltering income. Rental losses are passive: they offset passive income freely, and up to $25,000/yr can offset ordinary (W-2) income if you actively participate and your MAGI is under $100k (phasing out to $0 by $150k); unused losses carry forward. On sale, claimed depreciation is recaptured at up to 25%, and gains may owe capital-gains tax (a 1031 exchange can defer both). Figures are a year-1 estimate at your 24.0% rate — not tax advice; consult a CPA.
Schools (NCES district)
- District
- Ness City
- NCES district ID
- 2009930
- Math proficiency
- 6% ▬ 0.00%
- Reading proficiency
- 15% ▬ 0.00%
- Median HH income
- $50,444
- Composite
- 13.7/100
- National rank
- #14479
- State rank
- #280 of 280 in KS
Livability — Ness City
- Score
- 72/100
- State rank
- #102
- US rank
- #5791
Category grades
Schools grade is shown separately in the Schools card above.
Census & demographics
- Census place
- Ness City, KS
- Population (ZIP)
- 1,394
Population outlook (Ness County) Hauer SSP2
- Today (2025)
- 2,917 people
- By 2030
- 2,867 · -1.7%
- By 2040
- 2,757 · -5.5%
- By 2050
- 2,724 · -6.6%
- By 2075
- 2,875 · -1.4%
- By 2100
- 2,943 · +0.9%
Race, ethnicity, and origin ACS 2023
- Neighborhood character
- Predominantly White (81%)
- Race & ethnicity
- White 81% Hispanic / Latino 13% Two or more races 8%
- Hispanic origin (detail)
- Mexican 12%
- Common ancestry
- Scotch-Irish 4% Slovak 2% Lithuanian 2%
- Foreign-born
- 10% · Canada
- Languages at home
- 88% English-only · Spanish 10% German/W. Germanic 1%
Political lean MEDSL · Ness
- 2024 margin
- Solid R (+79.0) · D 9.5% · R 88.4% · Other 2.1%
- 2008→2024 swing
- -18.8pp toward R · 2008: -60.2pp · 2024: -79.0pp
- All cycles
- 2024: R+79.0 2020: R+78.5 2016: R+73.6 2012: R+69.1 2008: R+60.2
Not yet ingested
- Civics
- —
Market trends
- HPI YoY
- ▲ 4.98%
- Current HPI
- 186.2048
- Rent YoY
- —
- Metro
- —
- State GDP YoY
- —
- F500 in state
- 0
Price history
+82.5% since first listed7 events — show timeline
- 2025-09-21 Price Changed $109,500 Hays MLS
- 2025-07-10 Listed $114,500 Hays MLS
- 2015-09-23 Sold (MLS) — Hays MLS
- 2014-06-30 Listed $79,995 Hays MLS
- 2008-05-01 Sold (Public Records) $65,500 Public Records
- 2008-05-01 Sold (Public Records) $65,500 Public Records
- 2007-06-01 Sold (Public Records) $60,000 Public Records
Cash-flow waterfall
monthlySold comps — $/sqft
last 12 mo · ≤1 miLoading sold comps…