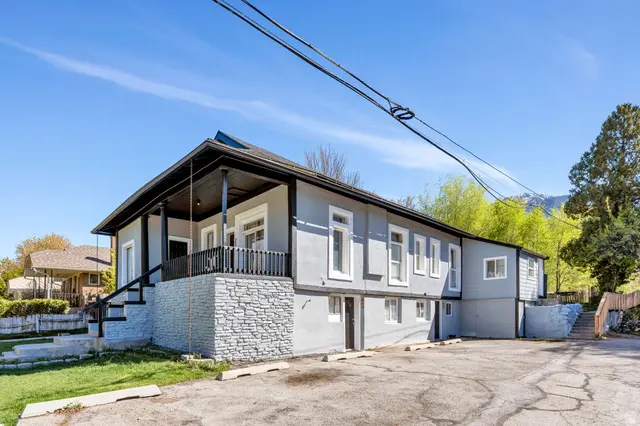
 6-Plex
441 S 500 E · Provo, UT
Flood risk 6/10 · Moderate
- FEMA flood zone
- X (unshaded)
- Chance of flooding over 30 yrs
- 0.75%
- Est. flood insurance / yr
- $473 – $860
Fire risk 4/10 · Minor
- Est. fire insurance / yr
- $453 – $841
Heat risk 5/10 · Moderate
- Hot days now (above 95°F)
- 8 days/yr
- Hot days in 30 yrs
- 24 days/yr
Wind risk 1/10 · Minimal
- Chance of severe wind over 30 yrs
- —
Air-quality risk 6/10 · Moderate
- Unhealthy air days now
- 10 days/yr
- Unhealthy air days in 30 yrs
- 10 days/yr
Risk factors via First Street. Map © Google.
Why this score? — see what drove the C+ grade
The composite is a weighted blend of 9 inputs, each scored 0–100. Each bar is that input's sub-score; the figure is the points it added to the 100-point composite (weight × sub-score).
- Cash flow +25.7/30.0
- DSCR +8.6/10.0
- ARV discount +7.5/15.0
- 1% rule +5.6/10.0
- Livability +4.2/5.0
- Schools +3.5/10.0
- Rent growth +3.1/5.0
- Condition / age +2.5/5.0
- Appreciation +0.0/10.0
$949,000
🖨 Deal sheet 📄 Offer letter ✓ Due diligence
Multi-family units
County records classify this as Multi-Family (5+ Unit). Listing-text estimate: 6 units. confirmed
5+ unit building — per-unit beds/baths from public records are typically unavailable; the breakdown below (if shown) is an estimate from the listing text.
Listing remarks MLS
SIGNIFICANT VALUE-ADD, CASH COW 6-PLEX OPPORTUNITY in Provo, BYU market, with an approximate 6% cap potential simply by increasing rents (which are BELOW MARKET)! UPDATED: kitchens, bathrooms, flooring, fixtures, with recent exterior improvements to paint, siding, & window sealing! Check out the pictures: NOT your "average" 6-plex. Tenants enjoy use of a secure, free laundry area in basement. Additional income opportunity also available through managing utilities differently (units metered separately!). LOCATION: near BYU, with quick access to I-15 & Provo downtown entertainment, restaurants, & shopping. Purchase the neighboring 6-plex (same seller) for operational efficiencies! 5 1-bed units; 1 2-bed unit. Square footage per county records. Buyer/agent to verify all. Do not disturb tenants; offer subject to inspection.
Key facts
- 6 plex opportunity
- Quick access to i 15
- 8,276 sq ft lot
Tags
Neighborhood map
What this means for you Summary
Snapshot
- This is a 6 × 7-bed/6.0-bath units multifamily listed at $949k.
Deal economics
- At list price, monthly cash flow is $2k ($27k/yr) — positive. Per door: $378/mo.
- The deal already cash-flows at list — no discount required.
- Meets the 1% rule at list price ($10k rent vs $949k).
- Recommended offer: $935k (1.5% below list) — sets the bar for market timing.
Location & tenants
- Location reads 85/100 on livability (#15 in UT, #602 nationally) — a professional / high-income tenant draw. Strengths: amenities A+, commute A+, health & safety A.
- Provo District (urban): math 38% / reading 46% proficiency, ranked #44 of 80 in UT (top 55%) — families likely to look elsewhere, expect single-tenant / working-renter base with shorter leases.
- Market conditions: Rents rising (+2.2%/yr); 130 active listings in the ZIP; 1 comparable units currently listed for rent nearby; 6,326 units permitted in Utah County in 2024 (1,053 in 5+ unit buildings).
- At $10,033/mo this rent would consume 228% of the median local household income ($53k/yr) (locally 1982% of renters already pay >50% of income on rent) — very limited rent-growth headroom before tenants either downsize or default.
Forward outlook
- Local home prices are declining (-3.0%/yr); year-one equity from $7k of loan paydown is wiped out by about $28k of value loss. Plan a longer hold.
- Utah County population projected at +49% by 2050 — long-run rental-demand tailwind backs the buy-and-hold thesis.
Negotiation context
- It's been on market 22 days — a 2% lower offer ($935k) is reasonable based on typical stale-listing flexibility.
- 4 sale attempts since 21y ago; this cycle's ask has dropped $101k (10%) from the opening price — seller is motivated, your offer sets the floor, not the list.
- Current owner paid $322k; list at $949k implies a 194% gain — meaningful room to come down on a strong offer.
Risks & watch-outs
- Watch-outs: built in 1925 — expect roof / HVAC / electrical / plumbing capex.
- Climate carrying-cost: major flood risk; extreme-heat days projected 8→24/yr by 2055 (HVAC capex compounding) — expect insurance premiums to compound above CPI over the hold.
Questions for the listing agent
- Can we see the unit-by-unit rent roll, current vacancy, and any below-market leases? What's the average tenancy length?
- What capital expenditures (roof, boiler, parking lot, exteriors) have been made in the last 5 years, and what's planned in the next 2?
- Built in 1925 — when were the roof, HVAC, electrical panel, plumbing, and water heater last replaced?
- Is there a deadline driving the sale (1031 exchange, divorce, estate, relocation)? That informs how much negotiation room exists.
- What's the average days-on-market for RENTAL listings here right now (not sales)? A rising rental-DOM trend means longer vacancies and softer asking-rent achievability than the comps imply.
- What's the recent tenant-quality profile in this submarket — average credit score on applications, eviction rate, late-payment / NSF rate, and stable-employment percentage? A property-management company in the area should have these aggregated.
- How much new apartment / multifamily construction is in the pipeline within 1–3 miles? Heavy new supply (>2% of stock underway) typically softens rents 12–24 months out; light construction supports rent growth.
Investment metrics
- 1% rule
- 1.06% ✓
- Cap rate
- 9.16%
- Cash-on-cash
- 10.24%
- DSCR
- 1.46
- GRM
- 7.9
CMA / ARV
No comps found within radius.
Projected returns pro-forma
-3.0% appreciation · 2.2% rent growth · sell at horizon
- IRR
- -1.8%
- Equity multiple
- 0.93×
- Total profit
- $-17,807
- Equity at exit
- $141,499
- IRR
- 7.1%
- Equity multiple
- 1.51×
- Total profit
- $136,432
- Equity at exit
- $82,052
Cash invested: $265,720 (down + closing). Projections, not guarantees.
Landlord ↔ Tenant lean methodology
- Overall (STATE)
- 86 Strongly Landlord-Friendly
- State Utah
- 86 Strongly Landlord-Friendly · R+15
- County
- — inherits STATE
- City
- — inherits STATE
ZIP-level market 84606
- Rents YoY
- 2.2%
- Active inventory
- 130
- Price-to-rent
- 47.3×
Monthly cashflow live
- Estimated rent
- $10,033 medium interval (Pro) →
- Mortgage (P&I)
- −$4,977
- Tax from tax record
- −$287 /mo · $3,444/yr
- Insurance
- −$395
- HOA
- −$0
- Vacancy / Maint / Mgmt
- −$2,107
- Net cashflow
- $2,267
Break-even live
6-unit breakdown (identical units grouped — click to expand)
| Units | Beds | Baths | Est. rent |
|---|---|---|---|
| 6× units | 7 | 6 | $10,032 |
| #1 | 7 | 6 | $1,672 |
| #2 | 7 | 6 | $1,672 |
| #3 | 7 | 6 | $1,672 |
| #4 | 7 | 6 | $1,672 |
| #5 | 7 | 6 | $1,672 |
| #6 | 7 | 6 | $1,672 |
| Total (6 units) | $10,033 | ||
UW: 25.0% down · 7.5% · 30yr · 1.5% tax · 5.0% vac · 8.0% maint · 8.0% mgmt
Financing live
Cash to close
- Down payment
- $237,250
- Closing costs
- $28,470
- Reserves months
- —
- Total cash needed
- —
Loan-product check · same deal, 3 products live
Conventional
25% down · 7.5% · 30yr
- Down + closing
- —
- Monthly P&I
- —
- Monthly cashflow
- —
- DSCR
- —
- Eligible?
- —
Personal DTI + credit; lowest rate.
DSCR
20% down · 8.5% · 30yr
- Down + closing
- —
- Monthly P&I
- —
- Monthly cashflow
- —
- DSCR
- —
- Eligible?
- —
No personal income docs; deal must DSCR.
Hard money
10% down · 12.0% · 12mo
- Down + closing
- —
- Monthly P&I
- —
- Monthly cashflow
- —
- DSCR
- —
- Eligible?
- —
Short-term bridge; refi at stabilization.
Rent comps 1 comps
| Address | Beds | Baths | Sqft | Rent | $/sqft | DOM | Units | Dist |
|---|---|---|---|---|---|---|---|---|
| 1034 Cinnamon Ridge Ln Provo, UT | 5.0 | 3.5 | 3000 | $2,900 | $0.97 | 14d | 1 | 0.93mi |
Listing history 26 events
-
2026-06-19price $949,000 Active 22 DOM
-
2026-06-18days on market $999,000 Active 22 DOM
-
2026-06-17days on market $999,000 Active 21 DOM
-
2026-06-16days on market $999,000 Active 20 DOM
-
2026-06-15days on market $999,000 Active 19 DOM
-
2026-06-14days on market $999,000 Active 17 DOM
-
2026-06-10days on market $999,000 Active 14 DOM
-
2026-06-09days on market $999,000 Active 13 DOM
-
2026-06-08days on market $999,000 Active 12 DOM
-
2026-06-07days on market $999,000 Active 11 DOM
-
2026-06-03days on market $999,000 Active 7 DOM
-
2026-06-02days on market $999,000 Active 6 DOM
-
2026-06-01days on market $999,000 Active 5 DOM
-
2026-05-31days on market $999,000 Active 4 DOM
-
2026-05-31days on market $999,000 Active 3 DOM
-
2026-04-13price $999,000 857-char remark
Show marketing remark (857 chars)
SIGNIFICANT VALUE-ADD, CASH COW 6-PLEX OPPORTUNITY in Provo, BYU market, with an approximate 6% cap potential simply by increasing rents (which are BELOW MARKET)! UPDATED: kitchens, bathrooms, flooring, fixtures, with recent exterior improvements to paint, siding, & window sealing! Check out the pictures: NOT your "average" 6-plex. Tenants enjoy use of a secure, free laundry area in basement. Additional income opportunity also available through managing utilities differently (units metered separately!). LOCATION: near BYU, with quick access to I-15 & Provo downtown entertainment, restaurants, & shopping. Purchase the neighboring 6-plex (same seller) for operational efficiencies! 5 1-bed units; 1 2-bed unit. Square footage per county records. Buyer/agent to verify all. Do not disturb tenants; offer subject to inspection.
-
2026-02-12$1,050,000 Active 857-char remark
Show marketing remark (857 chars)
SIGNIFICANT VALUE-ADD, CASH COW 6-PLEX OPPORTUNITY in Provo, BYU market, with an approximate 6% cap potential simply by increasing rents (which are BELOW MARKET)! UPDATED: kitchens, bathrooms, flooring, fixtures, with recent exterior improvements to paint, siding, & window sealing! Check out the pictures: NOT your "average" 6-plex. Tenants enjoy use of a secure, free laundry area in basement. Additional income opportunity also available through managing utilities differently (units metered separately!). LOCATION: near BYU, with quick access to I-15 & Provo downtown entertainment, restaurants, & shopping. Purchase the neighboring 6-plex (same seller) for operational efficiencies! 5 1-bed units; 1 2-bed unit. Square footage per county records. Buyer/agent to verify all. Do not disturb tenants; offer subject to inspection.
-
2011-04-29soldstatus 31-char remark
Show marketing remark (31 chars)
There are no remarks available.
-
2011-03-21$175,000 31-char remark
Show marketing remark (31 chars)
There are no remarks available.
-
2011-02-25soldstatus $322,290
-
2010-09-15historical
-
2010-01-16$475,000
-
2005-09-07soldstatus
-
2005-09-07soldstatus
-
2005-08-03historical
-
2005-02-03$274,900
ⓘ Source: listings_history table (triggers on properties + properties_extension) + one-shot
backfill from property_details.listing_events for pre-trigger history.
Tax reassessment forecast UT · Resets to sale price
- Current annual tax
- $3,444 · $287/mo
- Projected year-2 tax
- $6,263 · $522/mo
- Expected delta
- +$2,819/yr (+$235/mo · 81.9%)
ⓘ Screening estimate from a state-policy table — verify with the county assessor before closing.
Climate risk First Street
- Flood 6/10 Major FEMA zone X (unshaded) · 75% chance over 30 yrs
- Wildfire 4/10 Moderate
- Heat 5/10 Major 8 d/yr ≥95°F today · 24 d/yr by 30 yrs out
- Wind 1/10 Low
- Air quality 6/10 Major 10 unhealthy d/yr today · 10 by 30 yrs out
Nearby sold comps map
Loading sold comps map…
Walkable amenities ~0.75 mi
Loading nearby amenities…
Taxation est. · year 1
- Rental income
- $120,396
- − Mortgage interest
- −$53,159
- − Property taxes
- −$3,444
- − Insurance
- −$4,745
- − Repairs & maintenance
- −$9,632
- − Management
- −$9,632
- − Depreciation
- −$27,607
- Taxable income
- $12,178
- Est. tax owed @ 24.0%
- −$2,923
- After-tax cash flow
- $24,281/yr
For passive investors: Depreciation is non-cash, so a rental often shows a tax loss while cash-flowing — sheltering income. Rental losses are passive: they offset passive income freely, and up to $25,000/yr can offset ordinary (W-2) income if you actively participate and your MAGI is under $100k (phasing out to $0 by $150k); unused losses carry forward. On sale, claimed depreciation is recaptured at up to 25%, and gains may owe capital-gains tax (a 1031 exchange can defer both). Figures are a year-1 estimate at your 24.0% rate — not tax advice; consult a CPA.
Schools (NCES district)
- District
- Provo District
- NCES district ID
- 4900810
- Math proficiency
- 38% ▼ -10.00%
- Reading proficiency
- 46% ▼ -6.00%
- Median HH income
- $40,698
- Composite
- 35.24/100
- National rank
- #4980
- State rank
- #44 of 80 in UT
Livability — Provo
- Score
- 85/100
- State rank
- #15
- US rank
- #602
Category grades
Schools grade is shown separately in the Schools card above.
Census & demographics
- Census place
- Provo, UT
- County
- Utah County · 661,754 people
- City population
- 112,727
- Metro
- Provo-Orem, UT
- Population (ZIP)
- 35,690
- Household income
- $52,811
- Rent vs Own
- Severe rent burden
- 1982.0
Population outlook (Utah County) Hauer SSP2
- Today (2025)
- 693,420 people
- By 2030
- 757,324 · +9.2%
- By 2040
- 893,178 · +28.8%
- By 2050
- 1,035,842 · +49.4%
- By 2075
- 1,376,733 · +98.5%
- By 2100
- 1,609,388 · +132.1%
Race, ethnicity, and origin ACS 2023
- Neighborhood character
- Predominantly White (71%)
- Race & ethnicity
- White 71% Hispanic / Latino 16% Two or more races 12% Asian 2% Pacific Islander 1% Black 1%
- Hispanic origin (detail)
- Mexican 10% Puerto Rican 1%
- Common ancestry
- Italian 4% Slovak 4% Portuguese 2%
- Foreign-born
- 12% · Canada, South Korea, Jamaica
- Languages at home
- 72% English-only · Spanish 18% Other Indo-European 3% Other Asian/Pacific 2%
Political lean MEDSL · Utah
- 2024 margin
- Solid R (+39.8) · D 28.5% · R 68.3% · Other 3.2%
- 2008→2024 swing
- +19.1pp toward D · 2008: -58.9pp · 2024: -39.8pp
- All cycles
- 2024: R+39.8 2020: R+41.0 2016: R+37.3 2012: R+78.5 2008: R+58.9
Not yet ingested
- Civics
- —
Market trends
- HPI YoY
- ▼ -273.12%
- Current HPI
- 282.591
- Rent YoY
- ▲ 2.20%
- Metro
- Provo-Orem, UT
- State GDP YoY
- ▲ 3.54%
- F500 in state
- 2
Industry mix (Fortune 500 HQ in UT)
| Industry | F500 HQs | Revenue |
|---|---|---|
| Financial Services | 1 | $3B |
|
||
Price history
+263.4% since first listed11 events — show timeline
- 2026-04-13 Price Changed $999,000 WFRMLS
- 2026-02-12 Listed $1,050,000 WFRMLS
- 2011-04-29 Sold (MLS) — WFRMLS
- 2011-03-21 Listed $175,000 WFRMLS
- 2011-02-25 Sold (Public Records) $322,290 Public Records
- 2010-09-15 Listing Removed — WFRMLS
- 2010-01-16 Listed $475,000 WFRMLS
- 2005-09-07 Sold (Public Records) — Public Records
- 2005-09-07 Sold (Public Records) — Public Records
- 2005-08-03 Listing Removed — WFRMLS
- 2005-02-03 Listed $274,900 WFRMLS
Property tax history
+6.1%/yrLatest (2025): $3,444 · -4.1% YoY. Source: county tax records.
Cash-flow waterfall
monthlySold comps — $/sqft
last 12 mo · ≤1 miLoading sold comps…