 🏷️ Likely Rental
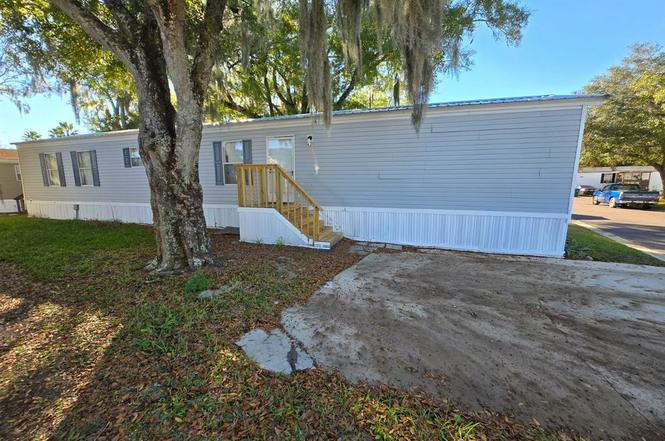
7915 103rd St · Jacksonville, FL
Flood risk No data
- FEMA flood zone
- —
- Chance of flooding over 30 yrs
- —
- Est. flood insurance / yr
- —
Fire risk No data
- Est. fire insurance / yr
- —
Heat risk No data
- Hot days now (above threshold)
- —
- Hot days in 30 yrs
- —
Wind risk No data
- Chance of severe wind over 30 yrs
- —
Air-quality risk No data
- Unhealthy air days now
- —
- Unhealthy air days in 30 yrs
- —
Risk factors via First Street. Map © Google.
Why this score? — see what drove the D+ grade
The composite is a weighted blend of 9 inputs, each scored 0–100. Each bar is that input's sub-score; the figure is the points it added to the 100-point composite (weight × sub-score).
- Cash flow +15.0/30.0
- ARV discount +7.5/15.0
- 1% rule +5.0/10.0
- DSCR +5.0/10.0
- Livability +4.2/5.0
- Schools +3.9/10.0
- Rent growth +3.0/5.0
- Condition / age +2.5/5.0
- Appreciation +0.0/10.0
$35,000
🖨 Deal sheet 📄 Offer letter ✓ Due diligence
Listing remarks
3 bedrooms / 2 bathroom Located in a clean, affordable park Home may remain in the park or be moved Transport assistance available (contact for quote) Clear title in hand Fast closing available Home comes with furniture and BRAND NEW ROOF! Nice large living area and spacious bedrooms. Lot rent: $680/month Price: $45000 priced to sell Serious buyers only. Message for details or to schedule a tour.
Key facts
- Brand new roof
- Clear title
- 1 acre lot
Tags
Property features AI
Exterior
- Home design: House
- Construction: Approximately 1,152 square feet
- Exterior features: Property sits on a 1-acre lot
Neighborhood map
What this means for you Summary
Snapshot
- This is a 3-bed/8.0-bath single-family listed at $35k.
Deal economics
- At list price, monthly cash flow is $1k ($13k/yr) — positive.
- The deal already cash-flows at list — no discount required.
- Meets the 1% rule at list price ($2k rent vs $35k).
- Recommended offer: $31k (12.0% below list) — sets the bar for market timing.
- Cap rate 42.3% vs local median 4.0% in Jacksonville — top-decile yield for the area; either an underpriced asset or a hidden risk that comps aren't pricing in. Stress-test before assuming the spread holds.
Location & tenants
- Location reads 83/100 on livability (#50 in FL, #911 nationally) — a professional / high-income tenant draw. Strengths: amenities A+, commute A+, housing A+.
- Duval (urban): math 46% / reading 45% proficiency, ranked #48 of 73 in FL (top 66%) — families likely to look elsewhere, expect single-tenant / working-renter base with shorter leases.
- Market conditions: Rents rising (+2.1%/yr); 441 active listings in the ZIP; 40 comparable units currently listed for rent nearby; rentals at typical pace (median 17d on market — plan ~3-4 weeks tenant-placement turnaround); 6,503 units permitted in Duval County in 2024 (1,131 in 5+ unit buildings).
- This rent runs 32% of the median local income ($61k/yr) — at the standard rent-burdened threshold; future hikes will face affordability resistance.
Forward outlook
- Local home prices are declining (-3.0%/yr); year-one equity from $242 of loan paydown is wiped out by about $1k of value loss. Plan a longer hold.
- Duval County population projected at +19% by 2050 — long-run rental-demand tailwind backs the buy-and-hold thesis.
- At projected returns (-3.0% appreciation + 2.1% rent growth), your $10k cash investment doubles in ~1 year — after that, you're playing with house money.
Negotiation context
- It's been on market 178 days — a 12% lower offer ($31k) is reasonable based on typical stale-listing flexibility.
- 2 sale attempts since 22y ago; this cycle's ask has dropped $10k (22%) from the opening price — seller is motivated, your offer sets the floor, not the list.
Questions for the listing agent
- It's been on market 178 days. Have you received any prior offers? Is the seller open to a 12% concession, seller financing, or rate buy-down credit?
- Why hasn't it sold? Are there any deal-killer items the seller is aware of (foundation, flood, title, zoning, code violations)?
- Is there a deadline driving the sale (1031 exchange, divorce, estate, relocation)? That informs how much negotiation room exists.
- Schools are B-rated — typically a magnet for longer-tenancy family renters. What's the average tenant stay here, and is there a school-zone premium baked into asking?
- The area grade is low — what's the realistic commute time and amenity access for the typical tenant pool here? Any planned neighborhood developments (good or bad) we should know about?
- What's the average days-on-market for RENTAL listings here right now (not sales)? A rising rental-DOM trend means longer vacancies and softer asking-rent achievability than the comps imply.
- What's the recent tenant-quality profile in this submarket — average credit score on applications, eviction rate, late-payment / NSF rate, and stable-employment percentage? A property-management company in the area should have these aggregated.
- How much new for-sale + rental construction is in the pipeline within 1–3 miles? Heavy new supply typically softens prices + rents 12–24 months out; constrained supply supports both.
Investment metrics
- 1% rule
- 4.67% ✓
- Cap rate
- 42.26%
- Cash-on-cash
- 128.47%
- DSCR
- 6.72
- GRM
- 1.8
CMA / ARV
- ARV (on-the-fly)
- $297,528
- Comps found
- 12
Show comp detail 12 sales within ~0.75 mi
| Address | Dist | Beds/Ba | Sqft | Sold | Price | $/sf | Match |
|---|---|---|---|---|---|---|---|
| 8104 McGlothlin St | 0.28mi | 2/1.0 (-1) | 1,888 (+2%) | 5mo | $112,000 | $59 | 59 |
| 7959 Lancia St N | 0.33mi | 4/1.0 (+1) | 1,680 (-9%) | 1mo | $250,000 | $149 | 49 |
| 7860 Falcon St | 0.32mi | 3/2.0 | 1,682 (-9%) | 2mo | $260,000 | $155 | 48 |
| 7843 Lancia St N | 0.35mi | 4/2.0 (+1) | 1,640 (-11%) | 1mo | $274,000 | $167 | 44 |
| 8279 Newport Rd Rd | 0.61mi | 4/2.0 (+1) | 1,840 (-0%) | 10mo | $220,000 | $120 | 42 |
| 4596 Prosperity Way | 0.66mi | 3/2.0 | 1,771 (-4%) | 2mo | $310,000 | $175 | 41 |
| 8263 Caravelle Dr | 0.69mi | 4/2.5 (+1) | 1,855 (+0%) | 8mo | $325,000 | $175 | 41 |
| 8219 Vining St | 0.47mi | 4/2.5 (+1) | 1,665 (-10%) | 3mo | $290,598 | $175 | 39 |
| 7856 Jaguar Dr | 0.52mi | 3/2.0 | 1,690 (-8%) | 5mo | $155,000 | $92 | 38 |
| 8194 Caravelle Dr | 0.69mi | 4/3.0 (+1) | 1,894 (+2%) | 10mo | $305,000 | $161 | 36 |
| 5822 Rover Dr | 0.61mi | 3/2.0 | 1,736 (-6%) | 9mo | $187,000 | $108 | 34 |
| 8244 Newport Rd | 0.66mi | 3/2.5 | 1,632 (-12%) | 12mo | $309,000 | $189 | 20 |
Match score weights: distance 35% · size 25% · config 20% · recency 20%. Top-matched comps best support the ARV.
Projected returns pro-forma
-3.0% appreciation · 2.11% rent growth · sell at horizon
- IRR
- —
- Equity multiple
- 7.09×
- Total profit
- $59,724
- Equity at exit
- $5,219
- IRR
- —
- Equity multiple
- 14.50×
- Total profit
- $132,304
- Equity at exit
- $3,026
Cash invested: $9,800 (down + closing). Projections, not guarantees.
Landlord ↔ Tenant lean methodology
- Overall (STATE)
- 87 Strongly Landlord-Friendly
- State Florida
- 87 Strongly Landlord-Friendly · R+3
- County
- — inherits STATE
- City
- — inherits STATE
ZIP-level market 32210
- Rents YoY
- 2.1%
- Active inventory
- 441
- Price-to-rent
- 1.8×
Monthly cashflow live
- Estimated rent
- $1,634 high interval (Pro) →
- Mortgage (P&I)
- −$184
- Tax est. 1.5%
- −$44 /mo · $525/yr
- Insurance
- −$15
- HOA
- −$0
- Vacancy / Maint / Mgmt
- −$343
- Net cashflow
- $1,049
Break-even live
Sensitivity live
| Price | -10% $1,073 | -5% $1,061 | +0% $1,049 | +5% $1,037 | +10% $1,025 |
|---|---|---|---|---|---|
| Rent | -10% $920 | -5% $985 | +0% $1,049 | +5% $1,114 | +10% $1,178 |
| Rate | -1.0pp $1,067 | -0.5pp $1,058 | base $1,049 | +0.5pp $1,040 | +1.0pp $1,031 |
UW: 25.0% down · 7.5% · 30yr · 1.5% tax · 5.0% vac · 8.0% maint · 8.0% mgmt
Financing live
Cash to close
- Down payment
- $8,750
- Closing costs
- $1,050
- Reserves months
- —
- Total cash needed
- —
Loan-product check · same deal, 3 products live
Conventional
25% down · 7.5% · 30yr
- Down + closing
- —
- Monthly P&I
- —
- Monthly cashflow
- —
- DSCR
- —
- Eligible?
- —
Personal DTI + credit; lowest rate.
DSCR
20% down · 8.5% · 30yr
- Down + closing
- —
- Monthly P&I
- —
- Monthly cashflow
- —
- DSCR
- —
- Eligible?
- —
No personal income docs; deal must DSCR.
Hard money
10% down · 12.0% · 12mo
- Down + closing
- —
- Monthly P&I
- —
- Monthly cashflow
- —
- DSCR
- —
- Eligible?
- —
Short-term bridge; refi at stabilization.
Rent comps 40 comps
| Address | Beds | Baths | Sqft | Rent | $/sqft | DOM | Units | Dist |
|---|---|---|---|---|---|---|---|---|
| 7880 Playschool Ln Jacksonville, FL | 3.0 | 2.5 | 1339 | $1,495 | $1.12 | 16d | 1 | 0.20mi |
| 7840 Playschool Ln Jacksonville, FL | 3.0 | 2.5 | 1339 | $1,398 | $1.04 | 15d | 1 | 0.22mi |
| 7851 Playschool Ln Jacksonville, FL | 3.0 | 3.0 | 1508 | $1,600 | $1.06 | 24d | 1 | 0.24mi |
| 7800 Playschool Ln Jacksonville, FL | 3.0 | 2.5 | 1339 | $1,361 | $1.02 | 15d | 1 | 0.25mi |
| 7796 Playschool Ln Jacksonville, FL | 3.0 | 2.5 | 1339 | $1,375 | $1.03 | 24d | 1 | 0.25mi |
| 8050 103rd St Jacksonville, FL | 1.0–3.0 | 1.0–2.0 | 1025 | $1,575 | $1.54 | 2d | 11 | 0.25mi |
| 4706 Playpen Dr Jacksonville, FL | 2.0 | 2.5 | 1330 | $1,321 | $0.99 | 8d | 1 | 0.27mi |
| 7911 Melvin Rd Jacksonville, FL | 3.0 | 2.5 | 1471 | $1,740 | $1.18 | 2d | 1 | 0.29mi |
| 7875 Melvin Rd Jacksonville, FL | 3.0 | 2.5 | 1464 | $1,650 | $1.13 | 4d | 1 | 0.32mi |
| 4781 Playschool Dr Jacksonville, FL | 3.0 | 2.5 | 1548 | $1,495 | $0.97 | 8d | 1 | 0.33mi |
| 7901 Austin Rd Jacksonville, FL | 3.0 | 2.0 | 1268 | $1,815 | $1.43 | 24d | 1 | 0.38mi |
| 7707 Falcon St Jacksonville, FL | 4.0 | 2.0 | 1300 | $2,000 | $1.54 | 17d | 1 | 0.39mi |
| 7948 Austin Rd Jacksonville, FL | 3.0 | 2.0 | 1335 | $1,775 | $1.33 | 4d | 1 | 0.41mi |
| 8180 Metto Rd Jacksonville, FL | 4.0 | 2.5 | 1665 | $1,859 | $1.12 | 16d | 1 | 0.43mi |
| 7947 Renault Dr Jacksonville, FL | 3.0 | 2.0 | 1285 | $1,500 | $1.17 | 17d | 1 | 0.43mi |
| 8121 Cheryl Ann Ln Unit Le Sabre Townhouse Jacksonville, FL | 3.0 | 2.5 | 1601 | $1,950 | $1.22 | 4d | 1 | 0.49mi |
| 7559 Proxima Rd Jacksonville, FL | 3.0 | 2.0 | 1308 | $1,499 | $1.15 | 24d | 1 | 0.56mi |
| 8215 Victory Crossing Blvd Jacksonville, FL | 3.0 | 2.0 | 1903 | $1,900 | $1.00 | 4d | 1 | 0.58mi |
| 8263 Victory Crossing Blvd Jacksonville, FL | 3.0 | 2.0 | 1903 | $1,900 | $1.00 | 24d | 1 | 0.58mi |
| 8272 Victory Crossing Blvd Jacksonville, FL | 4.0 | 2.0 | 2149 | $2,600 | $1.21 | 24d | 1 | 0.58mi |
| 5905 Renault Dr W Jacksonville, FL | 4.0 | 2.0 | 1524 | $1,850 | $1.21 | 24d | 1 | 0.61mi |
| 8402 McGirts Village Ln Unit 7E Jacksonville, FL | 2.0 | 2.5 | 1319 | $1,198 | $0.91 | 8d | 1 | 0.61mi |
| 4418 Melissa Ct W Jacksonville, FL | 3.0 | 2.5 | 1386 | $1,300 | $0.94 | 24d | 1 | 0.63mi |
| 4418 Melissa Ct W Unit Bedroom w/ private bath Jacksonville, FL | 3.0 | 2.5 | 1386 | $1,250 | $0.90 | 24d | 1 | 0.63mi |
| 8419 McGirts Village Ln Jacksonville, FL | 3.0 | 2.5 | 1325 | $1,400 | $1.06 | 2d | 1 | 0.63mi |
| 5524 Enchanted Dr Jacksonville, FL | 3.0 | 1.5 | 1237 | $1,580 | $1.28 | 3d | 1 | 0.66mi |
| 8443 McGirts Village Ln Jacksonville, FL | 3.0 | 2.5 | 1325 | $1,381 | $1.04 | 8d | 1 | 0.66mi |
| 8325 Homeport Ct Jacksonville, FL | 3.0 | 2.0 | 1518 | $1,575 | $1.04 | 17d | 1 | 0.67mi |
| 8329 Homeport Ct Jacksonville, FL | 3.0 | 2.5 | 1281 | $1,695 | $1.32 | 15d | 1 | 0.68mi |
| 7364 Strato Rd Jacksonville, FL | 3.0 | 2.0 | 1412 | $1,750 | $1.24 | 24d | 1 | 0.69mi |
| 4372 Melissa Ct W Jacksonville, FL | 4.0 | 2.0 | 1445 | $1,544 | $1.07 | 16d | 1 | 0.69mi |
| 8341 Homeport Ct Jacksonville, FL | 3.0 | 2.5 | 1296 | $1,800 | $1.39 | 24d | 1 | 0.69mi |
| 8460 McGirts Village Ln Jacksonville, FL | 3.0 | 2.5 | 1325 | $1,482 | $1.12 | 8d | 1 | 0.70mi |
| 8485 McGirts Village Ln Jacksonville, FL | 3.0 | 2.5 | 1325 | $1,381 | $1.04 | 24d | 1 | 0.72mi |
| 6019 Blank Dr Jacksonville, FL | 3.0 | 2.0 | 1520 | $1,500 | $0.99 | 24d | 1 | 0.73mi |
| 8493 McGirts Village Ln Jacksonville, FL | 3.0 | 2.5 | 1325 | $1,381 | $1.04 | 21d | 1 | 0.74mi |
| 4425 Jana Ln E Jacksonville, FL | 3.0 | 2.0 | 1284 | $1,690 | $1.32 | 13d | 1 | 0.75mi |
| 4285 Melissa Ct W Jacksonville, FL | 2.0 | 2.0 | 1320 | $1,450 | $1.10 | 15d | 1 | 0.80mi |
| 8515 Maple St Jacksonville, FL | 3.0 | 2.0 | 1255 | $1,499 | $1.19 | 3d | 1 | 0.82mi |
| 8518 Maple St Jacksonville, FL | 3.0 | 2.0 | 1460 | $1,623 | $1.11 | 16d | 1 | 0.84mi |
Listing history 18 events
-
2026-06-18days on market $35,000 Active 178 DOM
-
2026-06-17days on market $35,000 Active 177 DOM
-
2026-06-16days on market $35,000 Active 176 DOM
-
2026-06-15days on market $35,000 Active 175 DOM
-
2026-06-10days on market $35,000 Active 169 DOM
-
2026-06-08days on market $35,000 Active 168 DOM
-
2026-06-03days on market $35,000 Active 163 DOM
-
2026-06-02days on market $35,000 Active 162 DOM
-
2026-06-01days on market $35,000 Active 161 DOM
-
2026-05-31days on market $35,000 Active 160 DOM
-
2026-01-24price $35,000
-
2025-12-22$45,000 Active
-
2004-09-19historical
-
2004-08-19$49,900
-
1999-05-27soldstatus $821,300
-
1999-05-27soldstatus $821,300
-
1992-03-19soldstatus $1,161,300
-
1985-11-01soldstatus $1,756,000
ⓘ Source: listings_history table (triggers on properties + properties_extension) + one-shot
backfill from property_details.listing_events for pre-trigger history.
Nearby sold comps map
Loading sold comps map…
Walkable amenities ~0.75 mi
Loading nearby amenities…
Taxation est. · year 1
- Rental income
- $19,611
- − Mortgage interest
- −$1,961
- − Property taxes
- −$525
- − Insurance
- −$175
- − Repairs & maintenance
- −$1,569
- − Management
- −$1,569
- − Depreciation
- −$1,018
- Taxable income
- $12,794
- Est. tax owed @ 24.0%
- −$3,071
- After-tax cash flow
- $9,519/yr
For passive investors: Depreciation is non-cash, so a rental often shows a tax loss while cash-flowing — sheltering income. Rental losses are passive: they offset passive income freely, and up to $25,000/yr can offset ordinary (W-2) income if you actively participate and your MAGI is under $100k (phasing out to $0 by $150k); unused losses carry forward. On sale, claimed depreciation is recaptured at up to 25%, and gains may owe capital-gains tax (a 1031 exchange can defer both). Figures are a year-1 estimate at your 24.0% rate — not tax advice; consult a CPA.
Schools (NCES district)
- District
- Duval
- NCES district ID
- 1200480
- Math proficiency
- 46% ▼ -11.00%
- Reading proficiency
- 45% ▼ -4.00%
- Median HH income
- $48,987
- Composite
- 38.97/100
- National rank
- #4076
- State rank
- #48 of 73 in FL
Livability — Jacksonville
- Score
- 83/100
- State rank
- #50
- US rank
- #911
Category grades
Schools grade is shown separately in the Schools card above.
Census & demographics
- Census place
- Jacksonville, FL
- County
- Duval County · 1,015,274 people
- City population
- 979,034
- Metro
- Jacksonville, FL
- Population (ZIP)
- 65,729
- Household income
- $61,050
- Rent vs Own
- Severe rent burden
- 3605.0
Population outlook (Duval County) Hauer SSP2
- Today (2025)
- 1,013,010 people
- By 2030
- 1,059,228 · +4.6%
- By 2040
- 1,141,439 · +12.7%
- By 2050
- 1,205,258 · +19.0%
- By 2075
- 1,324,282 · +30.7%
- By 2100
- 1,319,620 · +30.3%
Race, ethnicity, and origin ACS 2023
- Neighborhood character
- Diverse neighborhood (Simpson 0.65)
- Race & ethnicity
- White 43% Black 38% Hispanic / Latino 10% Two or more races 7% Asian 3%
- Hispanic origin (detail)
- Mexican 3% Puerto Rican 3%
- Common ancestry
- Slovak 2% Hispanic 2% Italian 1%
- Foreign-born
- 10% · Canada, Vietnam, China
- Languages at home
- 86% English-only · Spanish 7% French/Haitian/Cajun 2% Tagalog/Filipino 1%
Political lean MEDSL · Duval
- 2024 margin
- Toss-up / Even · D 48.7% · R 50.1% · Other 1.2%
- 2008→2024 swing
- +0.4pp no change · 2008: -1.9pp · 2024: -1.5pp
- All cycles
- 2024: R+1.5 2020: D+3.8 2016: R+1.5 2012: R+3.6 2008: R+1.9
Not yet ingested
- Civics
- —
Market trends
- HPI YoY
- ▼ -314.81%
- Current HPI
- 281.2688
- Rent YoY
- ▲ 2.11%
- Metro
- Jacksonville, FL
- State GDP YoY
- ▲ 3.28%
- F500 in state
- 36
Industry mix (Fortune 500 HQ in FL)
| Industry | F500 HQs | Revenue |
|---|---|---|
| Industrial Technology | 2 | $29B |
|
||
| Insurance | 2 | $17B |
|
||
| Retail | 1 | $60B |
|
||
| Technology Distribution | 1 | $58B |
|
||
| Homebuilding | 1 | $35B |
|
||
| Technology Manufacturing | 1 | $35B |
|
||
Price history
-98.0% since first listed8 events — show timeline
- 2026-01-24 Price Changed $35,000 ForSaleByOwner.com
- 2025-12-22 Listed $45,000 ForSaleByOwner.com
- 2004-09-19 Listing Removed — realMLS
- 2004-08-19 Listed $49,900 realMLS
- 1999-05-27 Sold (Public Records) $821,300 Public Records
- 1999-05-27 Sold (Public Records) $821,300 Public Records
- 1992-03-19 Sold (Public Records) $1,161,300 Public Records
- 1985-11-01 Sold (Public Records) $1,756,000 Public Records
Property tax history
+6.6%/yrLatest (2025): $98,493 · +3.3% YoY. Source: county tax records.
Cash-flow waterfall
monthlySold comps — $/sqft
last 12 mo · ≤1 miLoading sold comps…