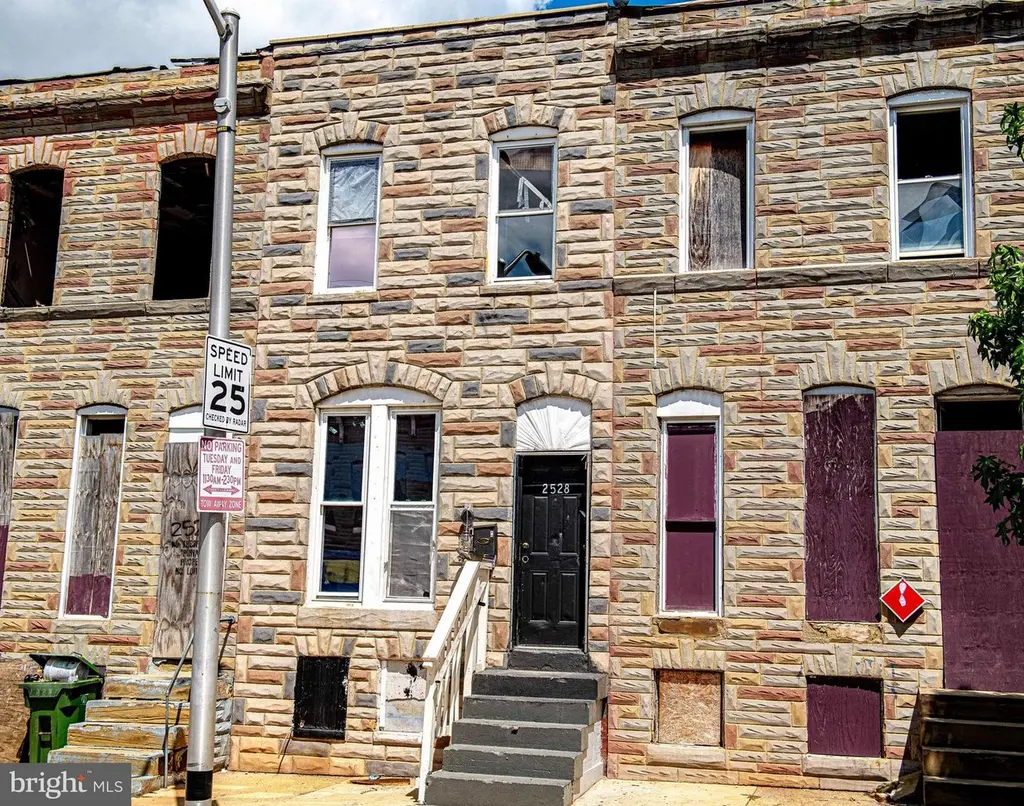
2528 E Oliver St · Baltimore, MD
Flood risk 1/10 · Minimal
- FEMA flood zone
- X (unshaded)
- Chance of flooding over 30 yrs
- 0.0%
- Est. flood insurance / yr
- $507 – $1,088
Fire risk 1/10 · Minimal
- Est. fire insurance / yr
- $755 – $1,403
Heat risk 7/10 · Major
- Hot days now (above 103°F)
- 7 days/yr
- Hot days in 30 yrs
- 15 days/yr
Wind risk 6/10 · Moderate
- Chance of severe wind over 30 yrs
- 27.0%
Air-quality risk 4/10 · Minor
- Unhealthy air days now
- 6 days/yr
- Unhealthy air days in 30 yrs
- 7 days/yr
Risk factors via First Street. Map © Google.
Why this score? — see what drove the B grade
The composite is a weighted blend of 9 inputs, each scored 0–100. Each bar is that input's sub-score; the figure is the points it added to the 100-point composite (weight × sub-score).
- Cash flow +30.0/30.0
- 1% rule +10.0/10.0
- DSCR +10.0/10.0
- ARV discount +7.5/15.0
- Appreciation +4.7/10.0
- Rent growth +3.8/5.0
- Livability +3.8/5.0
- Condition / age +2.5/5.0
- Schools +1.0/10.0
$50,000
🖨 Deal sheet (PDF) 📄 Offer letter ✓ Due diligence
Listing remarks MLS
* * Seller financing * * available AND seller can add $30k in reno money. $5k down payment required. This is ready for renovation. There are sold comps nearby for your sale appraisal or rental refi. SOLD comps: 1515 N Montford Ave SOLD $190k on 6/13/15 * * 1438 N Milton Ave SOLD $170k on 2/21/25.
Key facts
- Built 1900
- Listed 179 days
Neighborhood map
What this means for you Summary
Snapshot
- This is a 2-bed/1.0-bath townhouse listed at $50k.
Deal economics
- At list price, monthly cash flow is $739 ($9k/yr) — positive.
- The deal already cash-flows at list — no discount required.
- Meets the 1% rule at list price ($1k rent vs $50k).
- Recommended offer: $44k (12.0% below list) — sets the bar for market timing.
- Cap rate 24.0% vs local median 6.0% in Baltimore — top-decile yield for the area; either an underpriced asset or a hidden risk that comps aren't pricing in. Stress-test before assuming the spread holds.
Location & tenants
- Location reads 76/100 on livability (#90 in MD, #3,396 nationally) — a middle-class / working-renter tenant base. Strengths: amenities A+, commute A+, housing A+; Watch: schools D, crime F.
- Baltimore City Public Schools (urban): math 7% / reading 16% proficiency, ranked #24 of 24 in MD (top 100%) — low school quality limits family demand, transient renter base, plan for 1-2y turnover; 79% free/reduced lunch — lower-income household profile, screen leases tightly.
- Market conditions: Rents rising fast (+5.2%/yr); 319 active listings in the ZIP; 31 comparable units currently listed for rent nearby; rentals at typical pace (median 23d on market — plan ~3-4 weeks tenant-placement turnaround); 1,273 units permitted in Baltimore city in 2024 (1,104 in 5+ unit buildings).
- This rent runs 32% of the median local income ($51k/yr) — at the standard rent-burdened threshold; future hikes will face affordability resistance.
Forward outlook
- In year one you build about $62 of equity ($346 loan paydown + $-284 appreciation (-0.6% local appreciation)).
- Baltimore County population projected to shrink 4% by 2050 — rents likely to lag national; underwrite the cash flow, not the appreciation.
- At projected returns (-0.6% appreciation + 5.2% rent growth), your $14k cash investment doubles in ~2 years — after that, you're playing with house money.
Negotiation context
- It's been on market 180 days — a 12% lower offer ($44k) is reasonable based on typical stale-listing flexibility.
- Current owner paid $21k; list at $50k implies a 143% gain — meaningful room to come down on a strong offer.
Risks & watch-outs
- Watch-outs: built in 1900 — expect roof / HVAC / electrical / plumbing capex.
- Climate carrying-cost: major wind risk, 27% chance of damaging wind over 30y; extreme-heat days projected 7→15/yr by 2055 (HVAC capex compounding) — expect insurance premiums to compound above CPI over the hold.
Questions for the listing agent
- It's been on market 180 days. Have you received any prior offers? Is the seller open to a 12% concession, seller financing, or rate buy-down credit?
- Built in 1900 — when were the roof, HVAC, electrical panel, plumbing, and water heater last replaced?
- Why hasn't it sold? Are there any deal-killer items the seller is aware of (foundation, flood, title, zoning, code violations)?
- Is there a deadline driving the sale (1031 exchange, divorce, estate, relocation)? That informs how much negotiation room exists.
- Schools are D-rated, which usually means shorter tenancies and higher turnover. Who's the typical renter profile here, and what's been the actual vacancy rate?
- Crime grade is F in this area — have there been break-ins, vandalism, or insurance claims at this property in the last 3 years? What carrier currently insures it and at what premium?
- What's the average days-on-market for RENTAL listings here right now (not sales)? A rising rental-DOM trend means longer vacancies and softer asking-rent achievability than the comps imply.
- What's the recent tenant-quality profile in this submarket — average credit score on applications, eviction rate, late-payment / NSF rate, and stable-employment percentage? A property-management company in the area should have these aggregated.
- How much new for-sale + rental construction is in the pipeline within 1–3 miles? Heavy new supply typically softens prices + rents 12–24 months out; constrained supply supports both.
Investment metrics
- 1% rule
- 2.75% ✓
- Cap rate
- 24.02%
- Cash-on-cash
- 63.31%
- DSCR
- 3.82
- GRM
- 3.0
CMA / ARV
- ARV (median comp)
- $143,757
- List price
- $50,000
- Delta
- -65.22%
- Verdict
- UNDERPRICED
- Comps
- 20 within 1.0 mi
Show comp detail 1 sale within ~0.75 mi
| Address | Dist | Beds/Ba | Sqft | Sold | Price | $/sf | Match |
|---|---|---|---|---|---|---|---|
| 2305 Ashland Ave | 0.53mi | 3/1.0 (+1) | 616 (-6%) | 4mo | $78,000 | $127 | 56 |
Match score weights: distance 35% · size 25% · config 20% · recency 20%. Top-matched comps best support the ARV.
Projected returns pro-forma
-0.57% appreciation · 5.25% rent growth · sell at horizon
- IRR
- 67.0%
- Equity multiple
- 4.39×
- Total profit
- $47,461
- Equity at exit
- $13,115
- IRR
- 70.2%
- Equity multiple
- 9.62×
- Total profit
- $120,749
- Equity at exit
- $14,683
Cash invested: $14,000 (down + closing). Projections, not guarantees.
Landlord ↔ Tenant lean methodology
- Overall (CITY)
- 12 Strongly Tenant-Friendly
- State Maryland
- 27 Tenant-Leaning · D+14
- County
- — inherits STATE
- City Baltimore
- 12 Strongly Tenant-Friendly · D+58
ZIP-level market 21213
- Home prices YoY
- -0.1%
- Rents YoY
- 5.2%
- Active inventory
- 319
- Price-to-rent
- 3.0×
Monthly cashflow live
- Estimated rent
- $1,373 high interval (Pro) →
- Mortgage (P&I)
- −$262
- Tax from tax record
- −$63 /mo · $752/yr
- Insurance
- −$21
- HOA
- −$0
- Vacancy / Maint / Mgmt
- −$288
- Net cashflow
- $739
Break-even live
Sensitivity live
| Price | -10% $767 | -5% $753 | +0% $739 | +5% $725 | +10% $710 |
|---|---|---|---|---|---|
| Rent | -10% $630 | -5% $684 | +0% $739 | +5% $793 | +10% $847 |
| Rate | -1.0pp $764 | -0.5pp $751 | base $739 | +0.5pp $726 | +1.0pp $713 |
UW: 25.0% down · 7.5% · 30yr · 1.5% tax · 5.0% vac · 8.0% maint · 8.0% mgmt
Financing live
Cash to close
- Down payment
- $12,500
- Closing costs
- $1,500
- Reserves months
- —
- Total cash needed
- —
Loan-product check · same deal, 3 products live
Conventional
25% down · 7.5% · 30yr
- Down + closing
- —
- Monthly P&I
- —
- Monthly cashflow
- —
- DSCR
- —
- Eligible?
- —
Personal DTI + credit; lowest rate.
DSCR
20% down · 8.5% · 30yr
- Down + closing
- —
- Monthly P&I
- —
- Monthly cashflow
- —
- DSCR
- —
- Eligible?
- —
No personal income docs; deal must DSCR.
Hard money
10% down · 12.0% · 12mo
- Down + closing
- —
- Monthly P&I
- —
- Monthly cashflow
- —
- DSCR
- —
- Eligible?
- —
Short-term bridge; refi at stabilization.
Rent comps 31 comps
| Address | Beds | Baths | Sqft | Rent | $/sqft | DOM | Units | Dist |
|---|---|---|---|---|---|---|---|---|
| 1323 N Kenwood Ave Unit 2 Baltimore, MD | 1.0 | 1.0 | 600 | $950 | $1.58 | 44d | 1 | 0.22mi |
| 2221 E Preston St Baltimore, MD | 2.0 | 1.0 | 658 | $1,200 | $1.82 | 24d | 1 | 0.29mi |
| 1401 N Potomac St Unit 1 Baltimore, MD | 1.0 | 1.0 | 700 | $1,099 | $1.57 | 18d | 1 | 0.35mi |
| 1600 N Chester St Baltimore, MD | 1.0 | 1.0 | 715 | $636 | $0.89 | 24d | 1 | 0.36mi |
| 2000 E North Ave Baltimore, MD | 1.0 | 1.0 | 639 | $836 | $1.31 | 5d | 4 | 0.55mi |
| 723 N Patterson Park Ave Baltimore, MD | 1.0 | 1.0 | 350 | $1,000 | $2.86 | 44d | 1 | 0.62mi |
| 500 N Rose St Baltimore, MD | 3.0 | 2.0 | 520 | $1,200 | $2.31 | 5d | 1 | 0.75mi |
| 1607 Hakesley Pl Baltimore, MD | 3.0 | 1.0 | 720 | $1,400 | $1.94 | 44d | 1 | 0.78mi |
| 400 N Rose St #1 Baltimore, MD | 1.0 | 1.0 | 588 | $1,080 | $1.84 | 44d | 1 | 0.84mi |
| 1209 N Caroline St Unit 2 Baltimore, MD | 1.0 | 1.0 | 600 | $1,300 | $2.17 | 5d | 1 | 0.88mi |
| 3902 Erdman Ave Unit 2 Baltimore, MD | 1.0 | 1.0 | 700 | $1,175 | $1.68 | 15d | 1 | 0.88mi |
| 3727 Bonview Ave Baltimore, MD | 1.0 | 1.0 | 540 | $1,199 | $2.22 | 24d | 1 | 1.01mi |
| 3410 Belair Rd Unit 2/B Baltimore, MD | 1.0 | 1.0 | 742 | $1,225 | $1.65 | 5d | 1 | 1.15mi |
| 107 S Collington Ave Unit 2 REAR Baltimore, MD | 1.0 | 1.0 | 600 | $1,800 | $3.00 | 5d | 1 | 1.24mi |
| 3344 E Baltimore St Unit 2 Baltimore, MD | 1.0 | 1.0 | 545 | $1,250 | $2.29 | 44d | 1 | 1.25mi |
| 4300 Orchard Ridge Blvd Baltimore, MD | 1.0–3.0 | 1.0–2.0 | 1021 | $1,420 | $1.39 | 44d | 1 | 1.25mi |
| 2045 E 31st St Baltimore, MD | 1.0 | 1.0 | 650 | $895 | $1.38 | 44d | 1 | 1.27mi |
| 520 Somerset St Baltimore, MD | 1.0–2.0 | 1.0–2.0 | 634 | $1,578 | $2.49 | 44d | 1 | 1.29mi |
| 1901 E Lombard St Baltimore, MD | 1.0 | 1.0 | 650 | $1,750 | $2.69 | 24d | 1 | 1.29mi |
| 1901 E Lombard St Apt 2 Baltimore, MD | 1.0 | 1.0 | 650 | $1,650 | $2.54 | 2d | 1 | 1.29mi |
| 1901 E Lombard St Apt 3 Baltimore, MD | 1.0 | 1.0 | 650 | $1,750 | $2.69 | 5d | 1 | 1.29mi |
| 1901 E Lombard St Apt 4 Baltimore, MD | 1.0 | 1.0 | 650 | $1,750 | $2.69 | 22d | 1 | 1.29mi |
| 1901 E Lombard St Baltimore, MD | 1.0 | 1.0 | 660 | $1,800 | $2.73 | 22d | 1 | 1.29mi |
| 1901 E Lombard St Apt 3 Baltimore, MD | 1.0 | 1.0 | 650 | $1,750 | $2.69 | 15d | 1 | 1.29mi |
| 1901 E Lombard St Baltimore, MD | 1.0 | 1.0 | 702 | $1,750 | $2.49 | 44d | 1 | 1.29mi |
| 831 E Chase St Baltimore, MD | 1.0 | 1.0 | 650 | $850 | $1.31 | 4d | 1 | 1.31mi |
| 420 Aisquith St Baltimore, MD | 1.0 | 1.0 | 721 | $1,226 | $1.70 | 44d | 1 | 1.34mi |
| 821 E Eager St Unit 21-3F Baltimore, MD | 1.0 | 1.0 | 700 | $999 | $1.43 | 5d | 1 | 1.35mi |
| 305 S Collington Ave Baltimore, MD | 3.0 | 2.5 | 722 | $2,895 | $4.01 | 18d | 1 | 1.43mi |
| 1100 Greenmount Ave Baltimore, MD | 1.0–3.0 | 1.0–2.0 | 839 | $1,954 | $2.33 | 3d | 1 | 1.44mi |
| 201 S Conkling St Baltimore, MD | 1.0 | 1.0 | 740 | $1,500 | $2.03 | 3d | 2 | 1.48mi |
Listing history 10 events
-
2026-06-04days on market $50,000 Active 180 DOM
-
2026-06-03days on market $50,000 Active 179 DOM
-
2026-06-02days on market $50,000 Active 178 DOM
-
2026-06-01days on market $50,000 Active 177 DOM
-
2026-05-31days on market $50,000 Active 176 DOM
-
2026-02-14price $50,000 303-char remark
Show marketing remark (303 chars)
* * Seller financing * * available AND seller can add $30k in reno money. $5k down payment required. This is ready for renovation. There are sold comps nearby for your sale appraisal or rental refi. SOLD comps: 1515 N Montford Ave SOLD $190k on 6/13/15 * * 1438 N Milton Ave SOLD $170k on 2/21/25.
-
2025-12-30price $58,000 303-char remark
Show marketing remark (303 chars)
* * Seller financing * * available AND seller can add $30k in reno money. $5k down payment required. This is ready for renovation. There are sold comps nearby for your sale appraisal or rental refi. SOLD comps: 1515 N Montford Ave SOLD $190k on 6/13/15 * * 1438 N Milton Ave SOLD $170k on 2/21/25.
-
2025-12-06$69,000 Active 303-char remark
Show marketing remark (303 chars)
* * Seller financing * * available AND seller can add $30k in reno money. $5k down payment required. This is ready for renovation. There are sold comps nearby for your sale appraisal or rental refi. SOLD comps: 1515 N Montford Ave SOLD $190k on 6/13/15 * * 1438 N Milton Ave SOLD $170k on 2/21/25.
-
2025-12-06historical $69,000 303-char remark
Show marketing remark (303 chars)
* * Seller financing * * available AND seller can add $30k in reno money. $5k down payment required. This is ready for renovation. There are sold comps nearby for your sale appraisal or rental refi. SOLD comps: 1515 N Montford Ave SOLD $190k on 6/13/15 * * 1438 N Milton Ave SOLD $170k on 2/21/25.
-
1988-03-04soldstatus $20,600
ⓘ Source: listings_history table (triggers on properties + properties_extension) + one-shot
backfill from property_details.listing_events for pre-trigger history.
Tax reassessment forecast MD · Partial reset (capped growth)
- Current annual tax
- $752 · $63/mo
- Projected year-2 tax
- $752 · $63/mo
- Expected delta
- $0/yr ($0/mo · 0.0%)
ⓘ Screening estimate from a state-policy table — verify with the county assessor before closing.
Climate risk First Street
- Flood 1/10 Low FEMA zone X (unshaded) · 0% chance over 30 yrs
- Wildfire 1/10 Low
- Heat 7/10 Severe 7 d/yr ≥103°F today · 15 d/yr by 30 yrs out
- Wind 6/10 Major 27% chance of damaging wind over 30 yrs
- Air quality 4/10 Moderate 6 unhealthy d/yr today · 7 by 30 yrs out
Nearby sold comps map
Loading sold comps map…
Walkable amenities ~0.75 mi
Loading nearby amenities…
Taxation est. · year 1
- Rental income
- $16,471
- − Mortgage interest
- −$2,801
- − Property taxes
- −$752
- − Insurance
- −$250
- − Repairs & maintenance
- −$1,318
- − Management
- −$1,318
- − Depreciation
- −$1,455
- Taxable income
- $8,579
- Est. tax owed @ 24.0%
- −$2,059
- After-tax cash flow
- $6,805/yr
For passive investors: Depreciation is non-cash, so a rental often shows a tax loss while cash-flowing — sheltering income. Rental losses are passive: they offset passive income freely, and up to $25,000/yr can offset ordinary (W-2) income if you actively participate and your MAGI is under $100k (phasing out to $0 by $150k); unused losses carry forward. On sale, claimed depreciation is recaptured at up to 25%, and gains may owe capital-gains tax (a 1031 exchange can defer both). Figures are a year-1 estimate at your 24.0% rate — not tax advice; consult a CPA.
Schools (NCES district)
- District
- Baltimore City Public Schools
- NCES district ID
- 2400090
- Math proficiency
- 7% ▼ -9.00%
- Reading proficiency
- 16% ▼ -5.00%
- Median HH income
- $42,108
- Composite
- 10.08/100
- National rank
- #9805
- State rank
- #24 of 24 in MD
Livability — Baltimore
- Score
- 76/100
- State rank
- #90
- US rank
- #3396
Category grades
Schools grade is shown separately in the Schools card above.
Census & demographics
- Census place
- Baltimore, MD
- County
- Baltimore City · 558,601 people
- City population
- 588,727
- Metro
- Baltimore-Columbia-Towson, MD
- Population (ZIP)
- 28,058
- Household income
- $51,344
- Rent vs Own
- Severe rent burden
- 1868.0
Population outlook (Baltimore County) Hauer SSP2
- Today (2025)
- 624,249 people
- By 2030
- 621,541 · -0.4%
- By 2040
- 609,756 · -2.3%
- By 2050
- 597,249 · -4.3%
- By 2075
- 552,236 · -11.5%
- By 2100
- 513,934 · -17.7%
Race, ethnicity, and origin ACS 2023
- Neighborhood character
- Predominantly Black (86%)
- Race & ethnicity
- Black 86% White 6% Hispanic / Latino 4% Two or more races 3%
- Foreign-born
- 3% · Canada
- Languages at home
- 96% English-only · Spanish 3%
Political lean MEDSL · Baltimore
- 2024 margin
- Solid D (+73.0) · D 85.2% · R 12.2% · Other 2.6%
- 2008→2024 swing
- -2.5pp toward R · 2008: 75.5pp · 2024: 73.0pp
- All cycles
- 2024: D+73.0 2020: D+76.6 2016: D+74.6 2012: D+76.4 2008: D+75.5
Not yet ingested
- Civics
- —
Market trends
- HPI YoY
- ▼ -0.57%
- Current HPI
- 427.4453
- Rent YoY
- ▲ 5.25%
- Metro
- Baltimore-Columbia-Towson, MD
- State GDP YoY
- ▲ 2.97%
- F500 in state
- 12
Industry mix (Fortune 500 HQ in MD)
| Industry | F500 HQs | Revenue |
|---|---|---|
| Aerospace / Defense | 1 | $71B |
|
||
| Utilities | 1 | $25B |
|
||
| Hotels | 1 | $24B |
|
||
| Consumer Goods | 1 | $7B |
|
||
| Real Estate | 1 | $6B |
|
||
| Chemicals | 1 | $2B |
|
||
Price history
+142.7% since first listed5 events — show timeline
- 2026-02-14 Price Changed $50,000 BRIGHT MLS
- 2025-12-30 Price Changed $58,000 BRIGHT MLS
- 2025-12-06 Listed $69,000 BRIGHT MLS
- 2025-12-06 Coming Soon $69,000 BRIGHT MLS
- 1988-03-04 Sold (Public Records) $20,600 Public Records
Property tax history
+17.0%/yrLatest (2025): $752 · +10.3% YoY. Source: county tax records.
Cash-flow waterfall
monthlySold comps — $/sqft
last 12 mo · ≤1 miLoading sold comps…