 🏗️ New Construction
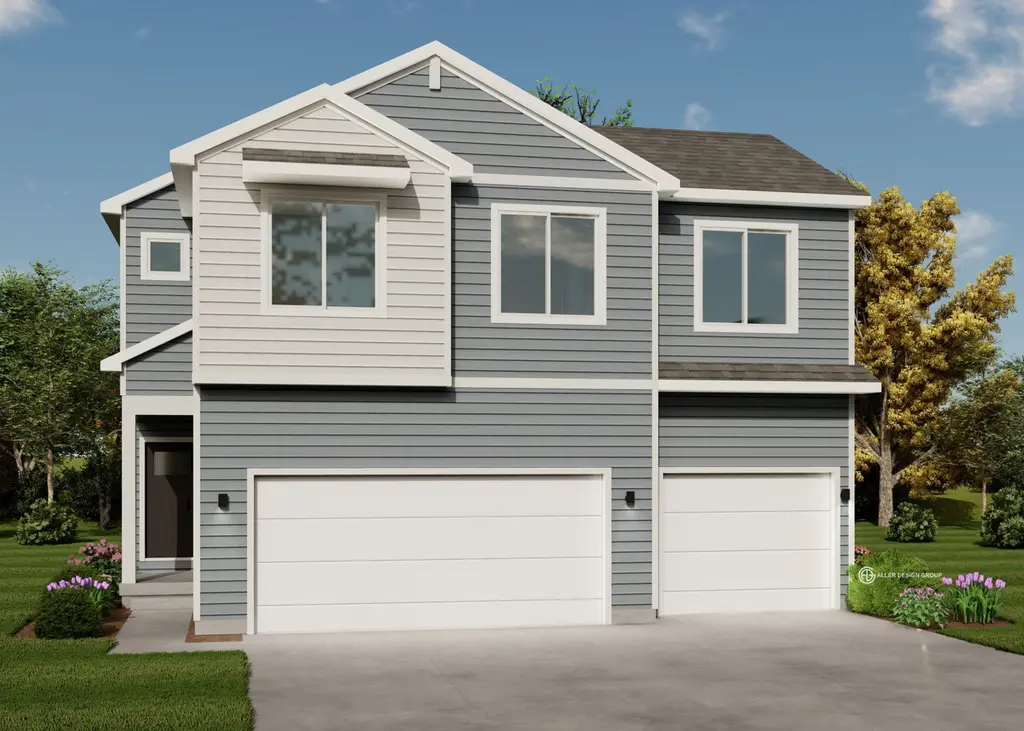
Chatham XL Plan · Johnston, IA
Flood risk 1/10 · Minimal
- FEMA flood zone
- X (unshaded)
- Chance of flooding over 30 yrs
- 0.0%
- Est. flood insurance / yr
- $507 – $1,088
Fire risk 2/10 · Minimal
- Est. fire insurance / yr
- $902 – $1,676
Heat risk 3/10 · Minor
- Hot days now (above 104°F)
- 7 days/yr
- Hot days in 30 yrs
- 14 days/yr
Wind risk 2/10 · Minimal
- Chance of severe wind over 30 yrs
- —
Air-quality risk 1/10 · Minimal
- Unhealthy air days now
- 0 days/yr
- Unhealthy air days in 30 yrs
- 0 days/yr
Risk factors via First Street. Map © Google.
Why this score? — see what drove the F grade
The composite is a weighted blend of 9 inputs, each scored 0–100. Each bar is that input's sub-score; the figure is the points it added to the 100-point composite (weight × sub-score).
- ARV discount +7.5/15.0
- Schools +6.9/10.0
- Livability +4.0/5.0
- Rent growth +2.9/5.0
- Cash flow +2.7/30.0
- Condition / age +2.5/5.0
- 1% rule +0.0/10.0
- DSCR +0.0/10.0
- Appreciation +0.0/10.0
$310,000
🖨 Deal sheet (PDF) 📄 Offer letter ✓ Due diligence
Listing remarks MLS
Destiny Homes presents its Chatham XL plan. The Chatham XL plan features 4 bedrooms, 2.5 baths and approximately 1,900 sqft of living space. This 2 story home has everything a home should; including ample entertaining space within the open concept kitchen/great room/dining, quartz countertops, kitchen island and pantry. The primary ensuite with walk-in closet, plus 3 additional bedrooms, loft area + huge bonus room, bathroom and laundry room are located on the upper level. All Launch series homes are Energy Star rated & have a 2 year builder warranty. Striking the perfect balance between quality and efficiency, your path to homeownership starts right now! Ask about $2,000 in closing costs provided by preferred lender.
Key facts
- 3 parking spots
- Listed 956 days
Neighborhood map
What this means for you Summary
Snapshot
- This is a 4-bed/2.5-bath single-family listed at $310k.
Deal economics
- At list price, monthly cash flow is $-2k ($-20k/yr) — negative.
- To cash-flow at today's rent, offer at most $248k (20.0% below list).
- To meet the 1% rule (rent ≥ 1% of price), the offer needs to be $218k (29.5% below list).
- Recommended offer: $218k (29.5% below list) — sets the bar for 1% rule.
Location & tenants
- Location reads 81/100 on livability (#59 in IA, #1,344 nationally) — a professional / high-income tenant draw. Strengths: crime A+, employment A+, housing A+; Watch: amenities F, commute F.
- Johnston Community School District (suburban): math 78% / reading 78% proficiency, ranked #24 of 289 in IA (top 8%) — strong family-tenant draw, lease renewals of 3-5y typical; only 14% free/reduced lunch — higher-income household profile.
- Zoned schools: Horizon Elementary (math 71% / reading 67%, grade A-, #263 of 616 statewide, top 43%, 647 students, 36% FRL); Summit Middle School (math 80% / reading 77%, grade A+, #44 of 246 statewide, top 19%, 1,112 students, 27% FRL); Johnston Senior High School (math 76% / reading 79%, grade A-, #56 of 336 statewide, top 17%, 1,790 students, 23% FRL).
- Market conditions: Rents rising (+1.5%/yr); 382 active listings in the ZIP; 9 comparable units currently listed for rent nearby; rentals at typical pace (median 16d on market — plan ~3-4 weeks tenant-placement turnaround); solid renter incomes; 2,953 units permitted in Polk County in 2024 (540 in 5+ unit buildings).
Forward outlook
- Local home prices are declining (-3.0%/yr); year-one equity from $3k of loan paydown is wiped out by about $15k of value loss. Plan a longer hold.
- Polk County population projected at +37% by 2050 — long-run rental-demand tailwind backs the buy-and-hold thesis.
Negotiation context
- It's been on market 956 days — a 12% lower offer ($273k) is reasonable based on typical stale-listing flexibility.
Questions for the listing agent
- What do current leases actually rent for vs. the listed asking? Can we see a recent rent roll and the last 12 months of T-12 income?
- It's been on market 956 days. Have you received any prior offers? Is the seller open to a 30% concession, seller financing, or rate buy-down credit?
- What does the HOA fee cover, when was the last increase, and are there any pending special assessments or reserve-fund shortfalls?
- Why hasn't it sold? Are there any deal-killer items the seller is aware of (foundation, flood, title, zoning, code violations)?
- Is there a deadline driving the sale (1031 exchange, divorce, estate, relocation)? That informs how much negotiation room exists.
- Schools are A-rated — typically a magnet for longer-tenancy family renters. What's the average tenant stay here, and is there a school-zone premium baked into asking?
- The area grade is low — what's the realistic commute time and amenity access for the typical tenant pool here? Any planned neighborhood developments (good or bad) we should know about?
- What's the average days-on-market for RENTAL listings here right now (not sales)? A rising rental-DOM trend means longer vacancies and softer asking-rent achievability than the comps imply.
- What's the recent tenant-quality profile in this submarket — average credit score on applications, eviction rate, late-payment / NSF rate, and stable-employment percentage? A property-management company in the area should have these aggregated.
- How much new for-sale + rental construction is in the pipeline within 1–3 miles? Heavy new supply typically softens prices + rents 12–24 months out; constrained supply supports both.
Investment metrics
- 1% rule
- 0.45% ✗
- Cap rate
- 2.25%
- Cash-on-cash
- -14.42%
- DSCR
- 0.36
- GRM
- 18.4
CMA / ARV
- ARV (median comp)
- $483,389
- List price
- $310,000
- Delta
- -35.87%
- Verdict
- UNDERPRICED
- Comps
- 20 within 1.0 mi
Show comp detail 12 sales within ~0.75 mi
| Address | Dist | Beds/Ba | Sqft | Sold | Price | $/sf | Match |
|---|---|---|---|---|---|---|---|
| 6739 Bright St | 0.11mi | 4/3.0 | 1,915 (-0%) | 9mo | $745,000 | $389 | 85 |
| 6713 NW 99th St | 0.28mi | 4/2.5 | 1,988 (+3%) | 8mo | $537,500 | $270 | 75 |
| 6728 NW 106th St | 0.32mi | 4/2.5 | 2,053 (+7%) | 2mo | $374,340 | $182 | 72 |
| 10123 NW 68th Ave | 0.18mi | 4/4.0 | 2,146 (+12%) | 2mo | $539,900 | $252 | 65 |
| 10022 NW 68th Ave | 0.19mi | 4/4.0 | 2,146 (+12%) | 6mo | $569,900 | $266 | 60 |
| 10525 Powell Ave | 0.28mi | 4/3.0 | 1,684 (-12%) | 6mo | $390,000 | $232 | 59 |
| 10598 NW 72nd Ln | 0.46mi | 4/3.0 | 1,669 (-13%) | 4mo | $467,000 | $280 | 52 |
| 10695 NW 72nd Ln | 0.51mi | 5/3.0 (+1) | 1,810 (-6%) | 11mo | $615,000 | $340 | 50 |
| 6725 NW 93rd St | 0.60mi | 4/3.0 | 2,108 (+10%) | 6mo | $590,000 | $280 | 48 |
| 6419 NW 97th St | 0.69mi | 4/2.5 | 2,129 (+11%) | 4mo | $431,300 | $203 | 47 |
| 10100 Catalina Dr | 0.68mi | 4/2.5 | 1,742 (-9%) | 7mo | $337,000 | $193 | 47 |
| 9905 Mcwilliams Dr | 0.72mi | 3/2.5 (-1) | 1,758 (-8%) | 10mo | $345,000 | $196 | 39 |
Match score weights: distance 35% · size 25% · config 20% · recency 20%. Top-matched comps best support the ARV.
Projected returns pro-forma
-3.0% appreciation · 1.47% rent growth · sell at horizon
- IRR
- -45.4%
- Equity multiple
- -0.37×
- Total profit
- $-185,201
- Equity at exit
- $72,075
- IRR
- -93.4%
- Equity multiple
- -1.27×
- Total profit
- $-307,688
- Equity at exit
- $41,795
Cash invested: $135,349 (down + closing). Projections, not guarantees.
Landlord ↔ Tenant lean methodology
- Overall (STATE)
- 83 Strongly Landlord-Friendly
- State Iowa
- 83 Strongly Landlord-Friendly · R+6
- County
- — inherits STATE
- City
- — inherits STATE
ZIP-level market 50131
- Home prices YoY
- -26.0%
- Rents YoY
- 1.5%
- Active inventory
- 382
- Price-to-rent
- 11.8×
Monthly cashflow live
- Estimated rent
- $2,185 high interval (Pro) →
- Mortgage (P&I)
- −$2,535
- Tax est. 1.5%
- −$604 /mo · $7,251/yr
- Insurance
- −$201
- HOA
- −$12
- Vacancy / Maint / Mgmt
- −$459
- Net cashflow
- $-1,627
Break-even live
Sensitivity live
| Price | -10% $-1,293 | -5% $-1,460 | +0% $-1,627 | +5% $-1,794 | +10% $-1,961 |
|---|---|---|---|---|---|
| Rent | -10% $-1,799 | -5% $-1,713 | +0% $-1,627 | +5% $-1,540 | +10% $-1,454 |
| Rate | -1.0pp $-1,383 | -0.5pp $-1,504 | base $-1,627 | +0.5pp $-1,752 | +1.0pp $-1,879 |
UW: 25.0% down · 7.5% · 30yr · 1.5% tax · 5.0% vac · 8.0% maint · 8.0% mgmt
Financing live
Cash to close
- Down payment
- $120,847
- Closing costs
- $14,502
- Reserves months
- —
- Total cash needed
- —
Loan-product check · same deal, 3 products live
Conventional
25% down · 7.5% · 30yr
- Down + closing
- —
- Monthly P&I
- —
- Monthly cashflow
- —
- DSCR
- —
- Eligible?
- —
Personal DTI + credit; lowest rate.
DSCR
20% down · 8.5% · 30yr
- Down + closing
- —
- Monthly P&I
- —
- Monthly cashflow
- —
- DSCR
- —
- Eligible?
- —
No personal income docs; deal must DSCR.
Hard money
10% down · 12.0% · 12mo
- Down + closing
- —
- Monthly P&I
- —
- Monthly cashflow
- —
- DSCR
- —
- Eligible?
- —
Short-term bridge; refi at stabilization.
Rent comps 9 comps
| Address | Beds | Baths | Sqft | Rent | $/sqft | DOM | Units | Dist |
|---|---|---|---|---|---|---|---|---|
| 6954 Marigold Ct Johnston, IA | 4.0 | 2.5 | 1709 | $1,995 | $1.17 | 25d | 1 | 0.15mi |
| 6957 Poppy Ct Johnston, IA | 4.0 | 2.5 | 1356 | $2,195 | $1.62 | 45d | 1 | 0.17mi |
| 6957 Poppy Ct Johnston, IA | 4.0 | 2.5 | 1709 | $1,995 | $1.17 | 16d | 1 | 0.17mi |
| 10340 Powell Ave Johnston, IA | 5.0 | 3.0 | 2620 | $3,200 | $1.22 | 16d | 1 | 0.17mi |
| 6923 Bluebell Ct Johnston, IA | 3.0 | 2.5 | 1565 | $1,925 | $1.23 | 16d | 1 | 0.20mi |
| 10425 Dorset Dr Unit 11 Johnston, IA | 3.0 | 2.0 | 1295 | $1,495 | $1.15 | 45d | 1 | 0.96mi |
| 10457 Dorset Dr Unit 11 Johnston, IA | 3.0 | 2.0 | 1295 | $1,495 | $1.15 | 45d | 1 | 0.97mi |
| 1360 NE Primrose Ln Grimes, IA | 3.0 | 1.0–2.5 | 893 | $1,700 | $1.90 | 15d | 37 | 1.13mi |
| 1704 NE Gateway Ct Grimes, IA | 3.0 | 1.0–2.0 | 945 | $1,899 | $2.01 | 15d | 50 | 1.49mi |
HOA detail
- Monthly dues
- $12 · $144/yr
Listing history 18 events
-
2026-06-21days on market $310,000 Active 956 DOM
-
2026-06-18days on market $310,000 Active 953 DOM
-
2026-06-17days on market $310,000 Active 952 DOM
-
2026-06-16days on market $310,000 Active 951 DOM
-
2026-06-15days on market $310,000 Active 950 DOM
-
2026-06-14days on market $310,000 Active 948 DOM
-
2026-06-13days on market $310,000 Active 947 DOM
-
2026-06-10days on market $310,000 Active 945 DOM
-
2026-06-09days on market $310,000 Active 944 DOM
-
2026-06-08days on market $310,000 Active 943 DOM
-
2026-06-07days on market $310,000 Active 942 DOM
-
2026-06-05days on market $310,000 Active 939 DOM
-
2026-06-03days on market $310,000 Active 938 DOM
-
2026-06-02days on market $310,000 Active 937 DOM
-
2026-06-01days on market $310,000 Active 936 DOM
-
2026-05-31days on market $310,000 Active 935 DOM
-
2026-05-31days on market $310,000 Active 934 DOM
-
2023-11-08$310,000 Active 733-char remark
Show marketing remark (733 chars)
Destiny Homes presents its Chatham XL plan. The Chatham XL plan features 4 bedrooms, 2.5 baths and approximately 1,900 sqft of living space. This 2 story home has everything a home should; including ample entertaining space within the open concept kitchen/great room/dining, quartz countertops, kitchen island and pantry. The primary ensuite with walk-in closet, plus 3 additional bedrooms, loft area + huge bonus room, bathroom and laundry room are located on the upper level. All Launch series homes are Energy Star rated & have a 2 year builder warranty. Striking the perfect balance between quality and efficiency, your path to homeownership starts right now! Ask about $2,000 in closing costs provided by preferred lender.
ⓘ Source: listings_history table (triggers on properties + properties_extension) + one-shot
backfill from property_details.listing_events for pre-trigger history.
Climate risk First Street
- Flood 1/10 Low FEMA zone X (unshaded) · 0% chance over 30 yrs
- Wildfire 2/10 Low
- Heat 3/10 Moderate 7 d/yr ≥104°F today · 14 d/yr by 30 yrs out
- Wind 2/10 Low
- Air quality 1/10 Low 0 unhealthy d/yr today · 0 by 30 yrs out
Nearby sold comps map
Loading sold comps map…
Walkable amenities ~0.75 mi
Loading nearby amenities…
Taxation est. · year 1
- Rental income
- $26,218
- − Mortgage interest
- −$27,077
- − Property taxes
- −$7,251
- − Insurance
- −$2,417
- − Repairs & maintenance
- −$2,097
- − Management
- −$2,097
- − HOA
- −$144
- − Depreciation
- −$14,062
- Taxable loss
- −$28,928
- Est. tax savings @ 24.0%
- +$6,943
- After-tax cash flow
- $-12,576/yr
For passive investors: Depreciation is non-cash, so a rental often shows a tax loss while cash-flowing — sheltering income. Rental losses are passive: they offset passive income freely, and up to $25,000/yr can offset ordinary (W-2) income if you actively participate and your MAGI is under $100k (phasing out to $0 by $150k); unused losses carry forward. On sale, claimed depreciation is recaptured at up to 25%, and gains may owe capital-gains tax (a 1031 exchange can defer both). Figures are a year-1 estimate at your 24.0% rate — not tax advice; consult a CPA.
Schools (NCES district)
- District
- Johnston Community School District
- NCES district ID
- 1915450
- Math proficiency
- 78% ▼ -6.00%
- Reading proficiency
- 78% ▼ -3.00%
- Median HH income
- $85,758
- Composite
- 69.43/100
- National rank
- #309
- State rank
- #24 of 289 in IA
Livability — Johnston
- Score
- 81/100
- State rank
- #59
- US rank
- #1344
Category grades
Schools grade is shown separately in the Schools card above.
Census & demographics
- Census place
- Johnston, IA
- County
- Polk County · 453,298 people
- City population
- 24,583
- Metro
- Des Moines-West Des Moines, IA
- Population (ZIP)
- 24,583
- Household income
- $106,551
- Rent vs Own
- Severe rent burden
- 685.0
Population outlook (Polk County) Hauer SSP2
- Today (2025)
- 548,042 people
- By 2030
- 588,557 · +7.4%
- By 2040
- 670,629 · +22.4%
- By 2050
- 752,830 · +37.4%
- By 2075
- 955,069 · +74.3%
- By 2100
- 1,115,436 · +103.5%
Race, ethnicity, and origin ACS 2023
- Neighborhood character
- Predominantly White (79%)
- Race & ethnicity
- White 79% Black 9% Asian 7% Two or more races 3% Hispanic / Latino 2%
- Common ancestry
- Portuguese 4% American 3% Swiss 2%
- Foreign-born
- 9% · China, Canada
- Languages at home
- 88% English-only · Russian/Polish/Slavic 2% Chinese 2% Other Asian/Pacific 2%
Political lean MEDSL · Polk
- 2024 margin
- D (+10.9) · D 54.8% · R 43.9% · Other 1.3%
- 2008→2024 swing
- -3.7pp toward R · 2008: 14.6pp · 2024: 10.9pp
- All cycles
- 2024: D+10.9 2020: D+15.2 2016: D+11.5 2012: D+14.2 2008: D+14.6
Not yet ingested
- Civics
- —
Market trends
- HPI YoY
- ▼ -71.38%
- Current HPI
- 203.3508
- Rent YoY
- ▲ 1.47%
- Metro
- Des Moines-West Des Moines, IA
- State GDP YoY
- ▲ 2.48%
- F500 in state
- 4
Industry mix (Fortune 500 HQ in IA)
| Industry | F500 HQs | Revenue |
|---|---|---|
| Financial Services | 1 | $16B |
|
||
| Retail / Convenience | 1 | $15B |
|
||
Price history
1 event — show timeline
- 2023-11-08 Listed $310,000 Zillow
Cash-flow waterfall
monthlySold comps — $/sqft
last 12 mo · ≤1 miLoading sold comps…