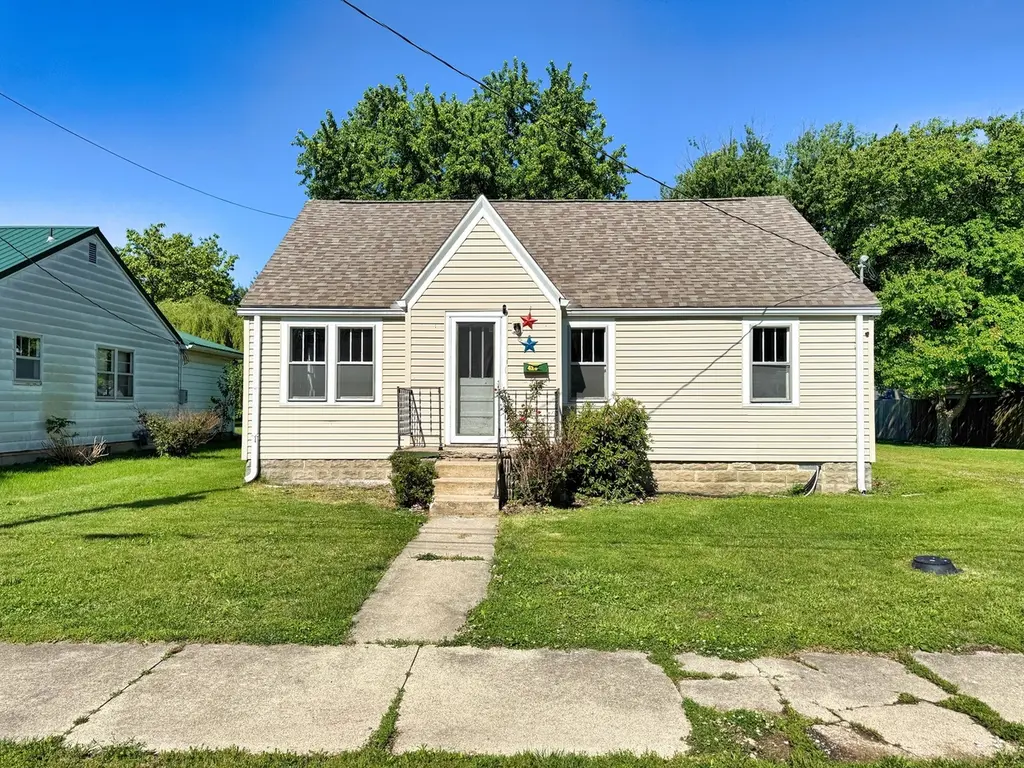
426 S Locust St · Flora, IL
Flood risk 1/10 · Minimal
- FEMA flood zone
- X
- Chance of flooding over 30 yrs
- 0.0%
- Est. flood insurance / yr
- $473 – $860
Fire risk 1/10 · Minimal
- Est. fire insurance / yr
- $804 – $1,492
Heat risk 4/10 · Minor
- Hot days now (above 106°F)
- 7 days/yr
- Hot days in 30 yrs
- 20 days/yr
Wind risk 2/10 · Minimal
- Chance of severe wind over 30 yrs
- 1.0%
Air-quality risk 2/10 · Minimal
- Unhealthy air days now
- 1 days/yr
- Unhealthy air days in 30 yrs
- 2 days/yr
Risk factors via First Street. Map © Google.
Why this score? — see what drove the C- grade
The composite is a weighted blend of 9 inputs, each scored 0–100. Each bar is that input's sub-score; the figure is the points it added to the 100-point composite (weight × sub-score).
- Cash flow +26.5/30.0
- DSCR +9.1/10.0
- 1% rule +6.7/10.0
- Livability +3.2/5.0
- Rent growth +2.5/5.0
- Condition / age +2.5/5.0
- Schools +2.3/10.0
- ARV discount +0.0/15.0
- Appreciation +0.0/10.0
$82,900
🖨 Deal sheet 📄 Offer letter ✓ Due diligence
Listing remarks
Charming 3-bedroom, 1-bath home in a great location near the high school! Offering approximately 1,040 square feet plus a basement, this home combines classic character with practical living space. Inside, you'll find spacious rooms, original woodwork and built-ins, and plenty of natural light throughout. The inviting sunroom provides the perfect spot for morning coffee, a reading nook, or extra living space. The kitchen offers ample cabinet space and flows nicely into the main living areas, while the basement provides additional storage and utility space. A newer roof adds peace of mind, and the home sits on a nicely sized lot with plenty of yard space to enjoy. Conveniently located close
Key facts
- Inviting sunroom
- Newer roof
- Nicely sized lot
Tags
Property features AI
Finance
- Other: School bus and commuter bus service available; Unincorporated location; Directions: From North Avenue, head south onto Locust; proceed south on Locust to 426 — home is on the west side of the road
- HOA & community: No master association fee required
Exterior
- Parking: 2 parking spaces
- Utilities: Public water; Public sewer; Cable available
- Home design: Detached single-family home; Single-story; Fee simple ownership; Built before 1978
- Construction: Vinyl siding; Asphalt roof; House age about 71–80 years; Basement unfinished (approximately 504 sq ft)
- Exterior features: Level lot; Lot dimensions approximately 60 x 130 x 90 x 145
Interior
- Kitchen: Kitchen on main level with vinyl flooring (14 x 10)
- Bedrooms: 3 bedrooms (all on main level); Master bedroom on main level with hardwood flooring (14 x 11); Second bedroom on main level with carpet (10 x 11); Third bedroom on main level with carpet (10 x 10)
- Flooring: Hardwood in master bedroom; Carpet in living room and two bedrooms and sun room; Vinyl in kitchen, foyer, and laundry
- Bathrooms: 1 full bathroom
- Heating & cooling: Natural gas forced air heating
- Interior features: Screens on windows; Five total rooms; Unfinished partial basement
- Laundry & utility: Main-level laundry room with vinyl flooring (11 x 8)
Neighborhood map
What this means for you Summary
Snapshot
- This is a 3-bed/1.0-bath other listed at $83k.
Deal economics
- At list price, monthly cash flow is $220 ($3k/yr) — positive.
- The deal already cash-flows at list — no discount required.
- Meets the 1% rule at list price ($966 rent vs $83k).
- Recommended offer: $80k (3.0% below list) — sets the bar for market timing.
Location & tenants
- Location reads 65/100 on livability (#624 in IL) — a middle-class / working-renter tenant base. Strengths: cost of living A+, housing A+, crime A-; Watch: employment D+, schools F, amenities F.
- Flora CUSD 35 (town): math 17% / reading 37% proficiency, ranked #299 of 620 in IL (top 48%) — low school quality limits family demand, transient renter base, plan for 1-2y turnover.
- Market conditions: 22 active listings in the ZIP; 2 units permitted in Clay County in 2024 (0 in 5+ unit buildings).
Forward outlook
- Local home prices are declining (-3.0%/yr); year-one equity from $573 of loan paydown is wiped out by about $2k of value loss. Plan a longer hold.
- Clay County population projected at -23% by 2050 — secular population decline; favor cash flow + early exit over multi-decade hold.
- At projected returns (-3.0% appreciation + 3.0% rent growth), your $23k cash investment doubles in ~10 years — after that, you're playing with house money.
Negotiation context
- It's been on market 40 days — a 3% lower offer ($80k) is reasonable based on typical stale-listing flexibility.
Risks & watch-outs
- Watch-outs: built in 1949 — expect roof / HVAC / electrical / plumbing capex.
Questions for the listing agent
- It's been on market 40 days. Have you received any prior offers? Is the seller open to a 3% concession, seller financing, or rate buy-down credit?
- Built in 1949 — when were the roof, HVAC, electrical panel, plumbing, and water heater last replaced?
- Is there a deadline driving the sale (1031 exchange, divorce, estate, relocation)? That informs how much negotiation room exists.
- Schools are F-rated, which usually means shorter tenancies and higher turnover. Who's the typical renter profile here, and what's been the actual vacancy rate?
- What's the average days-on-market for RENTAL listings here right now (not sales)? A rising rental-DOM trend means longer vacancies and softer asking-rent achievability than the comps imply.
- What's the recent tenant-quality profile in this submarket — average credit score on applications, eviction rate, late-payment / NSF rate, and stable-employment percentage? A property-management company in the area should have these aggregated.
- How much new for-sale + rental construction is in the pipeline within 1–3 miles? Heavy new supply typically softens prices + rents 12–24 months out; constrained supply supports both.
Investment metrics
- 1% rule
- 1.17% ✓
- Cap rate
- 9.47%
- Cash-on-cash
- 11.35%
- DSCR
- 1.51
- GRM
- 7.2
CMA / ARV
- ARV (median comp)
- $66,353
- List price
- $82,900
- Delta
- 24.94%
- Verdict
- OVERPRICED
- Comps
- 20 within 1.0 mi
Projected returns pro-forma
-3.0% appreciation · 3.0% rent growth · sell at horizon
- IRR
- 0.6%
- Equity multiple
- 1.02×
- Total profit
- $548
- Equity at exit
- $12,361
- IRR
- 10.3%
- Equity multiple
- 1.80×
- Total profit
- $18,471
- Equity at exit
- $7,168
Cash invested: $23,212 (down + closing). Projections, not guarantees.
Landlord ↔ Tenant lean methodology
- Overall (STATE)
- 43 Moderately Tenant-Leaning
- State Illinois
- 43 Moderately Tenant-Leaning · D+7
- County
- — inherits STATE
- City
- — inherits STATE
ZIP-level market 62839
- Home prices YoY
- -11.7%
- Active inventory
- 22
- Price-to-rent
- 7.2×
Monthly cashflow live
- Estimated rent
- $966 medium interval (Pro) →
- Mortgage (P&I)
- −$435
- Tax from tax record
- −$74 /mo · $892/yr
- Insurance
- −$35
- HOA
- −$0
- Vacancy / Maint / Mgmt
- −$203
- Net cashflow
- $220
Break-even live
UW: 25.0% down · 7.5% · 30yr · 1.5% tax · 5.0% vac · 8.0% maint · 8.0% mgmt
Financing live
Cash to close
- Down payment
- $20,725
- Closing costs
- $2,487
- Reserves months
- —
- Total cash needed
- —
Loan-product check · same deal, 3 products live
Conventional
25% down · 7.5% · 30yr
- Down + closing
- —
- Monthly P&I
- —
- Monthly cashflow
- —
- DSCR
- —
- Eligible?
- —
Personal DTI + credit; lowest rate.
DSCR
20% down · 8.5% · 30yr
- Down + closing
- —
- Monthly P&I
- —
- Monthly cashflow
- —
- DSCR
- —
- Eligible?
- —
No personal income docs; deal must DSCR.
Hard money
10% down · 12.0% · 12mo
- Down + closing
- —
- Monthly P&I
- —
- Monthly cashflow
- —
- DSCR
- —
- Eligible?
- —
Short-term bridge; refi at stabilization.
Listing history 16 events
-
2026-06-18days on market $82,900 Active 40 DOM
-
2026-06-17days on market $82,900 Active 39 DOM
-
2026-06-16days on market $82,900 Active 38 DOM
-
2026-06-15days on market $82,900 Active 37 DOM
-
2026-06-13days on market $82,900 Active 35 DOM
-
2026-06-12days on market $82,900 Active 34 DOM
-
2026-06-09days on market $82,900 Active 31 DOM
-
2026-06-08days on market $82,900 Active 30 DOM
-
2026-06-07days on market $82,900 Active 29 DOM
-
2026-06-05days on market $82,900 Active 27 DOM
-
2026-06-04days on market $82,900 Active 25 DOM
-
2026-06-02days on market $82,900 Active 24 DOM
-
2026-06-01days on market $82,900 Active 23 DOM
-
2026-05-31days on market $82,900 Active 22 DOM
-
2026-05-31days on market $82,900 Active 21 DOM
-
2026-05-08$82,900 Active 922-char remark
ⓘ Source: listings_history table (triggers on properties + properties_extension) + one-shot
backfill from property_details.listing_events for pre-trigger history.
Tax reassessment forecast IL · Partial reset (capped growth)
- Current annual tax
- $892 · $74/mo
- Projected year-2 tax
- $1,387 · $116/mo
- Expected delta
- +$495/yr (+$41/mo · 55.5%)
ⓘ Screening estimate from a state-policy table — verify with the county assessor before closing.
Climate risk First Street
- Flood 1/10 Low FEMA zone X · 0% chance over 30 yrs
- Wildfire 1/10 Low
- Heat 4/10 Moderate 7 d/yr ≥106°F today · 20 d/yr by 30 yrs out
- Wind 2/10 Low 100% chance of damaging wind over 30 yrs
- Air quality 2/10 Low 1 unhealthy d/yr today · 2 by 30 yrs out
Nearby sold comps map
Loading sold comps map…
Walkable amenities ~0.75 mi
Loading nearby amenities…
Taxation est. · year 1
- Rental income
- $11,592
- − Mortgage interest
- −$4,644
- − Property taxes
- −$892
- − Insurance
- −$414
- − Repairs & maintenance
- −$927
- − Management
- −$927
- − Depreciation
- −$2,412
- Taxable income
- $1,376
- Est. tax owed @ 24.0%
- −$330
- After-tax cash flow
- $2,305/yr
For passive investors: Depreciation is non-cash, so a rental often shows a tax loss while cash-flowing — sheltering income. Rental losses are passive: they offset passive income freely, and up to $25,000/yr can offset ordinary (W-2) income if you actively participate and your MAGI is under $100k (phasing out to $0 by $150k); unused losses carry forward. On sale, claimed depreciation is recaptured at up to 25%, and gains may owe capital-gains tax (a 1031 exchange can defer both). Figures are a year-1 estimate at your 24.0% rate — not tax advice; consult a CPA.
Schools (NCES district)
- District
- Flora CUSD 35
- NCES district ID
- 1715400
- Math proficiency
- 17% ▼ -4.00%
- Reading proficiency
- 37% ▼ -3.00%
- Median HH income
- $41,463
- Composite
- 22.82/100
- National rank
- #8018
- State rank
- #299 of 620 in IL
Livability — Flora
- Score
- 65/100
- State rank
- #624
- US rank
- #12754
Category grades
Schools grade is shown separately in the Schools card above.
Census & demographics
- Census place
- Flora, IL
- City population
- 6,215
- Population (ZIP)
- 6,215
Population outlook (Clay County) Hauer SSP2
- Today (2025)
- 12,388 people
- By 2030
- 11,808 · -4.7%
- By 2040
- 10,644 · -14.1%
- By 2050
- 9,500 · -23.3%
- By 2075
- 6,985 · -43.6%
- By 2100
- 4,811 · -61.2%
Race, ethnicity, and origin ACS 2023
- Neighborhood character
- Predominantly White (94%)
- Race & ethnicity
- White 94% Two or more races 5%
- Common ancestry
- Romanian 4% Slovak 4% Portuguese 1%
- Foreign-born
- 0%
Political lean MEDSL · Clay
- 2024 margin
- Solid R (+67.3) · D 15.6% · R 82.9% · Other 1.5%
- 2008→2024 swing
- -44.1pp toward R · 2008: -23.3pp · 2024: -67.3pp
- All cycles
- 2024: R+67.3 2020: R+65.2 2016: R+63.6 2012: R+44.1 2008: R+23.3
Not yet ingested
- Civics
- —
Market trends
- HPI YoY
- ▼ -22.09%
- Current HPI
- 166.9939
- Rent YoY
- —
- Metro
- —
- State GDP YoY
- ▲ 1.59%
- F500 in state
- 60
Industry mix (Fortune 500 HQ in IL)
| Industry | F500 HQs | Revenue |
|---|---|---|
| Insurance | 4 | $201B |
|
||
| Consumer Goods | 4 | $87B |
|
||
| Industrial Machinery | 3 | $64B |
|
||
| Healthcare | 2 | $55B |
|
||
| Retail / Pharmacy | 1 | $148B |
|
||
| Agriculture / Food | 1 | $86B |
|
||
Price history
1 event — show timeline
- 2026-05-08 Listed $82,900 MRED as Distributed by MLS Grid
Property tax history
+2.4%/yrLatest (2024): $892 · +3.9% YoY. Source: county tax records.
Cash-flow waterfall
monthlySold comps — $/sqft
last 12 mo · ≤1 miLoading sold comps…