40 E 43rd St Unit 3B · New York, NY
Flood risk 4/10 · Minor
- FEMA flood zone
- X (unshaded)
- Chance of flooding over 30 yrs
- 0.2%
- Est. flood insurance / yr
- $507 – $1,088
Fire risk 1/10 · Minimal
- Est. fire insurance / yr
- $691 – $1,283
Heat risk 6/10 · Moderate
- Hot days now (above 99°F)
- 7 days/yr
- Hot days in 30 yrs
- 15 days/yr
Wind risk 6/10 · Moderate
- Chance of severe wind over 30 yrs
- 64.0%
Air-quality risk 5/10 · Moderate
- Unhealthy air days now
- 6 days/yr
- Unhealthy air days in 30 yrs
- 8 days/yr
Risk factors via First Street. Map © Google.
Why this score? — see what drove the C+ grade
The composite is a weighted blend of 9 inputs, each scored 0–100. Each bar is that input's sub-score; the figure is the points it added to the 100-point composite (weight × sub-score).
- Cash flow +26.1/30.0
- DSCR +8.8/10.0
- ARV discount +7.5/15.0
- 1% rule +6.9/10.0
- Schools +5.0/10.0
- Livability +3.8/5.0
- Rent growth +3.2/5.0
- Condition / age +2.5/5.0
- Appreciation +0.0/10.0
$275,000
🖨 Deal sheet (PDF) 📄 Offer letter ✓ Due diligence
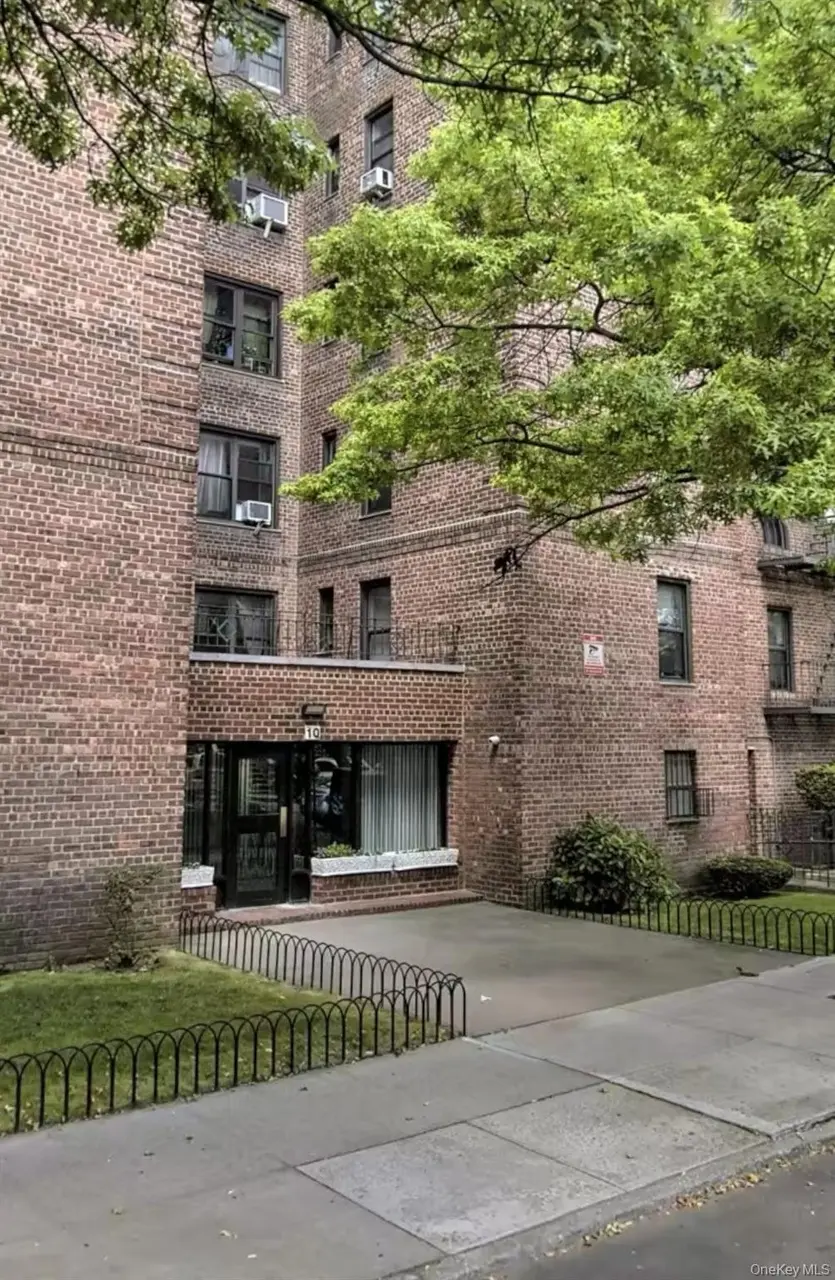
Listing remarks
.Bright and well maintained two bedroom, one bath co-op with a spacious layout and updated finishes throughout. The large living room features hardwood floors and large windows that bring in excellent natural light. The kitchen offers stainless steel appliances, ample cabinet storage, and generous counter space. Both bedrooms are comfortably sized with flexibility for a home office or guest room. Located in a convenient residential section of Brooklyn, 40 E 43rd Street offers easy access to neighborhood shopping, restaurants, schools, and everyday conveniences. Transportation is a major highlight, with nearby access to the 2 and 5 subway lines as well as several bus routes, making commuting
Key facts
- Built 1964
- Listed 29 days
Property features AI
Exterior
- Parking: On-street parking
- Utilities: Electricity connected; Natural gas connected; Public water; Public sewer; Public trash collection
- Home design: Stock cooperative; One level
- Construction: Brick construction
- Exterior features: Brick construction; Not waterfront
Interior
- Kitchen: Dishwasher; Gas range; Refrigerator; Stainless steel appliances
- Bedrooms: 3rd floor entry level
- Bathrooms: 1 full bathroom
- Heating & cooling: Steam heat; Wall/window air conditioning units
- Interior features: Eat-in kitchen; Elevator access
Neighborhood map
What this means for you Summary
Snapshot
- This is a 2-bed/1.0-bath condo listed at $275k.
Deal economics
- At list price, monthly cash flow is $694 ($8k/yr) — positive.
- The deal already cash-flows at list — no discount required.
- Meets the 1% rule at list price ($3k rent vs $275k).
- Recommended offer: $271k (1.5% below list) — sets the bar for market timing.
- Cap rate 9.3% vs local median 2.6% in New York — top-decile yield for the area; either an underpriced asset or a hidden risk that comps aren't pricing in. Stress-test before assuming the spread holds.
Location & tenants
- Location reads 75/100 on livability (#268 in NY, #4,188 nationally) — a middle-class / working-renter tenant base. Strengths: amenities A+, commute A+, health & safety A; Watch: crime F, cost of living F.
- Zoned schools: Ps 235 Janice Marie Knight School (math 47% / reading 72%, grade B-, #745 of 2,108 statewide, top 39%, 952 students, 74% FRL); Jhs 383 Philippa Schuyler (math 32% / reading 67%, grade C, #280 of 729 statewide, top 40%, 822 students, 85% FRL); Midwood High School (math 94% / reading 96%, grade A+, #83 of 1,100 statewide, top 8%, 4,062 students, 73% FRL).
- Market conditions: Rents rising (+2.9%/yr); 190 active listings in the ZIP; 6 comparable units currently listed for rent nearby; rentals at typical pace (median 26d on market — plan ~3-4 weeks tenant-placement turnaround); 10,063 units permitted in Kings County in 2024 (9,789 in 5+ unit buildings).
- At $3,284/mo this rent would consume 58% of the median local household income ($68k/yr) (locally 5458% of renters already pay >50% of income on rent) — very limited rent-growth headroom before tenants either downsize or default.
Forward outlook
- Local home prices are declining (-3.0%/yr); year-one equity from $2k of loan paydown is wiped out by about $8k of value loss. Plan a longer hold.
- Kings County population projected at +13% by 2050 — modest demand growth; plan on rents tracking national, not racing it.
Negotiation context
- It's been on market 29 days — a 2% lower offer ($271k) is reasonable based on typical stale-listing flexibility.
- 4 sale attempts since 11y ago with the ask held roughly flat each time — persistent listings suggest the price (not the market) is what's stuck; bring a comps-based counter.
Risks & watch-outs
- Climate carrying-cost: major wind risk, 64% chance of damaging wind over 30y; extreme-heat days projected 7→15/yr by 2055 (HVAC capex compounding) — expect insurance premiums to compound above CPI over the hold.
Questions for the listing agent
- Built in 1964 — when were the roof, HVAC, electrical panel, plumbing, and water heater last replaced?
- Any open or pending special assessments — roof, HVAC, plumbing, elevator, façade? What's the per-unit balance and payoff schedule, and is the seller paying it off at close or rolling it to the buyer?
- Is there a deadline driving the sale (1031 exchange, divorce, estate, relocation)? That informs how much negotiation room exists.
- Schools are B-rated — typically a magnet for longer-tenancy family renters. What's the average tenant stay here, and is there a school-zone premium baked into asking?
- Crime grade is F in this area — have there been break-ins, vandalism, or insurance claims at this property in the last 3 years? What carrier currently insures it and at what premium?
- What's the average days-on-market for RENTAL listings here right now (not sales)? A rising rental-DOM trend means longer vacancies and softer asking-rent achievability than the comps imply.
- What's the recent tenant-quality profile in this submarket — average credit score on applications, eviction rate, late-payment / NSF rate, and stable-employment percentage? A property-management company in the area should have these aggregated.
- How much new apartment / multifamily construction is in the pipeline within 1–3 miles? Heavy new supply (>2% of stock underway) typically softens rents 12–24 months out; light construction supports rent growth.
Investment metrics
- 1% rule
- 1.19% ✓
- Cap rate
- 9.32%
- Cash-on-cash
- 10.82%
- DSCR
- 1.48
- GRM
- 7.0
CMA / ARV
No comps found within radius.
Projected returns pro-forma
-3.0% appreciation · 2.89% rent growth · sell at horizon
- IRR
- -0.2%
- Equity multiple
- 0.99×
- Total profit
- $-668
- Equity at exit
- $41,003
- IRR
- 9.3%
- Equity multiple
- 1.72×
- Total profit
- $55,058
- Equity at exit
- $23,777
Cash invested: $77,000 (down + closing). Projections, not guarantees.
Landlord ↔ Tenant lean methodology
- Overall (CITY)
- 0 Strongly Tenant-Friendly
- State New York
- 15 Strongly Tenant-Friendly · D+10
- County
- — inherits STATE
- City New York
- 0 Strongly Tenant-Friendly · D+34
ZIP-level market 11203
- Rents YoY
- 2.9%
- Active inventory
- 190
- Price-to-rent
- 7.0×
Monthly cashflow live
- Estimated rent
- $3,284 high interval (Pro) →
- Mortgage (P&I)
- −$1,442
- Tax est. 1.5%
- −$344 /mo · $4,125/yr
- Insurance
- −$115
- HOA
- −$0
- Vacancy / Maint / Mgmt
- −$690
- Net cashflow
- $694
Break-even live
Sensitivity live
| Price | -10% $884 | -5% $789 | +0% $694 | +5% $599 | +10% $504 |
|---|---|---|---|---|---|
| Rent | -10% $435 | -5% $564 | +0% $694 | +5% $824 | +10% $954 |
| Rate | -1.0pp $833 | -0.5pp $764 | base $694 | +0.5pp $623 | +1.0pp $550 |
UW: 25.0% down · 7.5% · 30yr · 1.5% tax · 5.0% vac · 8.0% maint · 8.0% mgmt
Financing live
Cash to close
- Down payment
- $68,750
- Closing costs
- $8,250
- Reserves months
- —
- Total cash needed
- —
Loan-product check · same deal, 3 products live
Conventional
25% down · 7.5% · 30yr
- Down + closing
- —
- Monthly P&I
- —
- Monthly cashflow
- —
- DSCR
- —
- Eligible?
- —
Personal DTI + credit; lowest rate.
DSCR
20% down · 8.5% · 30yr
- Down + closing
- —
- Monthly P&I
- —
- Monthly cashflow
- —
- DSCR
- —
- Eligible?
- —
No personal income docs; deal must DSCR.
Hard money
10% down · 12.0% · 12mo
- Down + closing
- —
- Monthly P&I
- —
- Monthly cashflow
- —
- DSCR
- —
- Eligible?
- —
Short-term bridge; refi at stabilization.
Rent comps 6 comps
| Address | Beds | Baths | Sqft | Rent | $/sqft | DOM | Units | Dist |
|---|---|---|---|---|---|---|---|---|
| 361 Winthrop St Brooklyn, NY | 3.0 | 4.0 | 500 | $1,510 | $3.02 | 6d | 1 | 0.54mi |
| 256 E 55th St #1 Brooklyn, NY | 2.0 | 1.0 | 1200 | $2,600 | $2.17 | 26d | 1 | 0.68mi |
| 1266 Park Pl Unit 1A Brooklyn, NY | 2.0 | 1.5 | 886 | $3,250 | $3.67 | 26d | 1 | 1.21mi |
| 819 Saratoga Ave Brooklyn, NY | 3.0 | 1.5 | 1300 | $3,350 | $2.58 | 26d | 1 | 1.27mi |
| 800 Park Pl Unit 3R Brooklyn, NY | 2.0 | 2.0 | 1300 | $6,995 | $5.38 | 26d | 1 | 1.44mi |
| 762 Park Pl Unit 3B Brooklyn, NY | 3.0 | 2.0 | 1114 | $5,400 | $4.85 | 26d | 1 | 1.47mi |
HOA detail condo
- Monthly dues
- $0 · $0/yr
- Assessments
- None detected in remarks — confirm with the listing agent.
Listing history 22 events
-
2026-06-21days on market $275,000 Active 29 DOM
-
2026-06-18days on market $275,000 Active 26 DOM
-
2026-06-17days on market $275,000 Active 25 DOM
-
2026-06-16days on market $275,000 Active 24 DOM
-
2026-06-15days on market $275,000 Active 23 DOM
-
2026-06-13days on market $275,000 Active 21 DOM
-
2026-06-10days on market $275,000 Active 17 DOM
-
2026-06-08days on market $275,000 Active 16 DOM
-
2026-06-08days on market $275,000 Active 15 DOM
-
2026-06-04days on market $275,000 Active 12 DOM
-
2026-06-03days on market $275,000 Active 11 DOM
-
2026-06-02days on market $275,000 Active 10 DOM
-
2026-06-01days on market $275,000 Active 9 DOM
-
2026-05-31days on market $275,000 Active 8 DOM
-
2026-05-22$275,000 Active
-
2025-11-01historical
-
2025-08-14price $289,900
-
2025-04-05status Active
-
2025-02-18status Pending
-
2024-10-12$289,999 Active
-
2015-07-24historical
-
2015-04-28$170,000
ⓘ Source: listings_history table (triggers on properties + properties_extension) + one-shot
backfill from property_details.listing_events for pre-trigger history.
Climate risk First Street
- Flood 4/10 Moderate FEMA zone X (unshaded) · 20% chance over 30 yrs
- Wildfire 1/10 Low
- Heat 6/10 Major 7 d/yr ≥99°F today · 15 d/yr by 30 yrs out
- Wind 6/10 Major 64% chance of damaging wind over 30 yrs
- Air quality 5/10 Major 6 unhealthy d/yr today · 8 by 30 yrs out
Nearby sold comps map
Loading sold comps map…
Walkable amenities ~0.75 mi
Loading nearby amenities…
Taxation est. · year 1
- Rental income
- $39,411
- − Mortgage interest
- −$15,404
- − Property taxes
- −$4,125
- − Insurance
- −$1,375
- − Repairs & maintenance
- −$3,153
- − Management
- −$3,153
- − Depreciation
- −$8,000
- Taxable income
- $4,201
- Est. tax owed @ 24.0%
- −$1,008
- After-tax cash flow
- $7,321/yr
For passive investors: Depreciation is non-cash, so a rental often shows a tax loss while cash-flowing — sheltering income. Rental losses are passive: they offset passive income freely, and up to $25,000/yr can offset ordinary (W-2) income if you actively participate and your MAGI is under $100k (phasing out to $0 by $150k); unused losses carry forward. On sale, claimed depreciation is recaptured at up to 25%, and gains may owe capital-gains tax (a 1031 exchange can defer both). Figures are a year-1 estimate at your 24.0% rate — not tax advice; consult a CPA.
Schools (NCES district)
No district data.
Livability — New York
- Score
- 75/100
- State rank
- #268
- US rank
- #4188
Category grades
Schools grade is shown separately in the Schools card above.
Census & demographics
- Census place
- New York, NY
- County
- Kings County · 2,614,986 people
- City population
- 7,731,280
- Metro
- New York-Newark-Jersey City, NY-NJ-PA
- Population (ZIP)
- 74,817
- Household income
- $67,897
- Rent vs Own
- Severe rent burden
- 5458.0
Population outlook (Kings County) Hauer SSP2
- Today (2025)
- 2,847,441 people
- By 2030
- 2,937,006 · +3.1%
- By 2040
- 3,095,491 · +8.7%
- By 2050
- 3,228,968 · +13.4%
- By 2075
- 3,321,723 · +16.7%
- By 2100
- 3,111,387 · +9.3%
Race, ethnicity, and origin ACS 2023
- Neighborhood character
- Predominantly Black (78%)
- Race & ethnicity
- Black 78% Two or more races 10% Hispanic / Latino 7% White 5% Asian 2%
- Hispanic origin (detail)
- Puerto Rican 2% Dominican 1%
- Common ancestry
- Hispanic 9%
- Foreign-born
- 49% · Canada, Mexico, China
- Languages at home
- 81% English-only · French/Haitian/Cajun 10% Spanish 5% Other Indo-European 1%
Political lean MEDSL · Kings
- 2024 margin
- Solid D (+44.0) · D 72.0% · R 28.0%
- 2008→2024 swing
- -15.5pp toward R · 2008: 59.4pp · 2024: 44.0pp
- All cycles
- 2024: D+44.0 2020: D+54.8 2016: D+61.8 2012: D+63.9 2008: D+59.4
Not yet ingested
- Civics
- —
Market trends
- HPI YoY
- ▼ -572.37%
- Current HPI
- 379.2379
- Rent YoY
- ▲ 2.89%
- Metro
- New York-Newark-Jersey City, NY-NJ-PA
- State GDP YoY
- ▲ 2.60%
- F500 in state
- 92
Industry mix (Fortune 500 HQ in NY)
| Industry | F500 HQs | Revenue |
|---|---|---|
| Financial Services | 10 | $950B |
|
||
| Consumer Goods | 9 | $162B |
|
||
| Insurance | 4 | $225B |
|
||
| Telecommunications | 2 | $144B |
|
||
| Pharmaceuticals | 2 | $112B |
|
||
| Media / Entertainment | 2 | $69B |
|
||
Price history
+61.8% since first listed8 events — show timeline
- 2026-05-22 Listed $275,000 OneKey® MLS as Distributed by MLS Grid
- 2025-11-01 Listing Removed — OneKey® MLS as Distributed by MLS Grid
- 2025-08-14 Price Changed $289,900 OneKey® MLS as Distributed by MLS Grid
- 2025-04-05 Relisted — OneKey® MLS as Distributed by MLS Grid
- 2025-02-18 Pending — OneKey® MLS as Distributed by MLS Grid
- 2024-10-12 Listed $289,999 OneKey® MLS as Distributed by MLS Grid
- 2015-07-24 Listing Removed — OneKey® MLS as Distributed by MLS Grid
- 2015-04-28 Listed $170,000 OneKey® MLS as Distributed by MLS Grid
Cash-flow waterfall
monthlySold comps — $/sqft
last 12 mo · ≤1 miLoading sold comps…