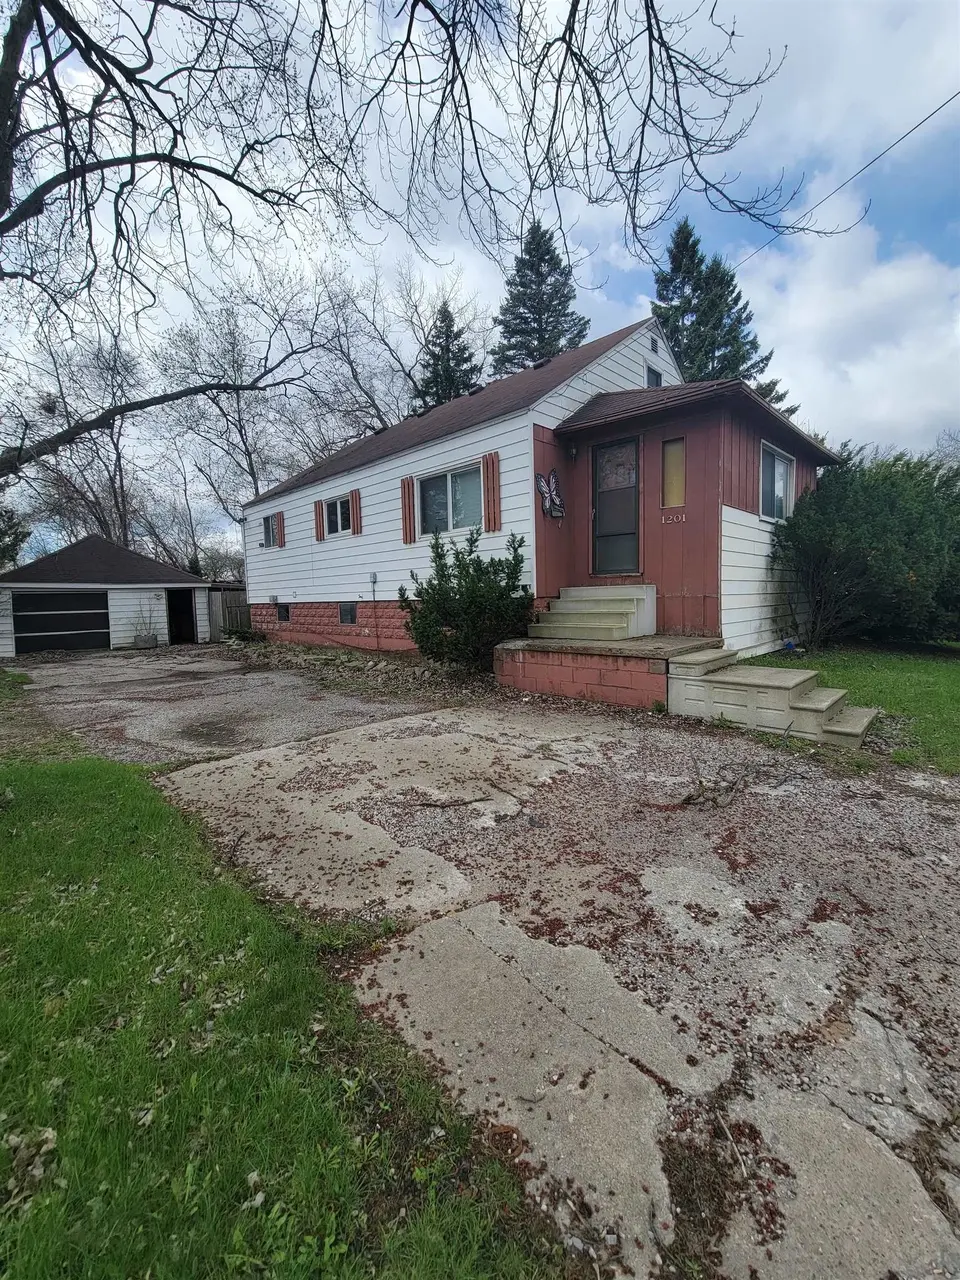
1201 W Jenny St · Bay City, MI
Flood risk 1/10 · Minimal
- FEMA flood zone
- X (unshaded)
- Chance of flooding over 30 yrs
- 0.0%
- Est. flood insurance / yr
- $507 – $1,088
Fire risk 1/10 · Minimal
- Est. fire insurance / yr
- $784 – $1,456
Heat risk 2/10 · Minimal
- Hot days now (above 97°F)
- 7 days/yr
- Hot days in 30 yrs
- 14 days/yr
Wind risk 1/10 · Minimal
- Chance of severe wind over 30 yrs
- —
Air-quality risk 2/10 · Minimal
- Unhealthy air days now
- 1 days/yr
- Unhealthy air days in 30 yrs
- 2 days/yr
Risk factors via First Street. Map © Google.
Why this score? — see what drove the B+ grade
The composite is a weighted blend of 9 inputs, each scored 0–100. Each bar is that input's sub-score; the figure is the points it added to the 100-point composite (weight × sub-score).
- Cash flow +30.0/30.0
- ARV discount +15.0/15.0
- 1% rule +10.0/10.0
- DSCR +10.0/10.0
- Livability +3.4/5.0
- Schools +3.1/10.0
- Rent growth +2.5/5.0
- Condition / age +2.5/5.0
- Appreciation +0.0/10.0
$69,900
🖨 Deal sheet 📄 Offer letter ✓ Due diligence
Listing remarks MLS
newer furnace HWheater and electrical service now jus t need you finish off as our own kitchen and bath are gutted ready to be redone full upper attic has 1 older finished room closet stairs to access endless possibilities here take it to a new level by adding a finished level. has afenced back yard deck and garage workshop zoned O-1 giving you some in home office possibilities great opportunity here
Key facts
- Newer furnace
- Hwheater
- Fenced back yard
Tags
Neighborhood map
What this means for you Summary
Snapshot
- This is a 3-bed/1.5-bath single-family listed at $70k.
Deal economics
- At list price, monthly cash flow is $442 ($5k/yr) — positive.
- The deal already cash-flows at list — no discount required.
- Meets the 1% rule at list price ($1k rent vs $70k).
- Recommended offer: $68k (3.0% below list) — sets the bar for market timing.
- Cap rate 13.9% vs local median 5.5% in Bay City — top-decile yield for the area; either an underpriced asset or a hidden risk that comps aren't pricing in. Stress-test before assuming the spread holds.
Location & tenants
- Location reads 68/100 on livability (#360 in MI) — a middle-class / working-renter tenant base. Strengths: cost of living A+, housing A+, health & safety A+; Watch: schools D+, amenities D, crime F.
- Bangor Township Schools (suburban): math 26% / reading 46% proficiency, ranked #271 of 540 in MI (top 50%) — families likely to look elsewhere, expect single-tenant / working-renter base with shorter leases.
- Market conditions: 246 active listings in the ZIP; 39 units permitted in Bay County in 2024 (0 in 5+ unit buildings).
Forward outlook
- Local home prices are declining (-3.0%/yr); year-one equity from $483 of loan paydown is wiped out by about $2k of value loss. Plan a longer hold.
- Bay County population projected at -21% by 2050 — secular population decline; favor cash flow + early exit over multi-decade hold.
- At projected returns (-3.0% appreciation + 3.0% rent growth), your $20k cash investment doubles in ~5 years — after that, you're playing with house money.
Negotiation context
- It's been on market 60 days — a 3% lower offer ($68k) is reasonable based on typical stale-listing flexibility.
- 3 sale attempts since 5y ago with the ask held roughly flat each time — persistent listings suggest the price (not the market) is what's stuck; bring a comps-based counter.
- Current owner paid $32k; list at $70k implies a 115% gain — meaningful room to come down on a strong offer.
Risks & watch-outs
- Watch-outs: property tax is 2.5% of price; built in 1920 — expect roof / HVAC / electrical / plumbing capex.
Questions for the listing agent
- It's been on market 60 days. Have you received any prior offers? Is the seller open to a 3% concession, seller financing, or rate buy-down credit?
- Built in 1920 — when were the roof, HVAC, electrical panel, plumbing, and water heater last replaced?
- Property tax is high relative to price — has the assessment been appealed recently, and will the sale trigger a re-assessment?
- Is there a deadline driving the sale (1031 exchange, divorce, estate, relocation)? That informs how much negotiation room exists.
- Schools are D-rated, which usually means shorter tenancies and higher turnover. Who's the typical renter profile here, and what's been the actual vacancy rate?
- Crime grade is F in this area — have there been break-ins, vandalism, or insurance claims at this property in the last 3 years? What carrier currently insures it and at what premium?
- What's the average days-on-market for RENTAL listings here right now (not sales)? A rising rental-DOM trend means longer vacancies and softer asking-rent achievability than the comps imply.
- What's the recent tenant-quality profile in this submarket — average credit score on applications, eviction rate, late-payment / NSF rate, and stable-employment percentage? A property-management company in the area should have these aggregated.
- How much new for-sale + rental construction is in the pipeline within 1–3 miles? Heavy new supply typically softens prices + rents 12–24 months out; constrained supply supports both.
Investment metrics
- 1% rule
- 1.78% ✓
- Cap rate
- 13.88%
- Cash-on-cash
- 27.09%
- DSCR
- 2.21
- GRM
- 4.7
CMA / ARV
- ARV (median comp)
- $124,770
- List price
- $69,900
- Delta
- -43.98%
- Verdict
- UNDERPRICED
- Comps
- 20 within 1.0 mi
Show comp detail 12 sales within ~0.75 mi
| Address | Dist | Beds/Ba | Sqft | Sold | Price | $/sf | Match |
|---|---|---|---|---|---|---|---|
| 1507 W White St | 0.26mi | 3/1.0 | 1,056 (-5%) | 0mo | $175,000 | $166 | 76 |
| 604 S Barclay St | 0.25mi | 3/1.0 | 1,003 (-10%) | 1mo | $127,000 | $127 | 69 |
| 607 W Jenny St | 0.28mi | 3/1.0 | 1,236 (+11%) | 3mo | $100,000 | $81 | 64 |
| 214 S Warner St | 0.46mi | 3/1.0 | 1,042 (-7%) | 4mo | $113,000 | $108 | 62 |
| 215 S Kiesel St | 0.36mi | 2/1.0 (-1) | 1,041 (-7%) | 7mo | $140,000 | $134 | 60 |
| 4543 Westfield Ct | 0.66mi | 3/1.0 | 1,100 (-1%) | 7mo | $145,000 | $132 | 59 |
| 315 S Alp St | 0.29mi | 2/2.0 (-1) | 1,223 (+10%) | 6mo | $130,000 | $106 | 59 |
| 313 S Alp St | 0.29mi | 2/2.0 (-1) | 981 (-12%) | 1mo | $165,000 | $168 | 58 |
| 312 S Barclay St | 0.15mi | 2/1.0 (-1) | 1,271 (+14%) | 7mo | $160,000 | $126 | 57 |
| 3118 E Fisher Rd | 0.61mi | 2/1.5 (-1) | 1,056 (-5%) | 2mo | $155,000 | $147 | 56 |
| 304 S Erie St | 0.55mi | 3/1.0 | 1,011 (-9%) | 3mo | $90,000 | $89 | 54 |
| 613 S Wenona Ave | 0.66mi | 2/1.0 (-1) | 992 (-11%) | 0mo | $92,000 | $93 | 43 |
Match score weights: distance 35% · size 25% · config 20% · recency 20%. Top-matched comps best support the ARV.
Projected returns pro-forma
-3.0% appreciation · 3.0% rent growth · sell at horizon
- IRR
- 21.1%
- Equity multiple
- 1.86×
- Total profit
- $16,873
- Equity at exit
- $10,422
- IRR
- 29.3%
- Equity multiple
- 3.61×
- Total profit
- $51,159
- Equity at exit
- $6,044
Cash invested: $19,572 (down + closing). Projections, not guarantees.
Landlord ↔ Tenant lean methodology
- Overall (STATE)
- 62 Landlord-Friendly
- State Michigan
- 62 Landlord-Friendly · EVEN
- County
- — inherits STATE
- City
- — inherits STATE
ZIP-level market 48706
- Active inventory
- 246
- Price-to-rent
- 4.7×
Monthly cashflow live
- Estimated rent
- $1,246 medium interval (Pro) →
- Mortgage (P&I)
- −$367
- Tax from tax record
- −$147 /mo · $1,761/yr
- Insurance
- −$29
- HOA
- −$0
- Vacancy / Maint / Mgmt
- −$262
- Net cashflow
- $442
Break-even live
UW: 25.0% down · 7.5% · 30yr · 1.5% tax · 5.0% vac · 8.0% maint · 8.0% mgmt
Financing live
Cash to close
- Down payment
- $17,475
- Closing costs
- $2,097
- Reserves months
- —
- Total cash needed
- —
Loan-product check · same deal, 3 products live
Conventional
25% down · 7.5% · 30yr
- Down + closing
- —
- Monthly P&I
- —
- Monthly cashflow
- —
- DSCR
- —
- Eligible?
- —
Personal DTI + credit; lowest rate.
DSCR
20% down · 8.5% · 30yr
- Down + closing
- —
- Monthly P&I
- —
- Monthly cashflow
- —
- DSCR
- —
- Eligible?
- —
No personal income docs; deal must DSCR.
Hard money
10% down · 12.0% · 12mo
- Down + closing
- —
- Monthly P&I
- —
- Monthly cashflow
- —
- DSCR
- —
- Eligible?
- —
Short-term bridge; refi at stabilization.
Listing history 22 events
-
2026-06-19days on market $69,900 Active 60 DOM
-
2026-06-18days on market $69,900 Active 59 DOM
-
2026-06-17days on market $69,900 Active 58 DOM
-
2026-06-16days on market $69,900 Active 57 DOM
-
2026-06-15days on market $69,900 Active 56 DOM
-
2026-06-14days on market $69,900 Active 54 DOM
-
2026-06-12days on market $69,900 Active 53 DOM
-
2026-06-09days on market $69,900 Active 50 DOM
-
2026-06-08days on market $69,900 Active 49 DOM
-
2026-06-07days on market $69,900 Active 48 DOM
-
2026-06-03days on market $69,900 Active 44 DOM
-
2026-06-02days on market $69,900 Active 43 DOM
-
2026-06-01days on market $69,900 Active 42 DOM
-
2026-05-31days on market $69,900 Active 41 DOM
-
2026-05-30days on market $69,900 Active 40 DOM
-
2026-04-19$69,900 Active 406-char remark
Show marketing remark (406 chars)
newer furnace HWheater and electrical service now jus t need you finish off as our own kitchen and bath are gutted ready to be redone full upper attic has 1 older finished room closet stairs to access endless possibilities here take it to a new level by adding a finished level. has afenced back yard deck and garage workshop zoned O-1 giving you some in home office possibilities great opportunity here
-
2021-05-28soldstatus $32,500 Closed 157-char remark
Show marketing remark (157 chars)
ESTATE COULD BE USED AS A RENTAL- 3 BEDROOMS, LARGE LIVING ROOM, FENCED BACK YARD, BACK DECK. CAN DRIVE ONTO DRIVEWAY EAST OF PROPERTY TO GET INTO DRIVEWAY.
-
2021-05-13status Pending 157-char remark
Show marketing remark (157 chars)
ESTATE COULD BE USED AS A RENTAL- 3 BEDROOMS, LARGE LIVING ROOM, FENCED BACK YARD, BACK DECK. CAN DRIVE ONTO DRIVEWAY EAST OF PROPERTY TO GET INTO DRIVEWAY.
-
2021-05-10status Active 157-char remark
Show marketing remark (157 chars)
ESTATE COULD BE USED AS A RENTAL- 3 BEDROOMS, LARGE LIVING ROOM, FENCED BACK YARD, BACK DECK. CAN DRIVE ONTO DRIVEWAY EAST OF PROPERTY TO GET INTO DRIVEWAY.
-
2021-05-09historical Keep Showing-Contgcy Appl 157-char remark
Show marketing remark (157 chars)
ESTATE COULD BE USED AS A RENTAL- 3 BEDROOMS, LARGE LIVING ROOM, FENCED BACK YARD, BACK DECK. CAN DRIVE ONTO DRIVEWAY EAST OF PROPERTY TO GET INTO DRIVEWAY.
-
2021-05-05price $39,900 157-char remark
Show marketing remark (157 chars)
ESTATE COULD BE USED AS A RENTAL- 3 BEDROOMS, LARGE LIVING ROOM, FENCED BACK YARD, BACK DECK. CAN DRIVE ONTO DRIVEWAY EAST OF PROPERTY TO GET INTO DRIVEWAY.
-
2021-04-07$43,900 Active 157-char remark
Show marketing remark (157 chars)
ESTATE COULD BE USED AS A RENTAL- 3 BEDROOMS, LARGE LIVING ROOM, FENCED BACK YARD, BACK DECK. CAN DRIVE ONTO DRIVEWAY EAST OF PROPERTY TO GET INTO DRIVEWAY.
ⓘ Source: listings_history table (triggers on properties + properties_extension) + one-shot
backfill from property_details.listing_events for pre-trigger history.
Tax reassessment forecast MI · Partial reset (capped growth)
- Current annual tax
- $1,761 · $147/mo
- Projected year-2 tax
- $1,761 · $147/mo
- Expected delta
- $0/yr ($0/mo · 0.0%)
ⓘ Screening estimate from a state-policy table — verify with the county assessor before closing.
Climate risk First Street
- Flood 1/10 Low FEMA zone X (unshaded) · 0% chance over 30 yrs
- Wildfire 1/10 Low
- Heat 2/10 Low 7 d/yr ≥97°F today · 14 d/yr by 30 yrs out
- Wind 1/10 Low
- Air quality 2/10 Low 1 unhealthy d/yr today · 2 by 30 yrs out
Nearby sold comps map
Loading sold comps map…
Walkable amenities ~0.75 mi
Loading nearby amenities…
Taxation est. · year 1
- Rental income
- $14,952
- − Mortgage interest
- −$3,915
- − Property taxes
- −$1,761
- − Insurance
- −$350
- − Repairs & maintenance
- −$1,196
- − Management
- −$1,196
- − Depreciation
- −$2,033
- Taxable income
- $4,500
- Est. tax owed @ 24.0%
- −$1,080
- After-tax cash flow
- $4,223/yr
For passive investors: Depreciation is non-cash, so a rental often shows a tax loss while cash-flowing — sheltering income. Rental losses are passive: they offset passive income freely, and up to $25,000/yr can offset ordinary (W-2) income if you actively participate and your MAGI is under $100k (phasing out to $0 by $150k); unused losses carry forward. On sale, claimed depreciation is recaptured at up to 25%, and gains may owe capital-gains tax (a 1031 exchange can defer both). Figures are a year-1 estimate at your 24.0% rate — not tax advice; consult a CPA.
Schools (NCES district)
- District
- Bangor Township Schools
- NCES district ID
- 2603900
- Math proficiency
- 26% ▼ -11.00%
- Reading proficiency
- 46% ▼ -2.00%
- Median HH income
- $44,665
- Composite
- 30.59/100
- National rank
- #6200
- State rank
- #271 of 540 in MI
Livability — Bay City
- Score
- 68/100
- State rank
- #360
- US rank
- #8912
Category grades
Schools grade is shown separately in the Schools card above.
Census & demographics
- City population
- 25,635
- Population (ZIP)
- 38,756
Population outlook (Bay County) Hauer SSP2
- Today (2025)
- 101,476 people
- By 2030
- 98,152 · -3.3%
- By 2040
- 89,711 · -11.6%
- By 2050
- 80,614 · -20.6%
- By 2075
- 60,544 · -40.3%
- By 2100
- 41,603 · -59.0%
Race, ethnicity, and origin ACS 2023
- Neighborhood character
- Predominantly White (90%)
- Race & ethnicity
- White 90% Hispanic / Latino 5% Two or more races 4%
- Common ancestry
- Romanian 16% Lithuanian 9% Slovak 2%
- Foreign-born
- 1%
- Languages at home
- 98% English-only · Spanish 1%
Political lean MEDSL · Bay
- 2024 margin
- R (+14.7) · D 42.0% · R 56.7% · Other 1.3%
- 2008→2024 swing
- -30.0pp toward R · 2008: 15.3pp · 2024: -14.7pp
- All cycles
- 2024: R+14.7 2020: R+11.6 2016: R+12.6 2012: D+6.0 2008: D+15.3
Not yet ingested
- Civics
- —
Market trends
- HPI YoY
- ▼ -133.29%
- Current HPI
- 203.6444
- Rent YoY
- —
- Metro
- —
- State GDP YoY
- ▲ 1.37%
- F500 in state
- 28
Industry mix (Fortune 500 HQ in MI)
| Industry | F500 HQs | Revenue |
|---|---|---|
| Automotive Parts | 3 | $48B |
|
||
| Automotive | 2 | $372B |
|
||
| Chemicals | 1 | $45B |
|
||
| Automotive Retail | 1 | $29B |
|
||
| Healthcare / Medical Devices | 1 | $23B |
|
||
| Automotive Technology | 1 | $20B |
|
||
Price history
+59.2% since first listed7 events — show timeline
- 2026-04-19 Listed $69,900 MiRealSource-MiMLS
- 2021-05-28 Sold (MLS) $32,500 MiRealSource-MiMLS
- 2021-05-13 Pending — MiRealSource-MiMLS
- 2021-05-10 Relisted — MiRealSource-MiMLS
- 2021-05-09 Contingent — MiRealSource-MiMLS
- 2021-05-05 Price Changed $39,900 MiRealSource-MiMLS
- 2021-04-07 Listed $43,900 MiRealSource-MiMLS
Property tax history
+4.7%/yrLatest (2025): $1,761 · -30.6% YoY. Source: county tax records.
Cash-flow waterfall
monthlySold comps — $/sqft
last 12 mo · ≤1 miLoading sold comps…