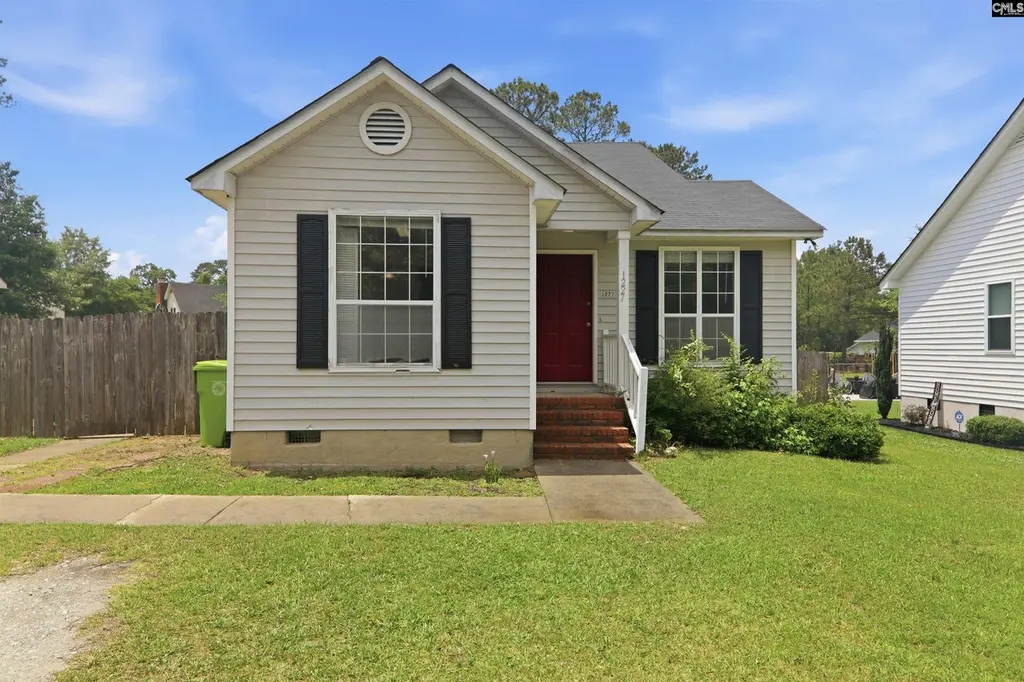
1227 Lykes Ln · Columbia, SC
Flood risk 1/10 · Minimal
- FEMA flood zone
- X (unshaded)
- Chance of flooding over 30 yrs
- 0.0%
- Est. flood insurance / yr
- $507 – $1,088
Fire risk 3/10 · Minor
- Est. fire insurance / yr
- $783 – $1,453
Heat risk 7/10 · Major
- Hot days now (above 108°F)
- 7 days/yr
- Hot days in 30 yrs
- 16 days/yr
Wind risk 6/10 · Moderate
- Chance of severe wind over 30 yrs
- 62.0%
Air-quality risk 3/10 · Minor
- Unhealthy air days now
- 3 days/yr
- Unhealthy air days in 30 yrs
- 3 days/yr
Risk factors via First Street. Map © Google.
Why this score? — see what drove the D grade
The composite is a weighted blend of 9 inputs, each scored 0–100. Each bar is that input's sub-score; the figure is the points it added to the 100-point composite (weight × sub-score).
- ARV discount +11.7/15.0
- Cash flow +10.8/30.0
- Schools +4.5/10.0
- 1% rule +4.3/10.0
- Livability +3.9/5.0
- DSCR +3.1/10.0
- Rent growth +2.7/5.0
- Condition / age +2.5/5.0
- Appreciation +0.0/10.0
$204,900
🖨 Deal sheet 📄 Offer letter ✓ Due diligence
Listing remarks
Well-maintained 3-bedroom, 2-bath home featuring an open floor plan for the main living areas and ceiling fans in all bedrooms. Hardwoods gleam throughout the main, while plush carpet makes for cozy space in the bedrooms. The primary suite includes a private bath and walk-in closet. The kitchen provides a built-in stove, dishwasher, and garbage disposal. The spacious backyard includes a large workshop. Disclaimer: CMLS has not reviewed and, therefore, does not endorse vendors who may appear in listings.
Key facts
- Open floor plan
- Private bath
- Walk-in closet
Tags
Property features AI
Exterior
- Utilities: Public water; Public sewer
- Home design: Single-story home
- Construction: Crawlspace foundation
- Exterior features: Vinyl exterior; Paved road access; 0.21-acre lot
Interior
- Kitchen: Dishwasher; Refrigerator; Free-standing self-cleaning range
- Bedrooms: Master bedroom on the main level
- Bathrooms: Two full bathrooms
- Heating & cooling: Central heating; Central air
- Interior features: Dishwasher; Refrigerator; Free-standing self-cleaning range; Central heating; Central air
Neighborhood map
What this means for you Summary
Snapshot
- This is a 3-bed/2.0-bath single-family listed at $205k.
Deal economics
- At list price, monthly cash flow is $-93 ($-1k/yr) — negative.
- To cash-flow at today's rent, offer at most $188k (8.0% below list).
- To meet the 1% rule (rent ≥ 1% of price), the offer needs to be $191k (6.8% below list).
- Recommended offer: $188k (8.0% below list) — sets the bar for cash-flow.
Location & tenants
- Location reads 78/100 on livability (#18 in SC, #2,436 nationally) — a middle-class / working-renter tenant base. Strengths: amenities A+, commute A+, cost of living A+; Watch: employment D, crime F.
- Lexington 05 (suburban): math 47% / reading 55% proficiency, ranked #5 of 80 in SC (top 6%) — acceptable for families but not a draw, mixed tenant base, ~2y average lease.
- Zoned schools: Dutch Fork Elementary (math 32% / reading 37%, grade F, #344 of 597 statewide, top 60%, 475 students, 82% FRL); Dutch Fork High (math 54% / reading 86%, grade B+, #58 of 196 statewide, top 30%, 1,726 students, 52% FRL) — zoned schools average 67% FRL vs 27% district-wide (40 pts higher); higher-poverty schools than district average — tighter screening recommended.
- Market conditions: Rents flat; 315 active listings in the ZIP; 9 comparable units currently listed for rent nearby; rentals leasing fast (median 3d on market — plan ~1-2 weeks tenant-placement turnaround); solid renter incomes; 3,472 units permitted in Richland County in 2024 (1,096 in 5+ unit buildings).
Forward outlook
- Local home prices are declining (-3.0%/yr); year-one equity from $1k of loan paydown is wiped out by about $6k of value loss. Plan a longer hold.
- Richland County population projected at +30% by 2050 — long-run rental-demand tailwind backs the buy-and-hold thesis.
Negotiation context
- It's been on market 20 days — a 2% lower offer ($202k) is reasonable based on typical stale-listing flexibility.
Risks & watch-outs
- Watch-outs: property tax is 2.6% of price.
- Climate carrying-cost: major wind risk, 62% chance of damaging wind over 30y; extreme-heat days projected 7→16/yr by 2055 (HVAC capex compounding) — expect insurance premiums to compound above CPI over the hold.
Questions for the listing agent
- What do current leases actually rent for vs. the listed asking? Can we see a recent rent roll and the last 12 months of T-12 income?
- Property tax is high relative to price — has the assessment been appealed recently, and will the sale trigger a re-assessment?
- Is there a deadline driving the sale (1031 exchange, divorce, estate, relocation)? That informs how much negotiation room exists.
- Schools are D-rated, which usually means shorter tenancies and higher turnover. Who's the typical renter profile here, and what's been the actual vacancy rate?
- Crime grade is F in this area — have there been break-ins, vandalism, or insurance claims at this property in the last 3 years? What carrier currently insures it and at what premium?
- The area grade is low — what's the realistic commute time and amenity access for the typical tenant pool here? Any planned neighborhood developments (good or bad) we should know about?
- What's the average days-on-market for RENTAL listings here right now (not sales)? A rising rental-DOM trend means longer vacancies and softer asking-rent achievability than the comps imply.
- What's the recent tenant-quality profile in this submarket — average credit score on applications, eviction rate, late-payment / NSF rate, and stable-employment percentage? A property-management company in the area should have these aggregated.
- How much new for-sale + rental construction is in the pipeline within 1–3 miles? Heavy new supply typically softens prices + rents 12–24 months out; constrained supply supports both.
Investment metrics
- 1% rule
- 0.93% ✗
- Cap rate
- 5.75%
- Cash-on-cash
- -1.94%
- DSCR
- 0.91
- GRM
- 8.9
CMA / ARV
- ARV (on-the-fly)
- $225,862
- Comps found
- 1
Show comp detail 1 sale within ~0.75 mi
| Address | Dist | Beds/Ba | Sqft | Sold | Price | $/sf | Match |
|---|---|---|---|---|---|---|---|
| 1003 Riverwalk Way | 0.39mi | 3/2.0 | 1,318 (+6%) | 15mo | $239,900 | $182 | 59 |
Match score weights: distance 35% · size 25% · config 20% · recency 20%. Top-matched comps best support the ARV.
Projected returns pro-forma
-3.0% appreciation · 0.78% rent growth · sell at horizon
- IRR
- -22.3%
- Equity multiple
- 0.25×
- Total profit
- $-43,152
- Equity at exit
- $30,551
- IRR
- -24.1%
- Equity multiple
- -0.06×
- Total profit
- $-60,994
- Equity at exit
- $17,716
Cash invested: $57,372 (down + closing). Projections, not guarantees.
Landlord ↔ Tenant lean methodology
- Overall (STATE)
- 90 Strongly Landlord-Friendly
- State South Carolina
- 90 Strongly Landlord-Friendly · R+6
- County
- — inherits STATE
- City
- — inherits STATE
ZIP-level market 29063
- Rents YoY
- 0.8%
- Active inventory
- 315
- Price-to-rent
- 8.9×
Monthly cashflow live
- Estimated rent
- $1,909 high interval (Pro) →
- Mortgage (P&I)
- −$1,075
- Tax from tax record
- −$441 /mo · $5,293/yr
- Insurance
- −$85
- HOA
- −$0
- Vacancy / Maint / Mgmt
- −$401
- Net cashflow
- $-93
Break-even live
UW: 25.0% down · 7.5% · 30yr · 1.5% tax · 5.0% vac · 8.0% maint · 8.0% mgmt
Financing live
Cash to close
- Down payment
- $51,225
- Closing costs
- $6,147
- Reserves months
- —
- Total cash needed
- —
Loan-product check · same deal, 3 products live
Conventional
25% down · 7.5% · 30yr
- Down + closing
- —
- Monthly P&I
- —
- Monthly cashflow
- —
- DSCR
- —
- Eligible?
- —
Personal DTI + credit; lowest rate.
DSCR
20% down · 8.5% · 30yr
- Down + closing
- —
- Monthly P&I
- —
- Monthly cashflow
- —
- DSCR
- —
- Eligible?
- —
No personal income docs; deal must DSCR.
Hard money
10% down · 12.0% · 12mo
- Down + closing
- —
- Monthly P&I
- —
- Monthly cashflow
- —
- DSCR
- —
- Eligible?
- —
Short-term bridge; refi at stabilization.
Rent comps 9 comps
| Address | Beds | Baths | Sqft | Rent | $/sqft | DOM | Units | Dist |
|---|---|---|---|---|---|---|---|---|
| 316 Stamport Cir Irmo, SC | 3.0 | 2.5 | 1500 | $1,575 | $1.05 | 3d | 1 | 0.54mi |
| 101 Riverwalk Way Irmo, SC | 3.0 | 2.0 | 1300 | $1,750 | $1.35 | 14d | 1 | 0.55mi |
| 356 Lake Murray Blvd Irmo, SC | 1.0–3.0 | 1.0–2.0 | 1020 | $2,537 | $2.49 | 3d | 23 | 0.83mi |
| 100 Walden Heights Dr Irmo, SC | 1.0–3.0 | 1.0–2.0 | 1030 | $1,880 | $1.83 | 3d | 23 | 0.99mi |
| 6 Forestgrove Ct Columbia, SC | 3.0 | 2.0 | 1066 | $1,599 | $1.50 | 21d | 1 | 1.08mi |
| 401 Columbiana Dr Columbia, SC | 2.0–4.0 | 1.5–2.0 | 1207 | $1,216 | $1.01 | 3d | 1 | 1.33mi |
| 113 Paces Brook Ave Columbia, SC | 1.0–3.0 | 1.0–2.0 | 929 | $1,770 | $1.91 | 11d | 12 | 1.36mi |
| 500 Harbison Blvd Columbia, SC | 2.0–3.0 | 2.0–3.0 | 1152 | $1,849 | $1.61 | 2d | 11 | 1.42mi |
| 13 Crossbow Pl Columbia, SC | 2.0 | 2.5 | 1250 | $1,650 | $1.32 | 14d | 1 | 1.43mi |
Listing history 15 events
-
2026-06-19price $204,900 Active 20 DOM
-
2026-06-18days on market $209,900 Active 20 DOM
-
2026-06-17days on market $209,900 Active 19 DOM
-
2026-06-16days on market $209,900 Active 18 DOM
-
2026-06-15days on market $209,900 Active 17 DOM
-
2026-06-14days on market $209,900 Active 15 DOM
-
2026-06-13days on market $209,900 Active 14 DOM
-
2026-06-10days on market $209,900 Active 12 DOM
-
2026-06-09days on market $209,900 Active 11 DOM
-
2026-06-08days on market $209,900 Active 10 DOM
-
2026-06-07days on market $209,900 Active 9 DOM
-
2026-06-03days on market $209,900 Active 5 DOM
-
2026-06-03days on market $209,900 Active 4 DOM
-
2026-06-01days on market $209,900 Active 3 DOM
-
2026-05-31days on market $209,900 Active 2 DOM
ⓘ Source: listings_history table (triggers on properties + properties_extension) + one-shot
backfill from property_details.listing_events for pre-trigger history.
Tax reassessment forecast SC · Resets to sale price
- Current annual tax
- $5,293 · $441/mo
- Projected year-2 tax
- $5,293 · $441/mo
- Expected delta
- $0/yr ($0/mo · 0.0%)
ⓘ Screening estimate from a state-policy table — verify with the county assessor before closing.
Climate risk First Street
- Flood 1/10 Low FEMA zone X (unshaded) · 0% chance over 30 yrs
- Wildfire 3/10 Moderate
- Heat 7/10 Severe 7 d/yr ≥108°F today · 16 d/yr by 30 yrs out
- Wind 6/10 Major 62% chance of damaging wind over 30 yrs
- Air quality 3/10 Moderate 3 unhealthy d/yr today · 3 by 30 yrs out
Nearby sold comps map
Loading sold comps map…
Walkable amenities ~0.75 mi
Loading nearby amenities…
Taxation est. · year 1
- Rental income
- $22,907
- − Mortgage interest
- −$11,478
- − Property taxes
- −$5,293
- − Insurance
- −$1,024
- − Repairs & maintenance
- −$1,833
- − Management
- −$1,833
- − Depreciation
- −$5,961
- Taxable loss
- −$4,514
- Est. tax savings @ 24.0%
- +$1,083
- After-tax cash flow
- $-32/yr
For passive investors: Depreciation is non-cash, so a rental often shows a tax loss while cash-flowing — sheltering income. Rental losses are passive: they offset passive income freely, and up to $25,000/yr can offset ordinary (W-2) income if you actively participate and your MAGI is under $100k (phasing out to $0 by $150k); unused losses carry forward. On sale, claimed depreciation is recaptured at up to 25%, and gains may owe capital-gains tax (a 1031 exchange can defer both). Figures are a year-1 estimate at your 24.0% rate — not tax advice; consult a CPA.
Schools (NCES district)
- District
- Lexington 05
- NCES district ID
- 4502820
- Math proficiency
- 47% ▼ -7.00%
- Reading proficiency
- 55% ▼ -4.00%
- Median HH income
- $67,732
- Composite
- 45.28/100
- National rank
- #2656
- State rank
- #5 of 80 in SC
Livability — Columbia
- Score
- 78/100
- State rank
- #18
- US rank
- #2436
Category grades
Schools grade is shown separately in the Schools card above.
Census & demographics
- County
- Richland County · 389,530 people
- City population
- 335,994
- Metro
- Columbia, SC
- Population (ZIP)
- 38,201
- Household income
- $91,973
- Rent vs Own
- Severe rent burden
- 962.0
Population outlook (Richland County) Hauer SSP2
- Today (2025)
- 459,667 people
- By 2030
- 487,524 · +6.1%
- By 2040
- 542,035 · +17.9%
- By 2050
- 595,371 · +29.5%
- By 2075
- 732,998 · +59.5%
- By 2100
- 820,415 · +78.5%
Race, ethnicity, and origin ACS 2023
- Neighborhood character
- Majority White (65%)
- Race & ethnicity
- White 65% Black 26% Two or more races 5% Hispanic / Latino 3% Asian 2%
- Common ancestry
- Romanian 4% Slovak 4% Serbian 3%
- Foreign-born
- 4% · Canada
- Languages at home
- 95% English-only · Spanish 2% Russian/Polish/Slavic 1% Other Indo-European 1%
Political lean MEDSL · Richland
- 2024 margin
- Solid D (+34.6) · D 66.4% · R 31.8% · Other 1.8%
- 2008→2024 swing
- +5.7pp toward D · 2008: 28.9pp · 2024: 34.6pp
- All cycles
- 2024: D+34.6 2020: D+38.3 2016: D+32.9 2012: D+33.3 2008: D+28.9
Not yet ingested
- Civics
- —
Market trends
- HPI YoY
- ▼ -130.57%
- Current HPI
- 204.0147
- Rent YoY
- ▲ 0.78%
- Metro
- Columbia, SC
- State GDP YoY
- ▲ 4.51%
- F500 in state
- 2
Industry mix (Fortune 500 HQ in SC)
| Industry | F500 HQs | Revenue |
|---|---|---|
| Packaging | 1 | $7B |
|
||
Price history
+1514.6% since first listed9 events — show timeline
- 2026-05-29 Listed $209,900 Consolidated MLS
- 2022-08-29 Sold (Public Records) $12,990,681 Public Records
- 2019-12-18 Sold (Public Records) $435,183 Public Records
- 2018-06-11 Sold (Public Records) $106,000 Public Records
- 2013-05-16 Sold (Public Records) $50,000 Public Records
- 2005-01-27 Sold (Public Records) $95,000 Public Records
- 1999-12-30 Sold (Public Records) $83,900 Public Records
- 1991-12-03 Sold (Public Records) $61,900 Public Records
- 1991-12-02 Sold (Public Records) $13,000 Public Records
Property tax history
+16.1%/yrLatest (2025): $5,293 · +0.7% YoY. Source: county tax records.
Cash-flow waterfall
monthlySold comps — $/sqft
last 12 mo · ≤1 miLoading sold comps…