 🏗️ New Construction
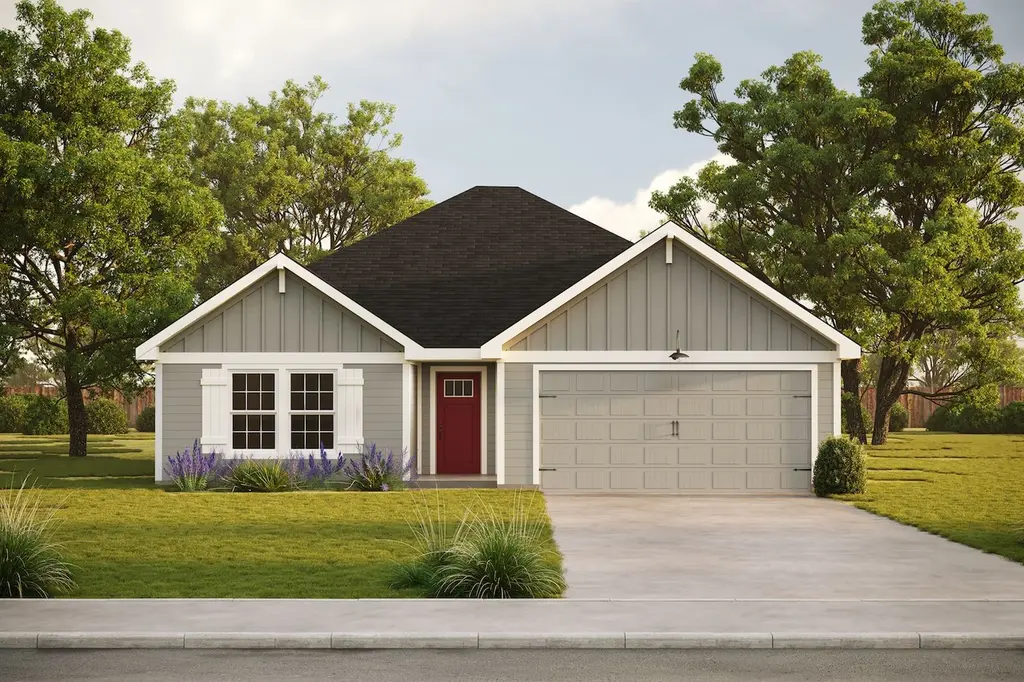
The Cardinal Plan · Tioga, TX
Flood risk 3/10 · Minor
- FEMA flood zone
- X (unshaded)
- Chance of flooding over 30 yrs
- 0.1%
- Est. flood insurance / yr
- $507 – $1,088
Fire risk 6/10 · Moderate
- Est. fire insurance / yr
- $1,222 – $2,270
Heat risk 7/10 · Major
- Hot days now (above 109°F)
- 7 days/yr
- Hot days in 30 yrs
- 21 days/yr
Wind risk 6/10 · Moderate
- Chance of severe wind over 30 yrs
- 27.0%
Air-quality risk 3/10 · Minor
- Unhealthy air days now
- 3 days/yr
- Unhealthy air days in 30 yrs
- 4 days/yr
Risk factors via First Street. Map © Google.
Why this score? — see what drove the D- grade
The composite is a weighted blend of 9 inputs, each scored 0–100. Each bar is that input's sub-score; the figure is the points it added to the 100-point composite (weight × sub-score).
- Appreciation +8.7/10.0
- ARV discount +7.5/15.0
- Cash flow +7.2/30.0
- Schools +4.0/10.0
- Livability +3.3/5.0
- Rent growth +2.5/5.0
- Condition / age +2.5/5.0
- 1% rule +2.0/10.0
- DSCR +1.4/10.0
$362,000
🖨 Deal sheet (PDF) 📄 Offer letter ✓ Due diligence
Listing remarks MLS
The Cardinal is a one-story design with three-beds and two-baths. Boasting a beautiful, open, and spacious floor plan with access to a great covered patio. Situated separately from the other bedrooms, the master bedroom suite is secluded, providing the perfect relaxing retreat. This home offers a host of options to bring to life the home you have always wanted. - Three different elevations - 2-1/2 Car Garage / 3 Car Garage / Opt. Ext 3rd Car Garage - Optional Master Bathroom (Shower and Tub) - Optional Fireplace - Optional Extended Covered Back Patio * Images are representative, and we reserve the right, without notification, to adjust prices, specifications, and elevations. Building materials may be changed, based on the latest research and proven serviceability
Key facts
- 2 parking spots
- Listed 956 days
Neighborhood map
What this means for you Summary
Snapshot
- This is a 3-bed/2.0-bath single-family listed at $362k.
Deal economics
- At list price, monthly cash flow is $-523 ($-6k/yr) — negative.
- To cash-flow at today's rent, offer at most $309k (14.7% below list).
- To meet the 1% rule (rent ≥ 1% of price), the offer needs to be $270k (25.4% below list).
- Recommended offer: $270k (25.4% below list) — sets the bar for 1% rule.
Location & tenants
- Location reads 66/100 on livability (#656 in TX) — a middle-class / working-renter tenant base. Strengths: crime A+, cost of living A+, housing A+; Watch: amenities F, commute F, health & safety F.
- Tioga ISD (rural): math 44% / reading 50% proficiency, ranked #226 of 826 in TX (top 27%) — families likely to look elsewhere, expect single-tenant / working-renter base with shorter leases.
- Market conditions: 84 active listings in the ZIP; 1 comparable units currently listed for rent nearby; 2,272 units permitted in Grayson County in 2024 (750 in 5+ unit buildings).
Forward outlook
- In year one you build about $31k of equity ($3k loan paydown + $29k appreciation (7.5% local appreciation)).
- Grayson County population projected at +12% by 2050 — modest demand growth; plan on rents tracking national, not racing it.
- By year 2, paydown + projected appreciation supports a ~$50k cash-out refi (75% LTV) — recoverable capital for the next deal without selling this one.
Negotiation context
- It's been on market 956 days — a 12% lower offer ($319k) is reasonable based on typical stale-listing flexibility.
Risks & watch-outs
- Climate carrying-cost: major wind risk, 27% chance of damaging wind over 30y; major wildfire risk; extreme-heat days projected 7→21/yr by 2055 (HVAC capex compounding) — expect insurance premiums to compound above CPI over the hold.
Questions for the listing agent
- What do current leases actually rent for vs. the listed asking? Can we see a recent rent roll and the last 12 months of T-12 income?
- It's been on market 956 days. Have you received any prior offers? Is the seller open to a 25% concession, seller financing, or rate buy-down credit?
- Why hasn't it sold? Are there any deal-killer items the seller is aware of (foundation, flood, title, zoning, code violations)?
- Is there a deadline driving the sale (1031 exchange, divorce, estate, relocation)? That informs how much negotiation room exists.
- The area grade is low — what's the realistic commute time and amenity access for the typical tenant pool here? Any planned neighborhood developments (good or bad) we should know about?
- What's the average days-on-market for RENTAL listings here right now (not sales)? A rising rental-DOM trend means longer vacancies and softer asking-rent achievability than the comps imply.
- What's the recent tenant-quality profile in this submarket — average credit score on applications, eviction rate, late-payment / NSF rate, and stable-employment percentage? A property-management company in the area should have these aggregated.
- How much new for-sale + rental construction is in the pipeline within 1–3 miles? Heavy new supply typically softens prices + rents 12–24 months out; constrained supply supports both.
Investment metrics
- 1% rule
- 0.70% ✗
- Cap rate
- 4.66%
- Cash-on-cash
- -5.84%
- DSCR
- 0.74
- GRM
- 11.9
CMA / ARV
- ARV (median comp)
- $384,392
- List price
- $362,000
- Delta
- -5.83%
- Verdict
- FAIR
- Comps
- 20 within 1.0 mi
Show comp detail 12 sales within ~0.75 mi
| Address | Dist | Beds/Ba | Sqft | Sold | Price | $/sf | Match |
|---|---|---|---|---|---|---|---|
| 615 N Lamar St | 0.08mi | 3/2.0 | 1,740 (+8%) | 3mo | $400,000 | $230 | 81 |
| 713 Arapaho Dr | 0.30mi | 3/2.0 | 1,667 (+4%) | 2mo | $275,000 | $165 | 79 |
| 404 N Florence St | 0.33mi | 3/2.0 | 1,535 (-5%) | 0mo | $342,500 | $223 | 76 |
| 603 Mohawk Dr | 0.29mi | 3/2.0 | 1,674 (+4%) | 7mo | $445,000 | $266 | 74 |
| 504 N Texas St | 0.41mi | 2/1.0 (-1) | 1,661 (+3%) | 1mo | $525,000 | $316 | 65 |
| 714 Mohawk Dr | 0.38mi | 3/2.0 | 1,712 (+6%) | 8mo | $439,900 | $257 | 65 |
| 1008 N Main St | 0.62mi | 3/2.0 | 1,605 (-0%) | 8mo | $349,900 | $218 | 64 |
| 1207 Mary Ann Ct | 0.40mi | 3/2.0 | 1,762 (+10%) | 2mo | $349,000 | $198 | 64 |
| 402 E Main St | 0.56mi | 3/2.5 | 1,529 (-5%) | 1mo | $299,999 | $196 | 63 |
| 304 Bradley St | 0.42mi | 3/2.0 | 1,790 (+11%) | 2mo | $390,000 | $218 | 61 |
| 401 Cutler St | 0.41mi | 3/1.0 | 1,476 (-8%) | 9mo | $229,000 | $155 | 56 |
| 718 Arapaho Dr | 0.40mi | 2/2.0 (-1) | 1,395 (-13%) | 2mo | $375,000 | $269 | 53 |
Match score weights: distance 35% · size 25% · config 20% · recency 20%. Top-matched comps best support the ARV.
Projected returns pro-forma
7.47% appreciation · 3.0% rent growth · sell at horizon
- IRR
- 14.3%
- Equity multiple
- 2.04×
- Total profit
- $112,101
- Equity at exit
- $278,257
- IRR
- 14.3%
- Equity multiple
- 4.25×
- Total profit
- $350,073
- Equity at exit
- $539,693
Cash invested: $107,630 (down + closing). Projections, not guarantees.
Landlord ↔ Tenant lean methodology
- Overall (STATE)
- 87 Strongly Landlord-Friendly
- State Texas
- 87 Strongly Landlord-Friendly · R+5
- County
- — inherits STATE
- City
- — inherits STATE
ZIP-level market 76271
- Home prices YoY
- 2.6%
- Active inventory
- 84
- Price-to-rent
- 11.2×
Monthly cashflow live
- Estimated rent
- $2,700 medium interval (Pro) →
- Mortgage (P&I)
- −$2,016
- Tax est. 1.5%
- −$480 /mo · $5,766/yr
- Insurance
- −$160
- HOA
- −$0
- Vacancy / Maint / Mgmt
- −$567
- Net cashflow
- $-523
Break-even live
Sensitivity live
| Price | -10% $-258 | -5% $-391 | +0% $-523 | +5% $-656 | +10% $-789 |
|---|---|---|---|---|---|
| Rent | -10% $-737 | -5% $-630 | +0% $-523 | +5% $-417 | +10% $-310 |
| Rate | -1.0pp $-330 | -0.5pp $-426 | base $-523 | +0.5pp $-623 | +1.0pp $-724 |
UW: 25.0% down · 7.5% · 30yr · 1.5% tax · 5.0% vac · 8.0% maint · 8.0% mgmt
Financing live
Cash to close
- Down payment
- $96,098
- Closing costs
- $11,532
- Reserves months
- —
- Total cash needed
- —
Loan-product check · same deal, 3 products live
Conventional
25% down · 7.5% · 30yr
- Down + closing
- —
- Monthly P&I
- —
- Monthly cashflow
- —
- DSCR
- —
- Eligible?
- —
Personal DTI + credit; lowest rate.
DSCR
20% down · 8.5% · 30yr
- Down + closing
- —
- Monthly P&I
- —
- Monthly cashflow
- —
- DSCR
- —
- Eligible?
- —
No personal income docs; deal must DSCR.
Hard money
10% down · 12.0% · 12mo
- Down + closing
- —
- Monthly P&I
- —
- Monthly cashflow
- —
- DSCR
- —
- Eligible?
- —
Short-term bridge; refi at stabilization.
Rent comps 1 comps
| Address | Beds | Baths | Sqft | Rent | $/sqft | DOM | Units | Dist |
|---|---|---|---|---|---|---|---|---|
| 618 Kyle Dr Tioga, TX | 4.0 | 2.0 | 1741 | $2,700 | $1.55 | 45d | 1 | 0.05mi |
Listing history 18 events
-
2026-06-21days on market $362,000 Active 956 DOM
-
2026-06-21days on market $362,000 Active 955 DOM
-
2026-06-18days on market $362,000 Active 953 DOM
-
2026-06-17days on market $362,000 Active 952 DOM
-
2026-06-16days on market $362,000 Active 951 DOM
-
2026-06-15days on market $362,000 Active 950 DOM
-
2026-06-15days on market $362,000 Active 949 DOM
-
2026-06-13days on market $362,000 Active 948 DOM
-
2026-06-12days on market $362,000 Active 947 DOM
-
2026-06-09days on market $362,000 Active 944 DOM
-
2026-06-08days on market $362,000 Active 943 DOM
-
2026-06-08days on market $362,000 Active 942 DOM
-
2026-06-05days on market $362,000 Active 940 DOM
-
2026-06-03days on market $362,000 Active 938 DOM
-
2026-06-02days on market $362,000 Active 937 DOM
-
2026-06-01days on market $362,000 Active 936 DOM
-
2026-05-31days on market $362,000 Active 935 DOM
-
2023-11-08$362,000 Active 775-char remark
Show marketing remark (775 chars)
The Cardinal is a one-story design with three-beds and two-baths. Boasting a beautiful, open, and spacious floor plan with access to a great covered patio. Situated separately from the other bedrooms, the master bedroom suite is secluded, providing the perfect relaxing retreat. This home offers a host of options to bring to life the home you have always wanted. - Three different elevations - 2-1/2 Car Garage / 3 Car Garage / Opt. Ext 3rd Car Garage - Optional Master Bathroom (Shower and Tub) - Optional Fireplace - Optional Extended Covered Back Patio * Images are representative, and we reserve the right, without notification, to adjust prices, specifications, and elevations. Building materials may be changed, based on the latest research and proven serviceability
ⓘ Source: listings_history table (triggers on properties + properties_extension) + one-shot
backfill from property_details.listing_events for pre-trigger history.
Climate risk First Street
- Flood 3/10 Moderate FEMA zone X (unshaded) · 10% chance over 30 yrs
- Wildfire 6/10 Major
- Heat 7/10 Severe 7 d/yr ≥109°F today · 21 d/yr by 30 yrs out
- Wind 6/10 Major 27% chance of damaging wind over 30 yrs
- Air quality 3/10 Moderate 3 unhealthy d/yr today · 4 by 30 yrs out
Nearby sold comps map
Loading sold comps map…
Walkable amenities ~0.75 mi
Loading nearby amenities…
Taxation est. · year 1
- Rental income
- $32,400
- − Mortgage interest
- −$21,532
- − Property taxes
- −$5,766
- − Insurance
- −$1,922
- − Repairs & maintenance
- −$2,592
- − Management
- −$2,592
- − Depreciation
- −$11,182
- Taxable loss
- −$13,186
- Est. tax savings @ 24.0%
- +$3,165
- After-tax cash flow
- $-3,117/yr
For passive investors: Depreciation is non-cash, so a rental often shows a tax loss while cash-flowing — sheltering income. Rental losses are passive: they offset passive income freely, and up to $25,000/yr can offset ordinary (W-2) income if you actively participate and your MAGI is under $100k (phasing out to $0 by $150k); unused losses carry forward. On sale, claimed depreciation is recaptured at up to 25%, and gains may owe capital-gains tax (a 1031 exchange can defer both). Figures are a year-1 estimate at your 24.0% rate — not tax advice; consult a CPA.
Schools (NCES district)
- District
- Tioga ISD
- NCES district ID
- 4842870
- Math proficiency
- 44% ▼ -12.00%
- Reading proficiency
- 50% ▼ -5.00%
- Median HH income
- $51,096
- Composite
- 40.38/100
- National rank
- #3735
- State rank
- #226 of 826 in TX
Livability — Tioga
- Score
- 66/100
- State rank
- #656
- US rank
- #12339
Category grades
Schools grade is shown separately in the Schools card above.
Census & demographics
- Census place
- Tioga, TX
- City population
- 1,864
- Population (ZIP)
- 1,864
Population outlook (Grayson County) Hauer SSP2
- Today (2025)
- 134,540 people
- By 2030
- 138,653 · +3.1%
- By 2040
- 145,958 · +8.5%
- By 2050
- 151,218 · +12.4%
- By 2075
- 161,802 · +20.3%
- By 2100
- 159,036 · +18.2%
Race, ethnicity, and origin ACS 2023
- Neighborhood character
- Predominantly White (91%)
- Race & ethnicity
- White 91% Hispanic / Latino 7% Two or more races 4% Native American 1%
- Hispanic origin (detail)
- Mexican 5%
- Common ancestry
- Slovak 2% Serbian 1% Romanian 1%
- Foreign-born
- 4% · Canada
- Languages at home
- 96% English-only · Spanish 4%
Political lean MEDSL · Grayson
- 2024 margin
- Solid R (+54.3) · D 22.5% · R 76.7%
- 2008→2024 swing
- -16.4pp toward R · 2008: -37.9pp · 2024: -54.3pp
- All cycles
- 2024: R+54.3 2020: R+49.9 2016: R+53.1 2012: R+48.0 2008: R+37.9
Not yet ingested
- Civics
- —
Market trends
- HPI YoY
- ▲ 7.47%
- Current HPI
- 297.1567
- Rent YoY
- —
- Metro
- —
- State GDP YoY
- ▲ 3.95%
- F500 in state
- 110
Industry mix (Fortune 500 HQ in TX)
| Industry | F500 HQs | Revenue |
|---|---|---|
| Energy | 16 | $1,198B |
|
||
| Technology | 5 | $198B |
|
||
| Engineering / Construction | 4 | $72B |
|
||
| Energy Services | 3 | $60B |
|
||
| Utilities | 3 | $41B |
|
||
| Healthcare | 2 | $330B |
|
||
Price history
1 event — show timeline
- 2023-11-08 Listed $362,000 Zillow
Cash-flow waterfall
monthlySold comps — $/sqft
last 12 mo · ≤1 miLoading sold comps…