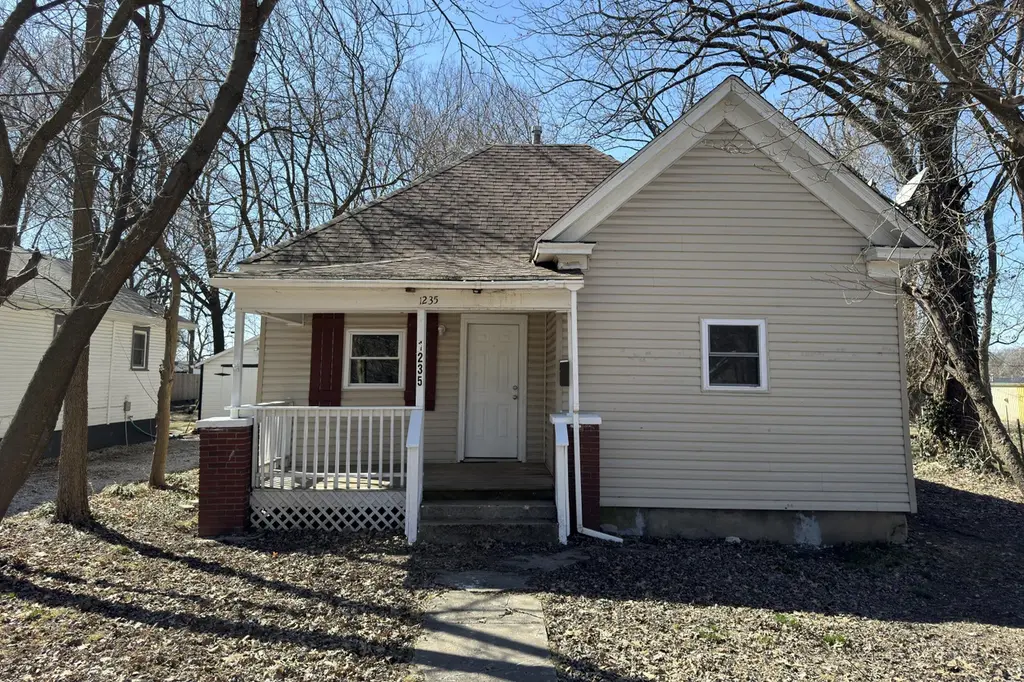
1235 N Prospect Ave · Springfield, MO
Flood risk 1/10 · Minimal
- FEMA flood zone
- X (unshaded)
- Chance of flooding over 30 yrs
- 0.0%
- Est. flood insurance / yr
- $507 – $1,088
Fire risk 1/10 · Minimal
- Est. fire insurance / yr
- $1,054 – $1,958
Heat risk 5/10 · Moderate
- Hot days now (above 104°F)
- 7 days/yr
- Hot days in 30 yrs
- 18 days/yr
Wind risk 2/10 · Minimal
- Chance of severe wind over 30 yrs
- —
Air-quality risk 2/10 · Minimal
- Unhealthy air days now
- 1 days/yr
- Unhealthy air days in 30 yrs
- 2 days/yr
Risk factors via First Street. Map © Google.
Why this score? — see what drove the D+ grade
The composite is a weighted blend of 9 inputs, each scored 0–100. Each bar is that input's sub-score; the figure is the points it added to the 100-point composite (weight × sub-score).
- Cash flow +15.4/30.0
- ARV discount +10.4/15.0
- DSCR +4.7/10.0
- Livability +3.8/5.0
- Rent growth +3.7/5.0
- Schools +3.2/10.0
- 1% rule +3.1/10.0
- Condition / age +2.5/5.0
- Appreciation +0.0/10.0
$130,000
🖨 Deal sheet 📄 Offer letter ✓ Due diligence
Listing remarks MLS
Tenants lease is good for 9/30/26. Welcome to 1235 N Prospect Avenue, a well-located property situated near Ozarks Technical Community College (OTC) and offering convenient access to shopping, dining, and major roadways. This home features a functional floor plan with inviting living spaces, and neutral finishes throughout. The kitchen provides practical workspace and storage, while the bedrooms offer comfortable sizing for everyday living. Outside, enjoy a manageable yard with room to relax, garden, or entertain. Whether you're a homeowner or investor, this property presents a great opportunity in an established Springfield neighborhood. Schedule your showing today.
Key facts
- Practical workspace
- Manageable yard
- 9,583 sq ft lot
Tags
Neighborhood map
What this means for you Summary
Snapshot
- This is a 2-bed/1.0-bath single-family listed at $130k.
Deal economics
- At list price, monthly cash flow is $50 ($598/yr) — positive.
- The deal already cash-flows at list — no discount required.
- To meet the 1% rule (rent ≥ 1% of price), the offer needs to be $105k (19.2% below list).
- Recommended offer: $105k (19.2% below list) — sets the bar for 1% rule.
- Cap rate 6.8% vs local median 4.6% in Springfield — top-decile yield for the area; either an underpriced asset or a hidden risk that comps aren't pricing in. Stress-test before assuming the spread holds.
Location & tenants
- Location reads 75/100 on livability (#57 in MO, #4,121 nationally) — a middle-class / working-renter tenant base. Strengths: commute A+, cost of living A+, housing A+; Watch: crime F, employment F.
- Springfield R-XII (urban): math 32% / reading 46% proficiency, ranked #174 of 324 in MO (top 54%) — families likely to look elsewhere, expect single-tenant / working-renter base with shorter leases.
- Market conditions: Rents rising fast (+4.8%/yr); 512 active listings in the ZIP; 40 comparable units currently listed for rent nearby; rentals at typical pace (median 23d on market — plan ~3-4 weeks tenant-placement turnaround); 45% of comp listings sitting > 30 days — soft ceiling on asking rent; 1,302 units permitted in Greene County in 2024 (250 in 5+ unit buildings).
Forward outlook
- Local home prices are declining (-3.0%/yr); year-one equity from $899 of loan paydown is wiped out by about $4k of value loss. Plan a longer hold.
- Greene County population projected at +25% by 2050 — long-run rental-demand tailwind backs the buy-and-hold thesis.
Negotiation context
- It's been on market 177 days — a 12% lower offer ($114k) is reasonable based on typical stale-listing flexibility.
- 2 sale attempts since 10y ago with the ask held roughly flat each time — persistent listings suggest the price (not the market) is what's stuck; bring a comps-based counter.
Risks & watch-outs
- Watch-outs: built in 1904 — expect roof / HVAC / electrical / plumbing capex.
- Climate carrying-cost: extreme-heat days projected 7→18/yr by 2055 (HVAC capex compounding) — expect insurance premiums to compound above CPI over the hold.
Questions for the listing agent
- It's been on market 177 days. Have you received any prior offers? Is the seller open to a 19% concession, seller financing, or rate buy-down credit?
- Built in 1904 — when were the roof, HVAC, electrical panel, plumbing, and water heater last replaced?
- Why hasn't it sold? Are there any deal-killer items the seller is aware of (foundation, flood, title, zoning, code violations)?
- Is there a deadline driving the sale (1031 exchange, divorce, estate, relocation)? That informs how much negotiation room exists.
- Crime grade is F in this area — have there been break-ins, vandalism, or insurance claims at this property in the last 3 years? What carrier currently insures it and at what premium?
- The area grade is low — what's the realistic commute time and amenity access for the typical tenant pool here? Any planned neighborhood developments (good or bad) we should know about?
- What's the average days-on-market for RENTAL listings here right now (not sales)? A rising rental-DOM trend means longer vacancies and softer asking-rent achievability than the comps imply.
- What's the recent tenant-quality profile in this submarket — average credit score on applications, eviction rate, late-payment / NSF rate, and stable-employment percentage? A property-management company in the area should have these aggregated.
- How much new for-sale + rental construction is in the pipeline within 1–3 miles? Heavy new supply typically softens prices + rents 12–24 months out; constrained supply supports both.
Investment metrics
- 1% rule
- 0.81% ✗
- Cap rate
- 6.75%
- Cash-on-cash
- 1.64%
- DSCR
- 1.07
- GRM
- 10.3
CMA / ARV
- ARV (median comp)
- $138,815
- List price
- $130,000
- Delta
- -6.35%
- Verdict
- FAIR
- Comps
- 20 within 1.0 mi
Show comp detail 12 sales within ~0.75 mi
| Address | Dist | Beds/Ba | Sqft | Sold | Price | $/sf | Match |
|---|---|---|---|---|---|---|---|
| 1133 N Prospect Ave | 0.08mi | 2/1.0 | 972 (-12%) | 4mo | $140,000 | $144 | 73 |
| 1725 N Weller Ave | 0.57mi | 2/1.5 | 1,088 (-2%) | 0mo | $130,000 | $119 | 68 |
| 1455 E Commercial St | 0.67mi | 2/1.0 | 1,087 (-2%) | 4mo | $142,000 | $131 | 62 |
| 1341 N Fremont Ave | 0.21mi | 3/2.0 (+1) | 984 (-11%) | 1mo | $121,800 | $124 | 62 |
| 1613 N Weller Ave | 0.48mi | 3/1.0 (+1) | 1,160 (+5%) | 3mo | $149,000 | $128 | 62 |
| 922 N Prospect Ave | 0.27mi | 3/1.0 (+1) | 1,245 (+13%) | 2mo | $125,000 | $100 | 60 |
| 1077 E Blaine St | 0.56mi | 2/2.0 | 1,060 (-4%) | 4mo | $149,000 | $141 | 60 |
| 1440 E Locust St | 0.44mi | 3/1.0 (+1) | 1,200 (+8%) | 3mo | $160,000 | $133 | 58 |
| 1433 E Commercial St | 0.65mi | 2/1.0 | 1,008 (-9%) | 1mo | $124,900 | $124 | 54 |
| 1628 E Brower St | 0.67mi | 3/1.5 (+1) | 1,164 (+5%) | 1mo | $154,000 | $132 | 52 |
| 1604 E Commercial St | 0.73mi | 3/1.0 (+1) | 1,050 (-5%) | 4mo | $157,900 | $150 | 50 |
| 1121 E Thoman St | 0.73mi | 3/2.0 (+1) | 1,220 (+10%) | 2mo | $174,900 | $143 | 38 |
Match score weights: distance 35% · size 25% · config 20% · recency 20%. Top-matched comps best support the ARV.
Projected returns pro-forma
-3.0% appreciation · 4.82% rent growth · sell at horizon
- IRR
- -12.0%
- Equity multiple
- 0.56×
- Total profit
- $-15,991
- Equity at exit
- $19,383
- IRR
- -0.6%
- Equity multiple
- 0.95×
- Total profit
- $-1,733
- Equity at exit
- $11,240
Cash invested: $36,400 (down + closing). Projections, not guarantees.
Landlord ↔ Tenant lean methodology
- Overall (STATE)
- 81 Strongly Landlord-Friendly
- State Missouri
- 81 Strongly Landlord-Friendly · R+10
- County
- — inherits STATE
- City
- — inherits STATE
ZIP-level market 65802
- Home prices YoY
- -31.9%
- Rents YoY
- 4.8%
- Active inventory
- 512
- Price-to-rent
- 10.3×
Monthly cashflow live
- Estimated rent
- $1,050 high interval (Pro) →
- Mortgage (P&I)
- −$682
- Tax from tax record
- −$44 /mo · $526/yr
- Insurance
- −$54
- HOA
- −$0
- Vacancy / Maint / Mgmt
- −$221
- Net cashflow
- $50
Break-even live
UW: 25.0% down · 7.5% · 30yr · 1.5% tax · 5.0% vac · 8.0% maint · 8.0% mgmt
Financing live
Cash to close
- Down payment
- $32,500
- Closing costs
- $3,900
- Reserves months
- —
- Total cash needed
- —
Loan-product check · same deal, 3 products live
Conventional
25% down · 7.5% · 30yr
- Down + closing
- —
- Monthly P&I
- —
- Monthly cashflow
- —
- DSCR
- —
- Eligible?
- —
Personal DTI + credit; lowest rate.
DSCR
20% down · 8.5% · 30yr
- Down + closing
- —
- Monthly P&I
- —
- Monthly cashflow
- —
- DSCR
- —
- Eligible?
- —
No personal income docs; deal must DSCR.
Hard money
10% down · 12.0% · 12mo
- Down + closing
- —
- Monthly P&I
- —
- Monthly cashflow
- —
- DSCR
- —
- Eligible?
- —
Short-term bridge; refi at stabilization.
Rent comps 40 comps
| Address | Beds | Baths | Sqft | Rent | $/sqft | DOM | Units | Dist |
|---|---|---|---|---|---|---|---|---|
| 1306 N Frisco Ave Apt A Springfield, MO | 2.0 | 1.5–2.0 | 970 | $995 | $1.03 | 13d | 19 | 0.24mi |
| 1339 E Division St Springfield, MO | 3.0 | 2.0 | 1186 | $1,350 | $1.14 | 23d | 1 | 0.29mi |
| 1112 E Locust St Springfield, MO | 2.0 | 1.0 | 840 | $945 | $1.12 | 23d | 1 | 0.38mi |
| 1529 N Weller Ave Springfield, MO | 2.0 | 1.0 | 870 | $995 | $1.14 | 23d | 1 | 0.44mi |
| 1636 N National Ave Springfield, MO | 3.0 | 1.5 | 1000 | $995 | $0.99 | 43d | 1 | 0.45mi |
| 716 E Locust St Unit A Springfield, MO | 2.0 | 1.0 | 915 | $850 | $0.93 | 23d | 1 | 0.61mi |
| 1501 E Blaine St Springfield, MO | 2.0 | 1.0 | 958 | $695 | $0.73 | 23d | 1 | 0.62mi |
| 1409 N Washington Ave Springfield, MO | 2.0 | 1.0 | 839 | $1,405 | $1.67 | 13d | 2 | 0.68mi |
| 1710 E Commercial St Unit B Springfield, MO | 2.0 | 1.0 | 950 | $775 | $0.82 | 43d | 1 | 0.83mi |
| 2054 N Rogers Ave Springfield, MO | 2.0 | 1.0 | 888 | $925 | $1.04 | 13d | 1 | 0.90mi |
| 805 E Garfield St Springfield, MO | 2.0 | 1.0 | 950 | $950 | $1.00 | 13d | 1 | 0.95mi |
| 1623 N Jefferson Ave Unit B Springfield, MO | 1.0 | 1.0 | 750 | $950 | $1.27 | 43d | 1 | 0.95mi |
| 1530 N Robberson Ave Springfield, MO | 3.0 | 2.0 | 1122 | $1,425 | $1.27 | 43d | 1 | 0.97mi |
| 2153 N National Ave Springfield, MO | 3.0 | 1.0 | 1163 | $1,195 | $1.03 | 13d | 1 | 1.01mi |
| 2034 N Washington Ave Springfield, MO | 2.0 | 1.0 | 800 | $875 | $1.09 | 43d | 1 | 1.05mi |
| 317 E Chase St Springfield, MO | 2.0 | 2.0 | 915 | $1,100 | $1.20 | 43d | 1 | 1.10mi |
| 2221 N Weller Ave Springfield, MO | 3.0 | 2.0 | 1215 | $1,395 | $1.15 | 13d | 1 | 1.11mi |
| 2234 N Travis Ave Springfield, MO | 1.0 | 1.0 | 890 | $750 | $0.84 | 43d | 1 | 1.13mi |
| 1014 E Walnut St Springfield, MO | 2.0 | 2.0 | 1200 | $1,200 | $1.00 | 43d | 1 | 1.13mi |
| 1147 E Elm St Unit 3 Springfield, MO | 2.0 | 1.0 | 780 | $975 | $1.25 | 13d | 1 | 1.14mi |
| 1333 E Elm St Springfield, MO | 1.0–2.0 | 1.0 | 830 | $980 | $1.18 | 43d | 1 | 1.15mi |
| 203 W Commercial St Unit 2F Springfield, MO | 2.0 | 1.0 | 1000 | $1,150 | $1.15 | 21d | 1 | 1.15mi |
| 926 E Walnut St Unit 11 Springfield, MO | 2.0 | 2.0 | 990 | $1,075 | $1.09 | 43d | 1 | 1.15mi |
| 1435 E Elm St Springfield, MO | 2.0 | 1.0 | 702 | $995 | $1.42 | 23d | 1 | 1.17mi |
| 1447 E Oakwood Ln Springfield, MO | 2.0 | 2.0 | 982 | $1,395 | $1.42 | 43d | 1 | 1.18mi |
| 945 E Elm St Unit 07 Springfield, MO | 1.0 | 1.0 | 759 | $875 | $1.15 | 43d | 1 | 1.19mi |
| 937 E Elm St Unit 07 Springfield, MO | 2.0 | 1.0 | 893 | $1,025 | $1.15 | 43d | 1 | 1.19mi |
| 2313 N Rogers Ave Unit 1 Springfield, MO | 2.0 | 2.0 | 882 | $950 | $1.08 | 13d | 1 | 1.19mi |
| 407 E Dale St Apt B Springfield, MO | 2.0 | 1.0 | 720 | $795 | $1.10 | 13d | 1 | 1.23mi |
| 2337 N Ramsey Ave Springfield, MO | 2.0 | 1.0 | 882 | $875 | $0.99 | 13d | 1 | 1.23mi |
| 2345 N Prospect Ave Springfield, MO | 2.0 | 1.0 | 792 | $850 | $1.07 | 13d | 1 | 1.24mi |
| 2337 N Delaware Ave Springfield, MO | 2.0 | 1.0 | 876 | $1,195 | $1.36 | 43d | 1 | 1.25mi |
| 616 W Webster St Springfield, MO | 2.0 | 1.5 | 1178 | $1,050 | $0.89 | 13d | 1 | 1.26mi |
| 1210 E Cherry St Springfield, MO | 2.0 | 2.0 | 750 | $800 | $1.07 | 43d | 1 | 1.29mi |
| 603 W Division St Springfield, MO | 2.0 | 1.0 | 816 | $995 | $1.22 | 13d | 1 | 1.30mi |
| 614 S Fremont Ave Springfield, MO | 1.0 | 1.0 | 777 | $995 | $1.28 | 43d | 1 | 1.31mi |
| 309 S Jefferson Ave Unit 211 Springfield, MO | 2.0 | 2.0 | 762 | $767 | $1.01 | 43d | 1 | 1.33mi |
| 647 W Central St Springfield, MO | 3.0 | 1.0 | 882 | $1,050 | $1.19 | 23d | 1 | 1.36mi |
| 138 Park Central Sq Springfield, MO | 1.0–2.0 | 1.0–2.0 | 1083 | $2,489 | $2.30 | 13d | 8 | 1.36mi |
| 209 W McDaniel St Unit 209-207 Springfield, MO | 1.0 | 1.0 | 700 | $950 | $1.36 | 43d | 1 | 1.40mi |
Listing history 20 events
-
2026-06-18days on market $130,000 Active 177 DOM
-
2026-06-17days on market $130,000 Active 176 DOM
-
2026-06-16days on market $130,000 Active 175 DOM
-
2026-06-15days on market $130,000 Active 174 DOM
-
2026-06-14days on market $130,000 Active 172 DOM
-
2026-06-10days on market $130,000 Active 169 DOM
-
2026-06-09days on market $130,000 Active 168 DOM
-
2026-06-08days on market $130,000 Active 167 DOM
-
2026-06-07days on market $130,000 Active 166 DOM
-
2026-06-03days on market $130,000 Active 162 DOM
-
2026-06-02days on market $130,000 Active 161 DOM
-
2026-06-01days on market $130,000 Active 160 DOM
-
2026-05-31days on market $130,000 Active 159 DOM
-
2026-05-30days on market $130,000 Active 158 DOM
-
2025-12-22$130,000 Active 675-char remark
Show marketing remark (675 chars)
Tenants lease is good for 9/30/26. Welcome to 1235 N Prospect Avenue, a well-located property situated near Ozarks Technical Community College (OTC) and offering convenient access to shopping, dining, and major roadways. This home features a functional floor plan with inviting living spaces, and neutral finishes throughout. The kitchen provides practical workspace and storage, while the bedrooms offer comfortable sizing for everyday living. Outside, enjoy a manageable yard with room to relax, garden, or entertain. Whether you're a homeowner or investor, this property presents a great opportunity in an established Springfield neighborhood. Schedule your showing today.
-
2020-06-17soldstatus
-
2019-03-19soldstatus $191,250
-
2016-01-12$63,205
-
2009-03-11soldstatus
-
2009-01-20soldstatus
ⓘ Source: listings_history table (triggers on properties + properties_extension) + one-shot
backfill from property_details.listing_events for pre-trigger history.
Tax reassessment forecast MO · Resets to sale price
- Current annual tax
- $526 · $44/mo
- Projected year-2 tax
- $1,261 · $105/mo
- Expected delta
- +$735/yr (+$61/mo · 139.9%)
ⓘ Screening estimate from a state-policy table — verify with the county assessor before closing.
Climate risk First Street
- Flood 1/10 Low FEMA zone X (unshaded) · 0% chance over 30 yrs
- Wildfire 1/10 Low
- Heat 5/10 Major 7 d/yr ≥104°F today · 18 d/yr by 30 yrs out
- Wind 2/10 Low
- Air quality 2/10 Low 1 unhealthy d/yr today · 2 by 30 yrs out
Nearby sold comps map
Loading sold comps map…
Walkable amenities ~0.75 mi
Loading nearby amenities…
Taxation est. · year 1
- Rental income
- $12,600
- − Mortgage interest
- −$7,282
- − Property taxes
- −$526
- − Insurance
- −$650
- − Repairs & maintenance
- −$1,008
- − Management
- −$1,008
- − Depreciation
- −$3,782
- Taxable loss
- −$1,655
- Est. tax savings @ 24.0%
- +$397
- After-tax cash flow
- $995/yr
For passive investors: Depreciation is non-cash, so a rental often shows a tax loss while cash-flowing — sheltering income. Rental losses are passive: they offset passive income freely, and up to $25,000/yr can offset ordinary (W-2) income if you actively participate and your MAGI is under $100k (phasing out to $0 by $150k); unused losses carry forward. On sale, claimed depreciation is recaptured at up to 25%, and gains may owe capital-gains tax (a 1031 exchange can defer both). Figures are a year-1 estimate at your 24.0% rate — not tax advice; consult a CPA.
Schools (NCES district)
- District
- Springfield R-XII
- NCES district ID
- 2928860
- Math proficiency
- 32% ▼ -2.00%
- Reading proficiency
- 46% ▼ -3.00%
- Median HH income
- $37,886
- Composite
- 32.45/100
- National rank
- #5717
- State rank
- #174 of 324 in MO
Livability — Springfield
- Score
- 75/100
- State rank
- #57
- US rank
- #4121
Category grades
Schools grade is shown separately in the Schools card above.
Census & demographics
- Census place
- Springfield, MO
- County
- Greene County · 244,327 people
- City population
- 223,044
- Metro
- Springfield, MO
- Population (ZIP)
- 46,739
- Household income
- $55,019
- Rent vs Own
- Severe rent burden
- 1818.0
Population outlook (Greene County) Hauer SSP2
- Today (2025)
- 319,054 people
- By 2030
- 335,135 · +5.0%
- By 2040
- 366,186 · +14.8%
- By 2050
- 397,431 · +24.6%
- By 2075
- 477,035 · +49.5%
- By 2100
- 520,828 · +63.2%
Race, ethnicity, and origin ACS 2023
- Neighborhood character
- Predominantly White (81%)
- Race & ethnicity
- White 81% Two or more races 8% Hispanic / Latino 5% Black 4% Asian 2%
- Common ancestry
- Slovak 2% Lithuanian 2% Italian 2%
- Foreign-born
- 3% · Canada, Vietnam
- Languages at home
- 95% English-only · Spanish 2% Vietnamese 1% Other Indo-European 1%
Political lean MEDSL · Greene
- 2024 margin
- Strong R (+20.8) · D 38.9% · R 59.7% · Other 1.4%
- 2008→2024 swing
- -5.0pp toward R · 2008: -15.8pp · 2024: -20.8pp
- All cycles
- 2024: R+20.8 2020: R+20.1 2016: R+27.4 2012: R+24.4 2008: R+15.8
Not yet ingested
- Civics
- —
Market trends
- HPI YoY
- ▼ -99.72%
- Current HPI
- 212.9826
- Rent YoY
- ▲ 4.82%
- Metro
- Springfield, MO
- State GDP YoY
- ▲ 1.84%
- F500 in state
- 20
Industry mix (Fortune 500 HQ in MO)
| Industry | F500 HQs | Revenue |
|---|---|---|
| Healthcare | 1 | $163B |
|
||
| Insurance | 1 | $21B |
|
||
| Industrial Technology | 1 | $17B |
|
||
| Retail | 1 | $16B |
|
||
| Industrial Distribution | 1 | $10B |
|
||
| Utilities | 1 | $9B |
|
||
Price history
+105.7% since first listed6 events — show timeline
- 2025-12-22 Listed $130,000 SOMO
- 2020-06-17 Sold (Public Records) — Public Records
- 2019-03-19 Sold (Public Records) $191,250 Public Records
- 2016-01-12 Listed $63,205 SOMO
- 2009-03-11 Sold (Public Records) — Public Records
- 2009-01-20 Sold (Public Records) — Public Records
Property tax history
+3.9%/yrLatest (2025): $526 · +18.5% YoY. Source: county tax records.
Cash-flow waterfall
monthlySold comps — $/sqft
last 12 mo · ≤1 miLoading sold comps…