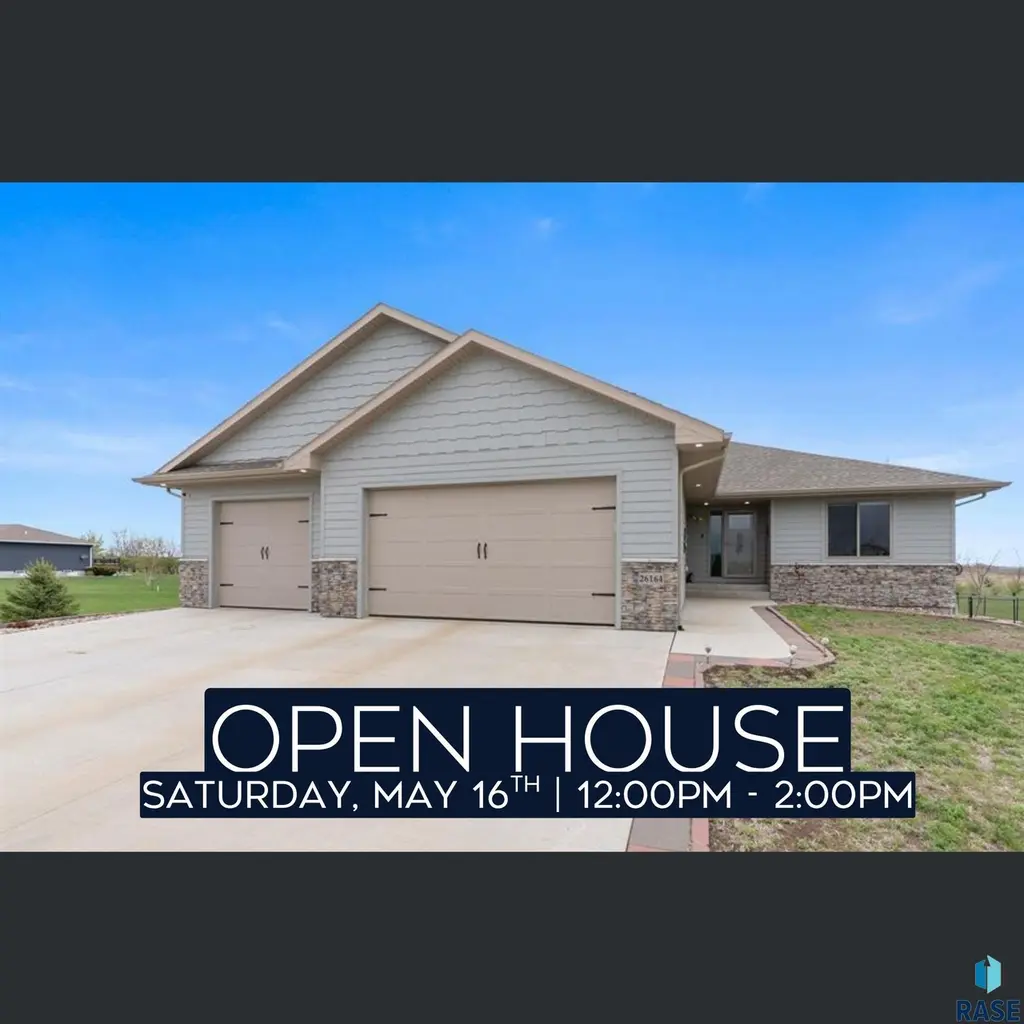
26164 Reed Ct Ct · Canistota, SD
Flood risk No data
- FEMA flood zone
- —
- Chance of flooding over 30 yrs
- —
- Est. flood insurance / yr
- —
Fire risk No data
- Est. fire insurance / yr
- —
Heat risk No data
- Hot days now (above threshold)
- —
- Hot days in 30 yrs
- —
Wind risk No data
- Chance of severe wind over 30 yrs
- —
Air-quality risk No data
- Unhealthy air days now
- —
- Unhealthy air days in 30 yrs
- —
Risk factors via First Street. Map © Google.
Why this score? — see what drove the D- grade
The composite is a weighted blend of 9 inputs, each scored 0–100. Each bar is that input's sub-score; the figure is the points it added to the 100-point composite (weight × sub-score).
- ARV discount +13.6/15.0
- Appreciation +9.8/10.0
- Schools +5.9/10.0
- Livability +3.3/5.0
- Rent growth +2.5/5.0
- Condition / age +2.5/5.0
- Cash flow +0.9/30.0
- 1% rule +0.0/10.0
- DSCR +0.0/10.0
$554,900
🖨 Deal sheet (PDF) 📄 Offer letter ✓ Due diligence
Key facts
- Half-acre lot
- Gas fireplace
- Vaulted ceilings
Tags
Property features AI
Finance
- HOA & community: Has HOA with road maintenance; $25 association fee
Exterior
- Parking: Attached 3-car garage (37x28) with drain, garage heater, oversized bay, and water hookups; Concrete parking
- Utilities: Rural water; Septic tank
- Home design: Single-family ranch-style home; Outside city limits
- Construction: Hard board and brick exterior; Poured foundation; Composition roof
- Exterior features: Deck; Chain link fencing; Garden area; Outside city limits
Interior
- Kitchen: Vaulted kitchen with walk-in pantry; Dishwasher; Disposal; Electric range; Microwave; Refrigerator
- Bedrooms: Main-level primary bedroom (13x14); Main-level second bedroom with double closet (11x12); Basement bedroom with walk-in closet (11x12); Basement bedroom with walk-in closet (11x12)
- Flooring: Carpet; Laminate
- Bathrooms: Two full baths; One 3/4 bath; Main level has full and 3/4 baths; basement has a full bath
- Heating & cooling: Propane heating; Central air; Electric water heater
- Interior features: Main floor laundry; Master bath with walk-in shower and walk-in closet; Vaulted ceilings; Gas fireplace in living room; Water softener (owned and stays)
- Laundry & utility: Main floor laundry/mud room; Washer/dryer hookups in garage (water hook ups noted); Humidifier
Neighborhood map
What this means for you Summary
Snapshot
- This is a 4-bed/3.0-bath single-family listed at $555k.
Deal economics
- At list price, monthly cash flow is $-2k ($-28k/yr) — negative.
- To cash-flow at today's rent, offer at most $146k (73.6% below list).
- To meet the 1% rule (rent ≥ 1% of price), the offer needs to be $149k (73.2% below list).
- Recommended offer: $146k (73.6% below list) — sets the bar for cash-flow.
Location & tenants
- Location reads 66/100 on livability (#126 in SD) — a middle-class / working-renter tenant base. Strengths: cost of living A+, housing A+; Watch: crime D-, amenities F, commute F.
- Canistota School District 43-1 (rural): math 65% / reading 70% proficiency, ranked #7 of 148 in SD (top 5%) — acceptable for families but not a draw, mixed tenant base, ~2y average lease.
- Zoned schools: Canistota Elementary - 02 (math 74% / reading 64%, grade A-, #19 of 253 statewide, top 12%, 157 students, 24% FRL); Canistota Middle School - 03 (math 54% / reading 64%, grade B, #19 of 143 statewide, top 18%, 60 students, 27% FRL); Canistota High School - 01 (math 24% / reading 75%, grade D+, #69 of 151 statewide, top 65%, 76 students, 16% FRL) — zoned schools at 22% FRL track the district average.
- Market conditions: 18 active listings in the ZIP; 22 units permitted in McCook County in 2024 (0 in 5+ unit buildings).
Forward outlook
- In year one you build about $57k of equity ($4k loan paydown + $53k appreciation (9.5% local appreciation)).
- McCook County population projected at +7% by 2050 — modest demand growth; plan on rents tracking national, not racing it.
- By year 2, paydown + projected appreciation supports a ~$91k cash-out refi (75% LTV) — recoverable capital for the next deal without selling this one.
Negotiation context
- It's been on market 51 days — a 3% lower offer ($538k) is reasonable based on typical stale-listing flexibility.
- 2 sale attempts with the ask held roughly flat each time — persistent listings suggest the price (not the market) is what's stuck; bring a comps-based counter.
Questions for the listing agent
- What do current leases actually rent for vs. the listed asking? Can we see a recent rent roll and the last 12 months of T-12 income?
- It's been on market 51 days. Have you received any prior offers? Is the seller open to a 74% concession, seller financing, or rate buy-down credit?
- What does the HOA fee cover, when was the last increase, and are there any pending special assessments or reserve-fund shortfalls?
- Is there a deadline driving the sale (1031 exchange, divorce, estate, relocation)? That informs how much negotiation room exists.
- Schools are B-rated — typically a magnet for longer-tenancy family renters. What's the average tenant stay here, and is there a school-zone premium baked into asking?
- Crime grade is D in this area — have there been break-ins, vandalism, or insurance claims at this property in the last 3 years? What carrier currently insures it and at what premium?
- The area grade is low — what's the realistic commute time and amenity access for the typical tenant pool here? Any planned neighborhood developments (good or bad) we should know about?
- What's the average days-on-market for RENTAL listings here right now (not sales)? A rising rental-DOM trend means longer vacancies and softer asking-rent achievability than the comps imply.
- What's the recent tenant-quality profile in this submarket — average credit score on applications, eviction rate, late-payment / NSF rate, and stable-employment percentage? A property-management company in the area should have these aggregated.
- How much new for-sale + rental construction is in the pipeline within 1–3 miles? Heavy new supply typically softens prices + rents 12–24 months out; constrained supply supports both.
Investment metrics
- 1% rule
- 0.27% ✗
- Cap rate
- 1.29%
- Cash-on-cash
- -17.86%
- DSCR
- 0.21
- GRM
- 31.1
CMA / ARV
- ARV (median comp)
- $641,714
- List price
- $554,900
- Delta
- -13.53%
- Verdict
- UNDERPRICED
- Comps
- 2 within 1.0 mi
Show comp detail 2 sales within ~0.75 mi
| Address | Dist | Beds/Ba | Sqft | Sold | Price | $/sf | Match |
|---|---|---|---|---|---|---|---|
| 26182 Reed Ct Ct | 0.19mi | 4/2.0 | 3,520 (-6%) | 6mo | $665,000 | $189 | 72 |
| 45218 Trystan Ct Ct | 0.34mi | 4/3.0 | 3,462 (-8%) | 2mo | $686,000 | $198 | 70 |
Match score weights: distance 35% · size 25% · config 20% · recency 20%. Top-matched comps best support the ARV.
Projected returns pro-forma
9.54% appreciation · 3.0% rent growth · sell at horizon
- IRR
- 10.8%
- Equity multiple
- 1.88×
- Total profit
- $137,504
- Equity at exit
- $481,535
- IRR
- 11.8%
- Equity multiple
- 4.32×
- Total profit
- $516,154
- Equity at exit
- $1,019,510
Cash invested: $155,372 (down + closing). Projections, not guarantees.
Landlord ↔ Tenant lean methodology
- Overall (STATE)
- 83 Strongly Landlord-Friendly
- State South Dakota
- 83 Strongly Landlord-Friendly · R+16
- County
- — inherits STATE
- City
- — inherits STATE
ZIP-level market 57012
- Home prices YoY
- 3.2%
- Active inventory
- 18
- Price-to-rent
- 31.1×
Monthly cashflow live
- Estimated rent
- $1,488 medium interval (Pro) →
- Mortgage (P&I)
- −$2,910
- Tax from tax record
- −$322 /mo · $3,861/yr
- Insurance
- −$231
- HOA
- −$25
- Vacancy / Maint / Mgmt
- −$313
- Net cashflow
- $-2,312
Break-even live
Sensitivity live
| Price | -10% $-1,998 | -5% $-2,155 | +0% $-2,312 | +5% $-2,469 | +10% $-2,626 |
|---|---|---|---|---|---|
| Rent | -10% $-2,430 | -5% $-2,371 | +0% $-2,312 | +5% $-2,253 | +10% $-2,195 |
| Rate | -1.0pp $-2,033 | -0.5pp $-2,171 | base $-2,312 | +0.5pp $-2,456 | +1.0pp $-2,602 |
UW: 25.0% down · 7.5% · 30yr · 1.5% tax · 5.0% vac · 8.0% maint · 8.0% mgmt
Financing live
Cash to close
- Down payment
- $138,725
- Closing costs
- $16,647
- Reserves months
- —
- Total cash needed
- —
Loan-product check · same deal, 3 products live
Conventional
25% down · 7.5% · 30yr
- Down + closing
- —
- Monthly P&I
- —
- Monthly cashflow
- —
- DSCR
- —
- Eligible?
- —
Personal DTI + credit; lowest rate.
DSCR
20% down · 8.5% · 30yr
- Down + closing
- —
- Monthly P&I
- —
- Monthly cashflow
- —
- DSCR
- —
- Eligible?
- —
No personal income docs; deal must DSCR.
Hard money
10% down · 12.0% · 12mo
- Down + closing
- —
- Monthly P&I
- —
- Monthly cashflow
- —
- DSCR
- —
- Eligible?
- —
Short-term bridge; refi at stabilization.
HOA detail
- Monthly dues
- $25 · $300/yr
Listing history 21 events
-
2026-06-21days on market $554,900 Active 51 DOM
-
2026-06-21days on market $554,900 Active 50 DOM
-
2026-06-18days on market $554,900 Active 48 DOM
-
2026-06-17days on market $554,900 Active 47 DOM
-
2026-06-16days on market $554,900 Active 46 DOM
-
2026-06-15days on market $554,900 Active 45 DOM
-
2026-06-13days on market $554,900 Active 43 DOM
-
2026-06-12days on market $554,900 Active 42 DOM
-
2026-06-09days on market $554,900 Active 39 DOM
-
2026-06-08days on market $554,900 Active 38 DOM
-
2026-06-08days on market $554,900 Active 37 DOM
-
2026-06-05days on market $554,900 Active 35 DOM
-
2026-06-04days on market $554,900 Active 33 DOM
-
2026-06-02days on market $554,900 Active 32 DOM
-
2026-06-01days on market $554,900 Active 31 DOM
-
2026-05-31days on market $554,900 Active 30 DOM
-
2026-05-17price $554,900 1510-char remark
-
2026-04-30$568,000 Active 1510-char remark
-
2026-04-20historical
-
2026-04-07price $568,000
-
2026-02-25$575,000 Active
ⓘ Source: listings_history table (triggers on properties + properties_extension) + one-shot
backfill from property_details.listing_events for pre-trigger history.
Tax reassessment forecast SD · Resets to sale price
- Current annual tax
- $3,861 · $322/mo
- Projected year-2 tax
- $7,269 · $606/mo
- Expected delta
- +$3,409/yr (+$284/mo · 88.3%)
ⓘ Screening estimate from a state-policy table — verify with the county assessor before closing.
Nearby sold comps map
Loading sold comps map…
Walkable amenities ~0.75 mi
Loading nearby amenities…
Taxation est. · year 1
- Rental income
- $17,860
- − Mortgage interest
- −$31,083
- − Property taxes
- −$3,861
- − Insurance
- −$2,774
- − Repairs & maintenance
- −$1,429
- − Management
- −$1,429
- − HOA
- −$300
- − Depreciation
- −$16,143
- Taxable loss
- −$39,158
- Est. tax savings @ 24.0%
- +$9,398
- After-tax cash flow
- $-18,347/yr
For passive investors: Depreciation is non-cash, so a rental often shows a tax loss while cash-flowing — sheltering income. Rental losses are passive: they offset passive income freely, and up to $25,000/yr can offset ordinary (W-2) income if you actively participate and your MAGI is under $100k (phasing out to $0 by $150k); unused losses carry forward. On sale, claimed depreciation is recaptured at up to 25%, and gains may owe capital-gains tax (a 1031 exchange can defer both). Figures are a year-1 estimate at your 24.0% rate — not tax advice; consult a CPA.
Schools (NCES district)
- District
- Canistota School District 43-1
- NCES district ID
- 4610320
- Math proficiency
- 65% ▲ 5.00%
- Reading proficiency
- 70% ▼ -10.00%
- Median HH income
- $53,811
- Composite
- 58.95/100
- National rank
- #1971
- State rank
- #7 of 148 in SD
Livability — Canistota
- Score
- 66/100
- State rank
- #126
- US rank
- #11934
Category grades
Schools grade is shown separately in the Schools card above.
Census & demographics
- Population (ZIP)
- 1,164
Population outlook (McCook County) Hauer SSP2
- Today (2025)
- 5,591 people
- By 2030
- 5,617 · +0.5%
- By 2040
- 5,771 · +3.2%
- By 2050
- 5,996 · +7.2%
- By 2075
- 7,870 · +40.8%
- By 2100
- 11,517 · +106.0%
Race, ethnicity, and origin ACS 2023
- Neighborhood character
- Predominantly White (88%)
- Race & ethnicity
- White 88% Two or more races 6% Hispanic / Latino 5% Black 1%
- Common ancestry
- Iranian 8% Portuguese 7% Serbian 3%
- Foreign-born
- 1%
- Languages at home
- 98% English-only · Spanish 2%
Political lean MEDSL · McCook
- 2024 margin
- Solid R (+49.3) · D 24.2% · R 73.5% · Other 2.3%
- 2008→2024 swing
- -34.8pp toward R · 2008: -14.5pp · 2024: -49.3pp
- All cycles
- 2024: R+49.3 2020: R+44.8 2016: R+45.3 2012: R+28.7 2008: R+14.5
Not yet ingested
- Civics
- —
Market trends
- HPI YoY
- ▲ 9.54%
- Current HPI
- 308.734
- Rent YoY
- —
- Metro
- —
- State GDP YoY
- ▲ 0.70%
- F500 in state
- 2
Industry mix (Fortune 500 HQ in SD)
| Industry | F500 HQs | Revenue |
|---|---|---|
| Utilities | 1 | $1B |
|
||
Price history
-3.5% since first listed5 events — show timeline
- 2026-05-17 Price Changed $554,900 REALTOR® Association of the Sioux Empire
- 2026-04-30 Listed $568,000 REALTOR® Association of the Sioux Empire
- 2026-04-20 Listing Removed — REALTOR® Association of the Sioux Empire
- 2026-04-07 Price Changed $568,000 REALTOR® Association of the Sioux Empire
- 2026-02-25 Listed $575,000 REALTOR® Association of the Sioux Empire
Property tax history
+188.7%/yrLatest (2025): $3,861 · -27.3% YoY. Source: county tax records.
Cash-flow waterfall
monthlySold comps — $/sqft
last 12 mo · ≤1 miLoading sold comps…