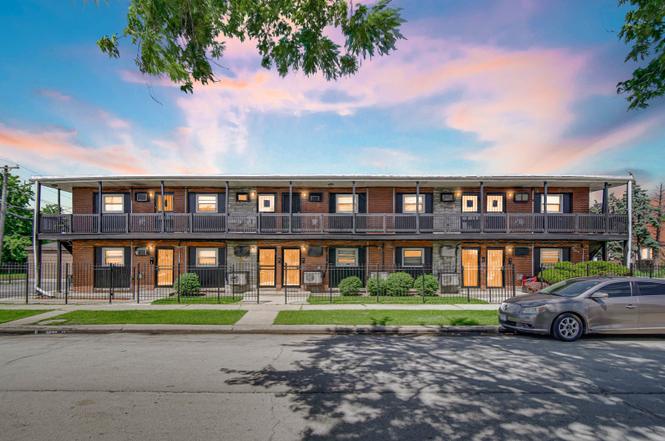
 20-Plex
184 W 147th St · Harvey, IL
Flood risk 4/10 · Minor
- FEMA flood zone
- AH
- Chance of flooding over 30 yrs
- 0.2%
- Est. flood insurance / yr
- $1,142 – $2,507
Fire risk 1/10 · Minimal
- Est. fire insurance / yr
- $804 – $1,492
Heat risk 3/10 · Minor
- Hot days now (above 102°F)
- 7 days/yr
- Hot days in 30 yrs
- 15 days/yr
Wind risk 2/10 · Minimal
- Chance of severe wind over 30 yrs
- —
Air-quality risk 3/10 · Minor
- Unhealthy air days now
- 4 days/yr
- Unhealthy air days in 30 yrs
- 4 days/yr
Risk factors via First Street. Map © Google.
Why this score? — see what drove the B+ grade
The composite is a weighted blend of 9 inputs, each scored 0–100. Each bar is that input's sub-score; the figure is the points it added to the 100-point composite (weight × sub-score).
- Cash flow +30.0/30.0
- 1% rule +10.0/10.0
- DSCR +10.0/10.0
- Appreciation +10.0/10.0
- ARV discount +7.5/15.0
- Livability +3.4/5.0
- Rent growth +2.5/5.0
- Condition / age +2.5/5.0
- Schools +0.7/10.0
$1,100,000
🖨 Deal sheet 📄 Offer letter ✓ Due diligence
Multi-family units
County records classify this as Multi-Family (5+ Unit). Listing-text estimate: 20 units. confirmed
5+ unit building — per-unit beds/baths from public records are typically unavailable; the breakdown below (if shown) is an estimate from the listing text.
Listing remarks MLS
20-Unit with excellent access to main thoroughfares. Close proximity to shopping, restaurants and markets. The income potential is amazing! Owner must sell, so this is your opportunity to pick up a cash cow and reap the financial benefits. All electric utilities. Tenants pay electric. Motivated seller. Buyer responsible for termite inspection. Seller will not provide survey. Nds a little TLC. TAKING BACKUP OFFERS
Key facts
- Value add potential
- Stable cash flow
- 0.34 acre lot
Tags
Property features AI
Finance
- Other: Property located on the south side of 147th Street just southwest of local middle school
- Financial info: Total monthly income approximately $14,975; Gross annual income approximately $179,700; Gross rent multiplier about 6.12; Typical monthly rent per unit roughly $700–$775
Exterior
- Parking: Outdoor parking with approximately 19–30 spaces
- Utilities: Separate utilities/heat per unit
- Home design: Multi-family property (5+ units); 20 total residential units
- Construction: Multiple parcels included; Parcels: 29073060100000; additional parcels 29073060080000, 29073060090000, 29073060070000
- Exterior features: Lot dimensions approximately 109 x 136; Zoned for multi-family
Interior
- Kitchen: 20 ranges (stoves) in the building
- Bedrooms: Studios or one-room units (1 room per unit)
- Bathrooms: One full bathroom per unit
- Heating & cooling: Individual heat/ventilation systems for each unit
- Interior features: Built before 1978
- Laundry & utility: Separate heating/ventilation for each unit
Neighborhood map
What this means for you Summary
Snapshot
- This is a 20 × ?-bed/1.0-bath units multifamily listed at $1.10M.
Deal economics
- At list price, monthly cash flow is $6k ($74k/yr) — positive. Per door: $310/mo.
- The deal already cash-flows at list — no discount required.
- Meets the 1% rule at list price ($18k rent vs $1.10M).
- Cap rate 13.2% vs local median 9.3% in Harvey — top-decile yield for the area; either an underpriced asset or a hidden risk that comps aren't pricing in. Stress-test before assuming the spread holds.
Location & tenants
- Location reads 67/100 on livability (#539 in IL) — a middle-class / working-renter tenant base. Strengths: commute A+, cost of living A+, housing A-; Watch: health & safety D+, schools F, crime F.
- Thornton Twp Hsd 205 (suburban): math 7% / reading 8% proficiency, ranked #594 of 620 in IL (top 96%) — low school quality limits family demand, transient renter base, plan for 1-2y turnover.
- Market conditions: 134 active listings in the ZIP; 6,272 units permitted in Cook County in 2024 (4,658 in 5+ unit buildings).
Forward outlook
- In year one you build about $118k of equity ($8k loan paydown + $110k appreciation (10.0% local appreciation)).
- At projected returns (10.0% appreciation + 3.0% rent growth), your $308k cash investment doubles in ~2 years — after that, you're playing with house money.
- By year 2, paydown + projected appreciation supports a ~$189k cash-out refi (75% LTV) — recoverable capital for the next deal without selling this one.
Negotiation context
- Only 1 days on market — expect competitive offers; lowballing is unlikely to land.
- 6 sale attempts since 15y ago with the ask held roughly flat each time — persistent listings suggest the price (not the market) is what's stuck; bring a comps-based counter.
- Current owner paid $200k; list at $1.10M implies a 450% gain — meaningful room to come down on a strong offer.
Risks & watch-outs
- Watch-outs: flood insurance adds $152/mo.
- Climate carrying-cost: in FEMA flood zone AH (mandatory federal flood insurance) — expect insurance premiums to compound above CPI over the hold.
Questions for the listing agent
- Can we see the unit-by-unit rent roll, current vacancy, and any below-market leases? What's the average tenancy length?
- What capital expenditures (roof, boiler, parking lot, exteriors) have been made in the last 5 years, and what's planned in the next 2?
- Built in 1964 — when were the roof, HVAC, electrical panel, plumbing, and water heater last replaced?
- What's the actual annual flood-insurance premium (NFIP or private), and is the property in a SFHA with mandatory coverage?
- Is there a deadline driving the sale (1031 exchange, divorce, estate, relocation)? That informs how much negotiation room exists.
- Schools are F-rated, which usually means shorter tenancies and higher turnover. Who's the typical renter profile here, and what's been the actual vacancy rate?
- Crime grade is F in this area — have there been break-ins, vandalism, or insurance claims at this property in the last 3 years? What carrier currently insures it and at what premium?
- What's the average days-on-market for RENTAL listings here right now (not sales)? A rising rental-DOM trend means longer vacancies and softer asking-rent achievability than the comps imply.
- What's the recent tenant-quality profile in this submarket — average credit score on applications, eviction rate, late-payment / NSF rate, and stable-employment percentage? A property-management company in the area should have these aggregated.
- How much new apartment / multifamily construction is in the pipeline within 1–3 miles? Heavy new supply (>2% of stock underway) typically softens rents 12–24 months out; light construction supports rent growth.
Investment metrics
- 1% rule
- 1.67% ✓
- Cap rate
- 13.22%
- Cash-on-cash
- 24.75%
- DSCR
- 2.10
- GRM
- 5.0
CMA / ARV
No comps found within radius.
Projected returns pro-forma
10.0% appreciation · 3.0% rent growth · sell at horizon
- IRR
- 42.5%
- Equity multiple
- 4.23×
- Total profit
- $994,776
- Equity at exit
- $990,967
- IRR
- 36.7%
- Equity multiple
- 9.51×
- Total profit
- $2,620,316
- Equity at exit
- $2,137,058
Cash invested: $308,000 (down + closing). Projections, not guarantees.
Landlord ↔ Tenant lean methodology
- Overall (STATE)
- 43 Moderately Tenant-Leaning
- State Illinois
- 43 Moderately Tenant-Leaning · D+7
- County
- — inherits STATE
- City
- — inherits STATE
ZIP-level market 60426
- Home prices YoY
- 6.9%
- Active inventory
- 134
- Price-to-rent
- 99.6×
Monthly cashflow live
- Estimated rent
- $18,407 medium interval (Pro) →
- Mortgage (P&I)
- −$5,769
- Tax from tax record
- −$1,961 /mo · $23,538/yr
- Insurance
- −$458
- Flood insurance flood zone
- −$152 /mo · $1,824/yr
- HOA
- −$0
- Vacancy / Maint / Mgmt
- −$3,865
- Net cashflow
- $6,201
Break-even live
20-unit breakdown (identical units grouped — click to expand)
| Units | Beds | Baths | Est. rent |
|---|---|---|---|
| 20× units | 0 | 1 | $18,400 |
| #1 | 0 | 1 | $920 |
| #2 | 0 | 1 | $920 |
| #3 | 0 | 1 | $920 |
| #4 | 0 | 1 | $920 |
| #5 | 0 | 1 | $920 |
| #6 | 0 | 1 | $920 |
| #7 | 0 | 1 | $920 |
| #8 | 0 | 1 | $920 |
| #9 | 0 | 1 | $920 |
| #10 | 0 | 1 | $920 |
| #11 | 0 | 1 | $920 |
| #12 | 0 | 1 | $920 |
| #13 | 0 | 1 | $920 |
| #14 | 0 | 1 | $920 |
| #15 | 0 | 1 | $920 |
| #16 | 0 | 1 | $920 |
| #17 | 0 | 1 | $920 |
| #18 | 0 | 1 | $920 |
| #19 | 0 | 1 | $920 |
| #20 | 0 | 1 | $920 |
| Total (20 units) | $18,407 | ||
UW: 25.0% down · 7.5% · 30yr · 1.5% tax · 5.0% vac · 8.0% maint · 8.0% mgmt
Financing live
Cash to close
- Down payment
- $275,000
- Closing costs
- $33,000
- Reserves months
- —
- Total cash needed
- —
Loan-product check · same deal, 3 products live
Conventional
25% down · 7.5% · 30yr
- Down + closing
- —
- Monthly P&I
- —
- Monthly cashflow
- —
- DSCR
- —
- Eligible?
- —
Personal DTI + credit; lowest rate.
DSCR
20% down · 8.5% · 30yr
- Down + closing
- —
- Monthly P&I
- —
- Monthly cashflow
- —
- DSCR
- —
- Eligible?
- —
No personal income docs; deal must DSCR.
Hard money
10% down · 12.0% · 12mo
- Down + closing
- —
- Monthly P&I
- —
- Monthly cashflow
- —
- DSCR
- —
- Eligible?
- —
Short-term bridge; refi at stabilization.
Listing history 2 events
-
2026-06-17remarks 699-char remark
-
2026-06-17$1,100,000 Active 1 DOM
ⓘ Source: listings_history table (triggers on properties + properties_extension) + one-shot
backfill from property_details.listing_events for pre-trigger history.
Tax reassessment forecast IL · Partial reset (capped growth)
- Current annual tax
- $23,538 · $1,961/mo
- Projected year-2 tax
- $24,254 · $2,021/mo
- Expected delta
- +$716/yr (+$60/mo · 3.0%)
ⓘ Screening estimate from a state-policy table — verify with the county assessor before closing.
Climate risk First Street
- Flood 4/10 Moderate FEMA zone AH · 20% chance over 30 yrs
- Wildfire 1/10 Low
- Heat 3/10 Moderate 7 d/yr ≥102°F today · 15 d/yr by 30 yrs out
- Wind 2/10 Low
- Air quality 3/10 Moderate 4 unhealthy d/yr today · 4 by 30 yrs out
Nearby sold comps map
Loading sold comps map…
Walkable amenities ~0.75 mi
Loading nearby amenities…
Taxation est. · year 1
- Rental income
- $220,884
- − Mortgage interest
- −$61,617
- − Property taxes
- −$23,538
- − Insurance
- −$7,324
- − Repairs & maintenance
- −$17,671
- − Management
- −$17,671
- − Depreciation
- −$32,000
- Taxable income
- $61,063
- Est. tax owed @ 24.0%
- −$14,655
- After-tax cash flow
- $59,759/yr
For passive investors: Depreciation is non-cash, so a rental often shows a tax loss while cash-flowing — sheltering income. Rental losses are passive: they offset passive income freely, and up to $25,000/yr can offset ordinary (W-2) income if you actively participate and your MAGI is under $100k (phasing out to $0 by $150k); unused losses carry forward. On sale, claimed depreciation is recaptured at up to 25%, and gains may owe capital-gains tax (a 1031 exchange can defer both). Figures are a year-1 estimate at your 24.0% rate — not tax advice; consult a CPA.
Schools (NCES district)
- District
- Thornton Twp Hsd 205
- NCES district ID
- 1738970
- Math proficiency
- 7% ▬ 0.00%
- Reading proficiency
- 8% ▼ -2.00%
- Median HH income
- $43,392
- Composite
- 6.92/100
- National rank
- #9976
- State rank
- #594 of 620 in IL
Livability — Harvey
- Score
- 67/100
- State rank
- #539
- US rank
- #11162
Category grades
Schools grade is shown separately in the Schools card above.
Census & demographics
- Census place
- Harvey, IL
- City population
- 23,066
- Population (ZIP)
- 23,066
Population outlook (Cook County) Hauer SSP2
- Today (2025)
- 5,347,519 people
- By 2030
- 5,357,703 · +0.2%
- By 2040
- 5,324,924 · -0.4%
- By 2050
- 5,230,762 · -2.2%
- By 2075
- 4,785,735 · -10.5%
- By 2100
- 4,188,836 · -21.7%
Race, ethnicity, and origin ACS 2023
- Neighborhood character
- Majority Black (59%)
- Race & ethnicity
- Black 59% Hispanic / Latino 33% Two or more races 12% White 3% Asian 2%
- Hispanic origin (detail)
- Mexican 31%
- Foreign-born
- 17% · Canada
- Languages at home
- 67% English-only · Spanish 30% Other Indo-European 2% French/Haitian/Cajun 1%
Political lean MEDSL · Cook
- 2024 margin
- Solid D (+42.0) · D 70.4% · R 28.4% · Other 1.2%
- 2008→2024 swing
- -11.4pp toward R · 2008: 53.4pp · 2024: 42.0pp
- All cycles
- 2024: D+42.0 2020: D+50.3 2016: D+53.0 2012: D+49.4 2008: D+53.4
Not yet ingested
- Civics
- —
Market trends
- HPI YoY
- ▲ 20.36%
- Current HPI
- 313.7895
- Rent YoY
- —
- Metro
- —
- State GDP YoY
- ▲ 1.59%
- F500 in state
- 60
Industry mix (Fortune 500 HQ in IL)
| Industry | F500 HQs | Revenue |
|---|---|---|
| Insurance | 4 | $201B |
|
||
| Consumer Goods | 4 | $87B |
|
||
| Industrial Machinery | 3 | $64B |
|
||
| Healthcare | 2 | $55B |
|
||
| Retail / Pharmacy | 1 | $148B |
|
||
| Agriculture / Food | 1 | $86B |
|
||
Price history
+332.7% since first listed18 events — show timeline
- 2026-06-16 Listed $1,100,000 MRED as Distributed by MLS Grid
- 2024-09-30 Listing Removed — MRED as Distributed by MLS Grid
- 2024-08-16 Listed — MRED as Distributed by MLS Grid
- 2012-06-29 Sold (Public Records) $200,000 Public Records
- 2012-06-15 Sold (MLS) $200,000 MRED as Distributed by MLS Grid
- 2012-04-26 Contingent — MRED as Distributed by MLS Grid
- 2012-04-20 Relisted — MRED as Distributed by MLS Grid
- 2012-04-20 Price Changed $259,900 MRED as Distributed by MLS Grid
- 2012-02-16 Contingent — MRED as Distributed by MLS Grid
- 2012-02-15 Relisted — MRED as Distributed by MLS Grid
- 2011-11-23 Pending — MRED as Distributed by MLS Grid
- 2011-10-26 Relisted — MRED as Distributed by MLS Grid
- 2011-10-26 Price Changed $299,900 MRED as Distributed by MLS Grid
- 2011-10-24 Contingent — MRED as Distributed by MLS Grid
- 2011-09-05 Price Changed $349,900 MRED as Distributed by MLS Grid
- 2011-07-28 Price Changed $399,900 MRED as Distributed by MLS Grid
- 2011-07-02 Listed $425,000 MRED as Distributed by MLS Grid
- 1996-07-11 Sold (Public Records) $254,193 Public Records
Property tax history
+6.3%/yrLatest (2023): $23,538 · +12.2% YoY. Source: county tax records.
Cash-flow waterfall
monthlySold comps — $/sqft
last 12 mo · ≤1 miLoading sold comps…