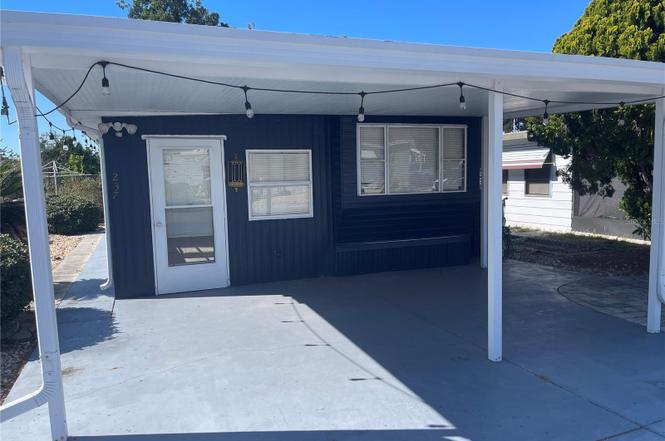
237 Palm Crest Ln · Davenport, FL
Flood risk 1/10 · Minimal
- FEMA flood zone
- X (unshaded)
- Chance of flooding over 30 yrs
- 0.0%
- Est. flood insurance / yr
- $507 – $1,088
Fire risk 5/10 · Moderate
- Est. fire insurance / yr
- $947 – $1,759
Heat risk 8/10 · Major
- Hot days now (above 108°F)
- 7 days/yr
- Hot days in 30 yrs
- 24 days/yr
Wind risk 9/10 · Severe
- Chance of severe wind over 30 yrs
- 99.0%
Air-quality risk 1/10 · Minimal
- Unhealthy air days now
- 0 days/yr
- Unhealthy air days in 30 yrs
- 0 days/yr
Risk factors via First Street. Map © Google.
Why this score? — see what drove the B- grade
The composite is a weighted blend of 9 inputs, each scored 0–100. Each bar is that input's sub-score; the figure is the points it added to the 100-point composite (weight × sub-score).
- Cash flow +30.0/30.0
- 1% rule +10.0/10.0
- DSCR +10.0/10.0
- ARV discount +7.5/15.0
- Schools +3.5/10.0
- Livability +3.5/5.0
- Condition / age +2.5/5.0
- Rent growth +1.8/5.0
- Appreciation +0.0/10.0
$75,000
🖨 Deal sheet 📄 Offer letter ✓ Due diligence
Listing remarks
Huge Price improvement!!! Some pictures might virtually staged. NO Lot rent! NO CDD! Grass free and no lawn maintenance. Retirement Living at it's Best with low HOA fees!! Come see this lovely manufacture home in Beautiful Center Crest RV Park where you own the land The newer paint provides a wonderfully elegant look and sophisticated and timeless appeal. Big home improvement news: newer, more efficient AC system! It helps saving on utility bills! New Tankless water heater. It’s a much more modern and space-saving system that provides a continuous supply of hot water on demand. Newly remodeled bathroom designed for your comfort. One more of the major benefits of this home is the recen
Key facts
- Low hoa fees
- Own the land
- Newer ac system
Tags
Property features AI
Finance
- Other: Total living area 824 square feet; Green energy efficient: HVAC and water heater
- Financial info: Lease restrictions apply
- HOA & community: Center Crest Lot Owners Association (HOA required; association approval required); Monthly HOA fee $58 ($696 annually); Association covers pool, recreational facilities, security, and trash; Clubhouse and community mailbox; Deed restrictions; Golf carts allowed; Pool; Senior community; Pets allowed (cats and dogs; breed restrictions)
Exterior
- Parking: Driveway; Golf cart parking; Parking pad
- Security: Community security included in association services
- Utilities: Public water; Public sewer; Electricity available
- Home design: Residential manufactured home (single wide); One level; Faces east
- Construction: Metal siding; Shingle roof; Other foundation
- Exterior features: Rain gutters; Storage; Workshop; Conservation area lot; 37 x 75 lot (asphalt road)
Interior
- Kitchen: Range; Refrigerator
- Bedrooms: 1 bedroom
- Flooring: Laminate; Tile
- Bathrooms: 1 full bathroom
- Heating & cooling: Central heating (electric); Central air conditioning
- Interior features: Built-in features
- Laundry & utility: Washer; Dryer; Electric water heater; Laundry room (outside)
Neighborhood map
What this means for you Summary
Snapshot
- This is a 1-bed/1.0-bath manufactured listed at $75k.
Deal economics
- At list price, monthly cash flow is $482 ($6k/yr) — positive.
- The deal already cash-flows at list — no discount required.
- Meets the 1% rule at list price ($1k rent vs $75k).
- Recommended offer: $66k (12.0% below list) — sets the bar for market timing.
Location & tenants
- Location reads 70/100 on livability (#423 in FL) — a middle-class / working-renter tenant base. Strengths: crime A+, housing A+, health & safety A+; Watch: schools D+, employment D+, amenities F.
- Polk (suburban): math 39% / reading 43% proficiency, ranked #62 of 73 in FL (top 85%) — families likely to look elsewhere, expect single-tenant / working-renter base with shorter leases.
- Market conditions: Rents soft (-2.7%/yr); 1382 active listings in the ZIP; solid renter incomes; 10,384 units permitted in Polk County in 2024 (1,716 in 5+ unit buildings).
Forward outlook
- Local home prices are declining (-3.0%/yr); year-one equity from $519 of loan paydown is wiped out by about $2k of value loss. Plan a longer hold.
- Polk County population projected at +33% by 2050 — long-run rental-demand tailwind backs the buy-and-hold thesis.
- At projected returns (-3.0% appreciation + 0.0% rent growth), your $21k cash investment doubles in ~6 years — after that, you're playing with house money.
Negotiation context
- It's been on market 215 days — a 12% lower offer ($66k) is reasonable based on typical stale-listing flexibility.
- 6 sale attempts since 4y ago; this cycle's ask has dropped $40k (35%) from the opening price — seller is motivated, your offer sets the floor, not the list.
Risks & watch-outs
- Climate carrying-cost: severe wind risk, 99% chance of damaging wind over 30y; moderate wildfire risk; extreme-heat days projected 7→24/yr by 2055 (HVAC capex compounding) — expect insurance premiums to compound above CPI over the hold.
Questions for the listing agent
- It's been on market 215 days. Have you received any prior offers? Is the seller open to a 12% concession, seller financing, or rate buy-down credit?
- What does the HOA fee cover, when was the last increase, and are there any pending special assessments or reserve-fund shortfalls?
- Why hasn't it sold? Are there any deal-killer items the seller is aware of (foundation, flood, title, zoning, code violations)?
- Is there a deadline driving the sale (1031 exchange, divorce, estate, relocation)? That informs how much negotiation room exists.
- Schools are D-rated, which usually means shorter tenancies and higher turnover. Who's the typical renter profile here, and what's been the actual vacancy rate?
- What's the average days-on-market for RENTAL listings here right now (not sales)? A rising rental-DOM trend means longer vacancies and softer asking-rent achievability than the comps imply.
- What's the recent tenant-quality profile in this submarket — average credit score on applications, eviction rate, late-payment / NSF rate, and stable-employment percentage? A property-management company in the area should have these aggregated.
- How much new for-sale + rental construction is in the pipeline within 1–3 miles? Heavy new supply typically softens prices + rents 12–24 months out; constrained supply supports both.
Investment metrics
- 1% rule
- 1.81% ✓
- Cap rate
- 14.01%
- Cash-on-cash
- 27.56%
- DSCR
- 2.23
- GRM
- 4.6
CMA / ARV
No comps found within radius.
Projected returns pro-forma
-3.0% appreciation · 0.0% rent growth · sell at horizon
- IRR
- 18.0%
- Equity multiple
- 1.70×
- Total profit
- $14,660
- Equity at exit
- $11,183
- IRR
- 24.1%
- Equity multiple
- 2.77×
- Total profit
- $37,241
- Equity at exit
- $6,485
Cash invested: $21,000 (down + closing). Projections, not guarantees.
Landlord ↔ Tenant lean methodology
- Overall (STATE)
- 87 Strongly Landlord-Friendly
- State Florida
- 87 Strongly Landlord-Friendly · R+3
- County
- — inherits STATE
- City
- — inherits STATE
ZIP-level market 33837
- Home prices YoY
- -33.9%
- Rents YoY
- -2.7%
- Active inventory
- 1382
- Price-to-rent
- 4.6×
Monthly cashflow live
- Estimated rent
- $1,354 medium interval (Pro) →
- Mortgage (P&I)
- −$393
- Tax from tax record
- −$105 /mo · $1,259/yr
- Insurance
- −$31
- HOA
- −$58
- Vacancy / Maint / Mgmt
- −$284
- Net cashflow
- $482
Break-even live
UW: 25.0% down · 7.5% · 30yr · 1.5% tax · 5.0% vac · 8.0% maint · 8.0% mgmt
Financing live
Cash to close
- Down payment
- $18,750
- Closing costs
- $2,250
- Reserves months
- —
- Total cash needed
- —
Loan-product check · same deal, 3 products live
Conventional
25% down · 7.5% · 30yr
- Down + closing
- —
- Monthly P&I
- —
- Monthly cashflow
- —
- DSCR
- —
- Eligible?
- —
Personal DTI + credit; lowest rate.
DSCR
20% down · 8.5% · 30yr
- Down + closing
- —
- Monthly P&I
- —
- Monthly cashflow
- —
- DSCR
- —
- Eligible?
- —
No personal income docs; deal must DSCR.
Hard money
10% down · 12.0% · 12mo
- Down + closing
- —
- Monthly P&I
- —
- Monthly cashflow
- —
- DSCR
- —
- Eligible?
- —
Short-term bridge; refi at stabilization.
HOA detail
- Monthly dues
- $58 · $696/yr
- Likely covers
- water
Listing history 32 events
-
2026-06-18days on market $75,000 Active 215 DOM
-
2026-06-17price $75,000 Active 214 DOM
-
2026-06-17days on market $90,000 Active 214 DOM
-
2026-06-16days on market $90,000 Active 213 DOM
-
2026-06-15days on market $90,000 Active 212 DOM
-
2026-06-13days on market $90,000 Active 210 DOM
-
2026-06-10days on market $90,000 Active 207 DOM
-
2026-06-09days on market $90,000 Active 206 DOM
-
2026-06-08days on market $90,000 Active 205 DOM
-
2026-06-07days on market $90,000 Active 204 DOM
-
2026-06-05days on market $90,000 Active 201 DOM
-
2026-06-03days on market $90,000 Active 199 DOM
-
2026-06-01days on market $90,000 Active 198 DOM
-
2026-05-31days on market $90,000 Active 197 DOM
-
2026-01-21price $90,000
-
2025-11-15$115,000 Active
-
2025-01-15historical
-
2024-10-16$89,950 Active
-
2024-09-19historical
-
2024-07-17price $99,000
-
2024-05-22price $105,000
-
2024-04-24$110,000 Active
-
2024-04-08historical
-
2024-01-10$115,000 Active
-
2023-01-19soldstatus $75,000
-
2023-01-18soldstatus $75,000 Closed
-
2023-01-01status Pending
-
2022-12-28price $79,000
-
2022-11-30price $89,900
-
2022-07-07$95,000 Active
-
2022-07-05historical
-
2022-06-06$95,000 Active
ⓘ Source: listings_history table (triggers on properties + properties_extension) + one-shot
backfill from property_details.listing_events for pre-trigger history.
Tax reassessment forecast FL · Resets to sale price
- Current annual tax
- $1,259 · $105/mo
- Projected year-2 tax
- $1,259 · $105/mo
- Expected delta
- $0/yr ($0/mo · 0.0%)
ⓘ Screening estimate from a state-policy table — verify with the county assessor before closing.
Climate risk First Street
- Flood 1/10 Low FEMA zone X (unshaded) · 0% chance over 30 yrs
- Wildfire 5/10 Major
- Heat 8/10 Severe 7 d/yr ≥108°F today · 24 d/yr by 30 yrs out
- Wind 9/10 Extreme 99% chance of damaging wind over 30 yrs
- Air quality 1/10 Low 0 unhealthy d/yr today · 0 by 30 yrs out
Nearby sold comps map
Loading sold comps map…
Walkable amenities ~0.75 mi
Loading nearby amenities…
Taxation est. · year 1
- Rental income
- $16,250
- − Mortgage interest
- −$4,201
- − Property taxes
- −$1,259
- − Insurance
- −$375
- − Repairs & maintenance
- −$1,300
- − Management
- −$1,300
- − HOA
- −$696
- − Depreciation
- −$2,182
- Taxable income
- $4,937
- Est. tax owed @ 24.0%
- −$1,185
- After-tax cash flow
- $4,603/yr
For passive investors: Depreciation is non-cash, so a rental often shows a tax loss while cash-flowing — sheltering income. Rental losses are passive: they offset passive income freely, and up to $25,000/yr can offset ordinary (W-2) income if you actively participate and your MAGI is under $100k (phasing out to $0 by $150k); unused losses carry forward. On sale, claimed depreciation is recaptured at up to 25%, and gains may owe capital-gains tax (a 1031 exchange can defer both). Figures are a year-1 estimate at your 24.0% rate — not tax advice; consult a CPA.
Schools (NCES district)
- District
- Polk
- NCES district ID
- 1201590
- Math proficiency
- 39% ▼ -11.00%
- Reading proficiency
- 43% ▼ -4.00%
- Median HH income
- $43,979
- Composite
- 34.74/100
- National rank
- #5132
- State rank
- #62 of 73 in FL
Livability — Davenport
- Score
- 70/100
- State rank
- #423
- US rank
- #7541
Category grades
Schools grade is shown separately in the Schools card above.
Census & demographics
- Census place
- Davenport, FL
- County
- Polk County · 740,051 people
- City population
- 104,279
- Metro
- Lakeland-Winter Haven, FL
- Population (ZIP)
- 47,389
- Household income
- $81,276
- Rent vs Own
- Severe rent burden
- 424.0
Population outlook (Polk County) Hauer SSP2
- Today (2025)
- 752,975 people
- By 2030
- 804,621 · +6.9%
- By 2040
- 906,117 · +20.3%
- By 2050
- 1,000,476 · +32.9%
- By 2075
- 1,197,520 · +59.0%
- By 2100
- 1,271,518 · +68.9%
Race, ethnicity, and origin ACS 2023
- Neighborhood character
- Diverse neighborhood (Simpson 0.68)
- Race & ethnicity
- Hispanic / Latino 42% White 36% Two or more races 16% Black 15% Asian 2%
- Hispanic origin (detail)
- Mexican 7% Puerto Rican 22% Cuban 2% Dominican 1%
- Common ancestry
- Hispanic 5% Romanian 3% Lithuanian 1%
- Foreign-born
- 18% · Canada, Jamaica
- Languages at home
- 55% English-only · Spanish 35% French/Haitian/Cajun 6% Other Indo-European 2%
Political lean MEDSL · Polk
- 2024 margin
- Strong R (+20.7) · D 39.2% · R 59.9%
- 2008→2024 swing
- -14.6pp toward R · 2008: -6.1pp · 2024: -20.7pp
- All cycles
- 2024: R+20.7 2020: R+14.4 2016: R+14.1 2012: R+6.8 2008: R+6.1
Not yet ingested
- Civics
- —
Market trends
- HPI YoY
- ▼ -131.62%
- Current HPI
- 256.8165
- Rent YoY
- ▼ -2.73%
- Metro
- Lakeland-Winter Haven, FL
- State GDP YoY
- ▲ 3.28%
- F500 in state
- 36
Industry mix (Fortune 500 HQ in FL)
| Industry | F500 HQs | Revenue |
|---|---|---|
| Industrial Technology | 2 | $29B |
|
||
| Insurance | 2 | $17B |
|
||
| Retail | 1 | $60B |
|
||
| Technology Distribution | 1 | $58B |
|
||
| Homebuilding | 1 | $35B |
|
||
| Technology Manufacturing | 1 | $35B |
|
||
Price history
-5.3% since first listed18 events — show timeline
- 2026-01-21 Price Changed $90,000 Stellar MLS as Distributed by MLS Grid
- 2025-11-15 Listed $115,000 Stellar MLS as Distributed by MLS Grid
- 2025-01-15 Listing Removed — Stellar MLS as Distributed by MLS Grid
- 2024-10-16 Listed $89,950 Stellar MLS as Distributed by MLS Grid
- 2024-09-19 Listing Removed — Stellar MLS as Distributed by MLS Grid
- 2024-07-17 Price Changed $99,000 Stellar MLS as Distributed by MLS Grid
- 2024-05-22 Price Changed $105,000 Stellar MLS as Distributed by MLS Grid
- 2024-04-24 Listed $110,000 Stellar MLS as Distributed by MLS Grid
- 2024-04-08 Listing Removed — Stellar MLS as Distributed by MLS Grid
- 2024-01-10 Listed $115,000 Stellar MLS as Distributed by MLS Grid
- 2023-01-19 Sold (Public Records) $75,000 Public Records
- 2023-01-18 Sold (MLS) $75,000 Stellar MLS as Distributed by MLS Grid
- 2023-01-01 Pending — Stellar MLS as Distributed by MLS Grid
- 2022-12-28 Price Changed $79,000 Stellar MLS as Distributed by MLS Grid
- 2022-11-30 Price Changed $89,900 Stellar MLS as Distributed by MLS Grid
- 2022-07-07 Listed $95,000 Stellar MLS as Distributed by MLS Grid
- 2022-07-05 Listing Removed — Stellar MLS as Distributed by MLS Grid
- 2022-06-06 Listed $95,000 Stellar MLS as Distributed by MLS Grid
Property tax history
+5.8%/yrLatest (2025): $1,259 · +5.3% YoY. Source: county tax records.
Cash-flow waterfall
monthlySold comps — $/sqft
last 12 mo · ≤1 miLoading sold comps…