 Duplex
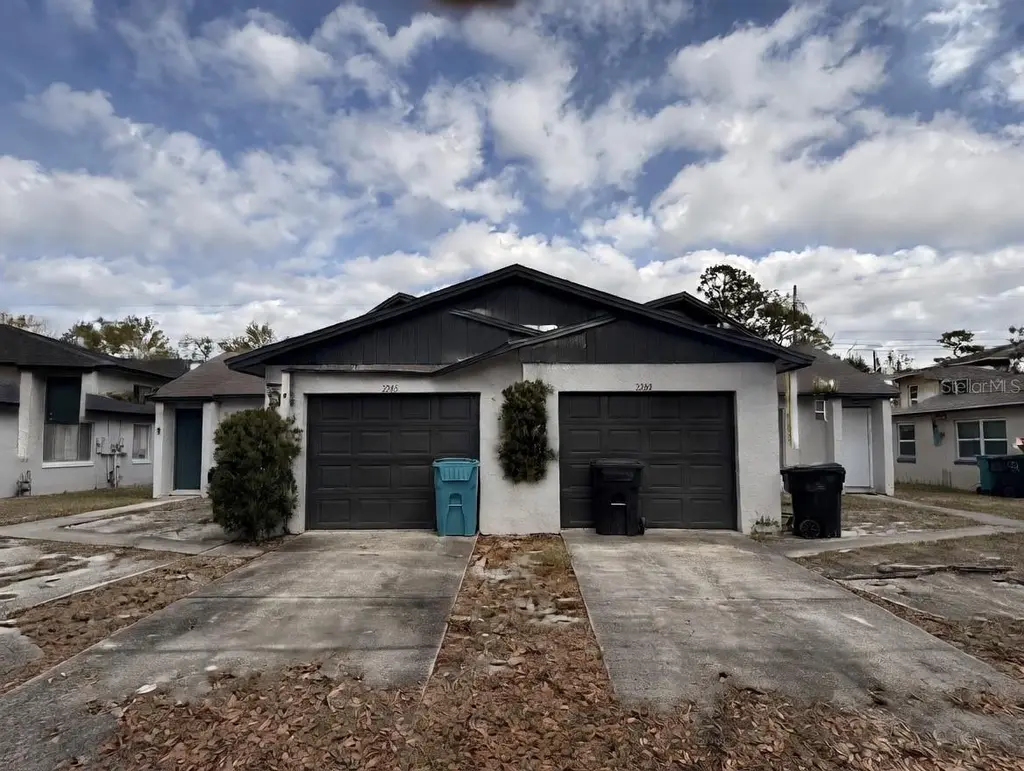
3243 & 3245 Split Willow Dr · Orlando, FL
Flood risk 1/10 · Minimal
- FEMA flood zone
- X (unshaded)
- Chance of flooding over 30 yrs
- 0.0%
- Est. flood insurance / yr
- $507 – $1,088
Fire risk 1/10 · Minimal
- Est. fire insurance / yr
- $947 – $1,759
Heat risk 9/10 · Severe
- Hot days now (above 108°F)
- 7 days/yr
- Hot days in 30 yrs
- 23 days/yr
Wind risk 9/10 · Severe
- Chance of severe wind over 30 yrs
- 99.0%
Air-quality risk 2/10 · Minimal
- Unhealthy air days now
- 0 days/yr
- Unhealthy air days in 30 yrs
- 1 days/yr
Risk factors via First Street. Map © Google.
Why this score? — see what drove the D- grade
The composite is a weighted blend of 9 inputs, each scored 0–100. Each bar is that input's sub-score; the figure is the points it added to the 100-point composite (weight × sub-score).
- Cash flow +12.1/30.0
- ARV discount +7.5/15.0
- Livability +4.3/5.0
- Schools +4.1/10.0
- DSCR +3.6/10.0
- 1% rule +3.5/10.0
- Rent growth +2.4/5.0
- Condition / age +2.2/5.0
- Appreciation +0.0/10.0
$375,000
🖨 Deal sheet 📄 Offer letter ✓ Due diligence
Multi-family units
County records classify this as Multi-Family (2-4 Unit). Listing-text estimate: 2 units. confirmed
Listing remarks MLS
This charming duplex is part of a portfolio featuring a total of 5 duplexes, adding up to 10 units in all. You have the option to purchase them individually or as a bundled package. This duplex features both units with 2 bedrooms, 2baths, and a 1-car garage. Currently, all the units are occupied by tenants, with rents varying from unit to unit, but market rent is estimated at $1,400/month. Investing in this opportunity ensures immediate rental income with stable tenants. Moreover, there's the potential for capital appreciation, and with some renovations, even greater upside potential. This is your chance to secure your financial future in a promising market. Contact us now for more details and make your move!
Key facts
- Functional layout
- 8,240 sq ft lot
- Garage
Tags
Neighborhood map
What this means for you Summary
Snapshot
- This is a 2 × 2-bed/2.0-bath units multifamily listed at $375k. Condition is rated fair.
Deal economics
- At list price, monthly cash flow is $-84 ($-1k/yr) — negative. Per door: $-42/mo.
- To cash-flow at today's rent, offer at most $363k (3.2% below list).
- To meet the 1% rule (rent ≥ 1% of price), the offer needs to be $317k (15.4% below list).
- Recommended offer: $317k (15.4% below list) — sets the bar for 1% rule.
- Cap rate 6.0% vs local median 3.0% in Orlando — top-decile yield for the area; either an underpriced asset or a hidden risk that comps aren't pricing in. Stress-test before assuming the spread holds.
Location & tenants
- Location reads 86/100 on livability (#12 in FL, #360 nationally) — a professional / high-income tenant draw. Strengths: amenities A+, commute A+, housing A+.
- Orange (suburban): math 46% / reading 51% proficiency, ranked #43 of 73 in FL (top 59%) — families likely to look elsewhere, expect single-tenant / working-renter base with shorter leases.
- Market conditions: Rents soft (-0.3%/yr); 246 active listings in the ZIP; 14 comparable units currently listed for rent nearby; rentals at typical pace (median 22d on market — plan ~3-4 weeks tenant-placement turnaround); 8,053 units permitted in Orange County in 2024 (3,133 in 5+ unit buildings).
- At $3,174/mo this rent would consume 77% of the median local household income ($50k/yr) (locally 4039% of renters already pay >50% of income on rent) — very limited rent-growth headroom before tenants either downsize or default.
Forward outlook
- Local home prices are declining (-3.0%/yr); year-one equity from $3k of loan paydown is wiped out by about $11k of value loss. Plan a longer hold.
- Orange County population projected at +52% by 2050 — long-run rental-demand tailwind backs the buy-and-hold thesis.
Negotiation context
- It's been on market 43 days — a 3% lower offer ($364k) is reasonable based on typical stale-listing flexibility.
- 2 sale attempts since 2y ago with the ask held roughly flat each time — persistent listings suggest the price (not the market) is what's stuck; bring a comps-based counter.
Risks & watch-outs
- Climate carrying-cost: severe wind risk, 99% chance of damaging wind over 30y; extreme-heat days projected 7→23/yr by 2055 (HVAC capex compounding) — expect insurance premiums to compound above CPI over the hold.
Questions for the listing agent
- What do current leases actually rent for vs. the listed asking? Can we see a recent rent roll and the last 12 months of T-12 income?
- It's been on market 43 days. Have you received any prior offers? Is the seller open to a 15% concession, seller financing, or rate buy-down credit?
- Can we see the unit-by-unit rent roll, current vacancy, and any below-market leases? What's the average tenancy length?
- What capital expenditures (roof, boiler, parking lot, exteriors) have been made in the last 5 years, and what's planned in the next 2?
- Have any recent inspections been done? Can we get a copy of the seller's disclosures and any deferred-maintenance estimates?
- Is there a deadline driving the sale (1031 exchange, divorce, estate, relocation)? That informs how much negotiation room exists.
- Schools are B-rated — typically a magnet for longer-tenancy family renters. What's the average tenant stay here, and is there a school-zone premium baked into asking?
- The area grade is low — what's the realistic commute time and amenity access for the typical tenant pool here? Any planned neighborhood developments (good or bad) we should know about?
- What's the average days-on-market for RENTAL listings here right now (not sales)? A rising rental-DOM trend means longer vacancies and softer asking-rent achievability than the comps imply.
- What's the recent tenant-quality profile in this submarket — average credit score on applications, eviction rate, late-payment / NSF rate, and stable-employment percentage? A property-management company in the area should have these aggregated.
- How much new apartment / multifamily construction is in the pipeline within 1–3 miles? Heavy new supply (>2% of stock underway) typically softens rents 12–24 months out; light construction supports rent growth.
Investment metrics
- 1% rule
- 0.85% ✗
- Cap rate
- 6.02%
- Cash-on-cash
- -0.96%
- DSCR
- 0.96
- GRM
- 9.8
CMA / ARV
No comps found within radius.
Projected returns pro-forma
-3.0% appreciation · 0.0% rent growth · sell at horizon
- IRR
- -21.3%
- Equity multiple
- 0.28×
- Total profit
- $-75,375
- Equity at exit
- $55,914
- IRR
- -24.0%
- Equity multiple
- -0.03×
- Total profit
- $-108,284
- Equity at exit
- $32,423
Cash invested: $105,000 (down + closing). Projections, not guarantees.
Landlord ↔ Tenant lean methodology
- Overall (STATE)
- 87 Strongly Landlord-Friendly
- State Florida
- 87 Strongly Landlord-Friendly · R+3
- County
- — inherits STATE
- City
- — inherits STATE
ZIP-level market 32808
- Home prices YoY
- -22.6%
- Rents YoY
- -0.3%
- Active inventory
- 246
- Price-to-rent
- 19.7×
Monthly cashflow live
- Estimated rent
- $3,174 high interval (Pro) →
- Mortgage (P&I)
- −$1,967
- Tax est. 1.5%
- −$469 /mo · $5,625/yr
- Insurance
- −$156
- HOA
- −$0
- Vacancy / Maint / Mgmt
- −$667
- Net cashflow
- $-84
Break-even live
2-unit breakdown (identical units grouped — click to expand)
| Units | Beds | Baths | Est. rent |
|---|---|---|---|
| 2× units | 2 | 2 | $3,174 |
| #1 | 2 | 2 | $1,587 |
| #2 | 2 | 2 | $1,587 |
| Total (2 units) | $3,174 | ||
UW: 25.0% down · 7.5% · 30yr · 1.5% tax · 5.0% vac · 8.0% maint · 8.0% mgmt
Financing live
Cash to close
- Down payment
- $93,750
- Closing costs
- $11,250
- Reserves months
- —
- Total cash needed
- —
Loan-product check · same deal, 3 products live
Conventional
25% down · 7.5% · 30yr
- Down + closing
- —
- Monthly P&I
- —
- Monthly cashflow
- —
- DSCR
- —
- Eligible?
- —
Personal DTI + credit; lowest rate.
DSCR
20% down · 8.5% · 30yr
- Down + closing
- —
- Monthly P&I
- —
- Monthly cashflow
- —
- DSCR
- —
- Eligible?
- —
No personal income docs; deal must DSCR.
Hard money
10% down · 12.0% · 12mo
- Down + closing
- —
- Monthly P&I
- —
- Monthly cashflow
- —
- DSCR
- —
- Eligible?
- —
Short-term bridge; refi at stabilization.
Rent comps 14 comps
| Address | Beds | Baths | Sqft | Rent | $/sqft | DOM | Units | Dist |
|---|---|---|---|---|---|---|---|---|
| 4751 Beacon St Orlando, FL | 4.0 | 2.0 | 1624 | $2,500 | $1.54 | 7d | 1 | 0.53mi |
| 3903 Pine Ridge Rd Orlando, FL | 4.0 | 1.5 | 1450 | $1,949 | $1.34 | 24d | 1 | 0.73mi |
| 4566 Chateau Rd Orlando, FL | 3.0 | 1.5 | 1377 | $1,800 | $1.31 | 24d | 1 | 0.80mi |
| 5717 Fernhill Dr Orlando, FL | 3.0 | 1.0 | 1619 | $1,700 | $1.05 | 3d | 1 | 0.88mi |
| 4148 Player Cir #106 Orlando, FL | 4.0 | 3.0 | 1634 | $2,350 | $1.44 | 24d | 1 | 0.94mi |
| 2222 Silver Pines Pl #902 Orlando, FL | 3.0 | 2.5 | 1472 | $1,500 | $1.02 | 7d | 1 | 1.02mi |
| 4918 Silver Oaks Village Unit F Orlando, FL | 3.0 | 3.0 | 1260 | $1,750 | $1.39 | 24d | 1 | 1.15mi |
| 4966 Sanoma Village Unit D Orlando, FL | 3.0 | 1.5 | 1252 | $1,650 | $1.32 | 7d | 1 | 1.16mi |
| 3402 Bretwood Dr Orlando, FL | 4.0 | 2.0 | 1936 | $2,500 | $1.29 | 22d | 1 | 1.31mi |
| 3520 Seneca Club Loop Unit 51-102 Orlando, FL | 3.0 | 2.5 | 1461 | $2,295 | $1.57 | 1d | 1 | 1.33mi |
| 5061 Barnegat Point Rd Orlando, FL | 4.0 | 2.0 | 1712 | $2,400 | $1.40 | 22d | 1 | 1.33mi |
| 4006 Luan Dr Orlando, FL | 3.0 | 2.0 | 1717 | $2,095 | $1.22 | 24d | 1 | 1.36mi |
| 3308 Azolla St Orlando, FL | 3.0 | 2.0 | 1438 | $2,200 | $1.53 | 24d | 1 | 1.39mi |
| 1213 Roger Babson Rd Unit 1 Orlando, FL | 4.0 | 2.0 | 1380 | $2,499 | $1.81 | 7d | 1 | 1.48mi |
Listing history 5 events
-
2026-04-28status Pending
-
2026-03-16$375,000 Active
-
2024-03-07soldstatus $328,215 Closed 718-char remark
Show marketing remark (718 chars)
This charming duplex is part of a portfolio featuring a total of 5 duplexes, adding up to 10 units in all. You have the option to purchase them individually or as a bundled package. This duplex features both units with 2 bedrooms, 2baths, and a 1-car garage. Currently, all the units are occupied by tenants, with rents varying from unit to unit, but market rent is estimated at $1,400/month. Investing in this opportunity ensures immediate rental income with stable tenants. Moreover, there's the potential for capital appreciation, and with some renovations, even greater upside potential. This is your chance to secure your financial future in a promising market. Contact us now for more details and make your move!
-
2024-02-10$350,000 718-char remark
Show marketing remark (718 chars)
This charming duplex is part of a portfolio featuring a total of 5 duplexes, adding up to 10 units in all. You have the option to purchase them individually or as a bundled package. This duplex features both units with 2 bedrooms, 2baths, and a 1-car garage. Currently, all the units are occupied by tenants, with rents varying from unit to unit, but market rent is estimated at $1,400/month. Investing in this opportunity ensures immediate rental income with stable tenants. Moreover, there's the potential for capital appreciation, and with some renovations, even greater upside potential. This is your chance to secure your financial future in a promising market. Contact us now for more details and make your move!
-
2024-02-10historical 718-char remark
Show marketing remark (718 chars)
This charming duplex is part of a portfolio featuring a total of 5 duplexes, adding up to 10 units in all. You have the option to purchase them individually or as a bundled package. This duplex features both units with 2 bedrooms, 2baths, and a 1-car garage. Currently, all the units are occupied by tenants, with rents varying from unit to unit, but market rent is estimated at $1,400/month. Investing in this opportunity ensures immediate rental income with stable tenants. Moreover, there's the potential for capital appreciation, and with some renovations, even greater upside potential. This is your chance to secure your financial future in a promising market. Contact us now for more details and make your move!
ⓘ Source: listings_history table (triggers on properties + properties_extension) + one-shot
backfill from property_details.listing_events for pre-trigger history.
Climate risk First Street
- Flood 1/10 Low FEMA zone X (unshaded) · 0% chance over 30 yrs
- Wildfire 1/10 Low
- Heat 9/10 Extreme 7 d/yr ≥108°F today · 23 d/yr by 30 yrs out
- Wind 9/10 Extreme 99% chance of damaging wind over 30 yrs
- Air quality 2/10 Low 0 unhealthy d/yr today · 1 by 30 yrs out
Nearby sold comps map
Loading sold comps map…
Walkable amenities ~0.75 mi
Loading nearby amenities…
Taxation est. · year 1
- Rental income
- $38,088
- − Mortgage interest
- −$21,006
- − Property taxes
- −$5,625
- − Insurance
- −$1,875
- − Repairs & maintenance
- −$3,047
- − Management
- −$3,047
- − Depreciation
- −$10,909
- Taxable loss
- −$7,421
- Est. tax savings @ 24.0%
- +$1,781
- After-tax cash flow
- $772/yr
For passive investors: Depreciation is non-cash, so a rental often shows a tax loss while cash-flowing — sheltering income. Rental losses are passive: they offset passive income freely, and up to $25,000/yr can offset ordinary (W-2) income if you actively participate and your MAGI is under $100k (phasing out to $0 by $150k); unused losses carry forward. On sale, claimed depreciation is recaptured at up to 25%, and gains may owe capital-gains tax (a 1031 exchange can defer both). Figures are a year-1 estimate at your 24.0% rate — not tax advice; consult a CPA.
Condition & rehab AI · 2 photos
This two-unit property requires moderate renovations to address exterior issues and improve curb appeal, enhancing both resale and rental value.
Repairs flagged
- Major roof — Signs of wear and potential leaks
- Major siding — Worn and peeling
- Major landscaping — Overgrown and unkempt
Value-add opportunities
- Both paint exterior — Fresh paint enhances curb appeal and value
- Both repair roof — Fixing the roof prevents leaks and extends the home's lifespan
- Both landscape — A well-maintained yard improves curb appeal and rental value
Renovation cost estimate screening
| Repair item | Severity | Est. cost |
|---|---|---|
| roof · Signs of wear and potential leaks | Major | $15,000–50,000 |
| siding · Worn and peeling | Major | $15,000–50,000 |
| landscaping · Overgrown and unkempt | Major | $15,000–50,000 |
| Total estimated repair cost · 3 items | $45,000–150,000 |
Value-add ROI direction
- Both paint exterior — Fresh paint enhances curb appeal and value ↑
- Both repair roof — Fixing the roof prevents leaks and extends the home's lifespan ↑
- Both landscape — A well-maintained yard improves curb appeal and rental value ↑
ⓘ Cost ranges are severity-bucket heuristics (US national rule-of-thumb). Get contractor quotes + a written scope before underwriting a rehab budget.
Schools (NCES district)
- District
- Orange
- NCES district ID
- 1201440
- Math proficiency
- 46% ▼ -9.00%
- Reading proficiency
- 51% ▼ -2.00%
- Median HH income
- $49,350
- Composite
- 41.47/100
- National rank
- #3461
- State rank
- #43 of 73 in FL
Livability — Orlando
- Score
- 86/100
- State rank
- #12
- US rank
- #360
Category grades
Schools grade is shown separately in the Schools card above.
Census & demographics
- Census place
- Orlando, FL
- County
- Orange County · 1,471,359 people
- City population
- 964,969
- Metro
- Orlando-Kissimmee-Sanford, FL
- Population (ZIP)
- 60,203
- Household income
- $49,700
- Rent vs Own
- Severe rent burden
- 4039.0
Population outlook (Orange County) Hauer SSP2
- Today (2025)
- 1,618,226 people
- By 2030
- 1,787,404 · +10.5%
- By 2040
- 2,125,621 · +31.4%
- By 2050
- 2,454,016 · +51.6%
- By 2075
- 3,173,711 · +96.1%
- By 2100
- 3,607,781 · +122.9%
Race, ethnicity, and origin ACS 2023
- Neighborhood character
- Predominantly Black (71%)
- Race & ethnicity
- Black 71% Hispanic / Latino 13% White 10% Two or more races 7% Asian 1%
- Hispanic origin (detail)
- Mexican 2% Puerto Rican 5% Dominican 2%
- Common ancestry
- Hispanic 20% Lithuanian 1% Scandinavian 0%
- Foreign-born
- 25% · Canada, Vietnam, Jamaica
- Languages at home
- 69% English-only · French/Haitian/Cajun 18% Spanish 11% Other Indo-European 1%
Political lean MEDSL · Orange
- 2024 margin
- D (+13.6) · D 56.1% · R 42.5% · Other 1.3%
- 2008→2024 swing
- -5.0pp toward R · 2008: 18.6pp · 2024: 13.6pp
- All cycles
- 2024: D+13.6 2020: D+23.1 2016: D+24.6 2012: D+18.2 2008: D+18.6
Not yet ingested
- Civics
- —
Market trends
- HPI YoY
- ▼ -110.15%
- Current HPI
- 376.3801
- Rent YoY
- ▼ -0.27%
- Metro
- Orlando-Kissimmee-Sanford, FL
- State GDP YoY
- ▲ 3.28%
- F500 in state
- 36
Industry mix (Fortune 500 HQ in FL)
| Industry | F500 HQs | Revenue |
|---|---|---|
| Industrial Technology | 2 | $29B |
|
||
| Insurance | 2 | $17B |
|
||
| Retail | 1 | $60B |
|
||
| Technology Distribution | 1 | $58B |
|
||
| Homebuilding | 1 | $35B |
|
||
| Technology Manufacturing | 1 | $35B |
|
||
Price history
+7.1% since first listed5 events — show timeline
- 2026-04-28 Pending — Stellar MLS as Distributed by MLS Grid
- 2026-03-16 Listed $375,000 Stellar MLS as Distributed by MLS Grid
- 2024-03-07 Sold (MLS) $328,215 Stellar MLS as Distributed by MLS Grid
- 2024-02-10 Listing Removed — Stellar MLS as Distributed by MLS Grid
- 2024-02-10 Listed $350,000 Stellar MLS as Distributed by MLS Grid
Cash-flow waterfall
monthlySold comps — $/sqft
last 12 mo · ≤1 miLoading sold comps…