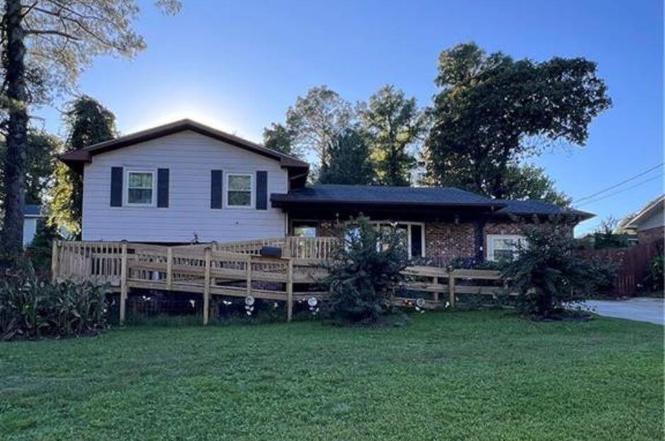
4642 Cheltenham Rd · Fayetteville, NC
Flood risk 1/10 · Minimal
- FEMA flood zone
- X (unshaded)
- Chance of flooding over 30 yrs
- 0.0%
- Est. flood insurance / yr
- $473 – $860
Fire risk 4/10 · Minor
- Est. fire insurance / yr
- $906 – $1,684
Heat risk 7/10 · Major
- Hot days now (above 106°F)
- 7 days/yr
- Hot days in 30 yrs
- 16 days/yr
Wind risk 6/10 · Moderate
- Chance of severe wind over 30 yrs
- 74.0%
Air-quality risk 1/10 · Minimal
- Unhealthy air days now
- 0 days/yr
- Unhealthy air days in 30 yrs
- 0 days/yr
Risk factors via First Street. Map © Google.
Why this score? — see what drove the D grade
The composite is a weighted blend of 9 inputs, each scored 0–100. Each bar is that input's sub-score; the figure is the points it added to the 100-point composite (weight × sub-score).
- ARV discount +12.4/15.0
- Cash flow +9.6/30.0
- Livability +3.8/5.0
- Rent growth +3.3/5.0
- Schools +3.1/10.0
- 1% rule +2.7/10.0
- DSCR +2.7/10.0
- Condition / age +2.5/5.0
- Appreciation +0.0/10.0
$205,000
🖨 Deal sheet 📄 Offer letter ✓ Due diligence
Listing remarks
Welcome to this versatile tri-level home in the heart of Fayetteville, designed for comfort, accessibility, and flexible living. Featuring 4 bedrooms, 3 full bathrooms. 4th bedroom could serve as a in-law suite complete with private entrance and full bath, or flex room that could serve as a office, or guest space, this home offers a layout that adapts to your lifestyle. Floor plan will be added soon! Recent updates include an approx. 1-year-old AC unit, heat pump, and water heater!Roof and windows replaced approximately 10 years ago--giving you peace of mind for years to come. The home features a mix of hardwood and carpeted flooring, blending warmth and durability throughout. Accessibilit
Key facts
- Public sewer
- In law suite
- Private entrance
Tags
Property features AI
Finance
- Other: Accessible approach with ramp, accessible entrance, accessible bedroom and full bath; Zoned residential; Lot approximately 0.27 acres; City street frontage on a public, asphalt road; Living area reported as 2,030
- HOA & community: No homeowners association; No community amenities
Exterior
- Parking: Parking for 4 vehicles; Concrete and paved parking surfaces
- Utilities: Public water; Public sewer; Cable available
- Home design: Site-built house; Tri-level (two levels listed)
- Construction: Brick and wood siding exterior; Composition/shingle roof; Combination foundation with pillar/post/pier
- Exterior features: Enclosed and screened porch/patio; Garden
Interior
- Kitchen: Electric range; Gas/electric range (Range); Microwave
- Bedrooms: 4 bedrooms total; 1 bedroom on the main level
- Flooring: Carpet; Hardwood; Vinyl
- Bathrooms: 3 full bathrooms
- Heating & cooling: Electric heating; Heat pump; Central air; Ceiling fans
- Interior features: Fireplace (Den) with an outdoor fire pit; Sliding doors; See remarks
- Laundry & utility: Laundry on lower level
Neighborhood map
What this means for you Summary
Snapshot
- This is a 3-bed/4.0-bath single-family listed at $205k.
Deal economics
- At list price, monthly cash flow is $-139 ($-2k/yr) — negative.
- To cash-flow at today's rent, offer at most $180k (12.0% below list).
- To meet the 1% rule (rent ≥ 1% of price), the offer needs to be $158k (22.8% below list).
- Recommended offer: $158k (22.8% below list) — sets the bar for 1% rule.
Location & tenants
- Location reads 75/100 on livability (#45 in NC, #4,031 nationally) — a middle-class / working-renter tenant base. Strengths: commute A+, cost of living A+, housing A+; Watch: schools C-, crime F, employment D-.
- Cumberland County Schools (urban): math 32% / reading 41% proficiency, ranked #126 of 178 in NC (top 71%) — families likely to look elsewhere, expect single-tenant / working-renter base with shorter leases.
- Market conditions: Rents rising (+3.2%/yr); 302 active listings in the ZIP; 31 comparable units currently listed for rent nearby; rentals at typical pace (median 24d on market — plan ~3-4 weeks tenant-placement turnaround); 1,125 units permitted in Cumberland County in 2024 (104 in 5+ unit buildings).
- This rent runs 32% of the median local income ($59k/yr) — at the standard rent-burdened threshold; future hikes will face affordability resistance.
Forward outlook
- Local home prices are declining (-3.0%/yr); year-one equity from $1k of loan paydown is wiped out by about $6k of value loss. Plan a longer hold.
Negotiation context
- It's been on market 209 days — a 12% lower offer ($180k) is reasonable based on typical stale-listing flexibility.
- 3 sale attempts since 2y ago; this cycle's ask has dropped $20k (9%) from the opening price — seller is motivated, your offer sets the floor, not the list.
- Current owner paid $64k; list at $205k implies a 223% gain — meaningful room to come down on a strong offer.
Risks & watch-outs
- Climate carrying-cost: major wind risk, 74% chance of damaging wind over 30y; extreme-heat days projected 7→16/yr by 2055 (HVAC capex compounding) — expect insurance premiums to compound above CPI over the hold.
Questions for the listing agent
- What do current leases actually rent for vs. the listed asking? Can we see a recent rent roll and the last 12 months of T-12 income?
- It's been on market 209 days. Have you received any prior offers? Is the seller open to a 23% concession, seller financing, or rate buy-down credit?
- Built in 1965 — when were the roof, HVAC, electrical panel, plumbing, and water heater last replaced?
- Why hasn't it sold? Are there any deal-killer items the seller is aware of (foundation, flood, title, zoning, code violations)?
- Is there a deadline driving the sale (1031 exchange, divorce, estate, relocation)? That informs how much negotiation room exists.
- Crime grade is F in this area — have there been break-ins, vandalism, or insurance claims at this property in the last 3 years? What carrier currently insures it and at what premium?
- The area grade is low — what's the realistic commute time and amenity access for the typical tenant pool here? Any planned neighborhood developments (good or bad) we should know about?
- What's the average days-on-market for RENTAL listings here right now (not sales)? A rising rental-DOM trend means longer vacancies and softer asking-rent achievability than the comps imply.
- What's the recent tenant-quality profile in this submarket — average credit score on applications, eviction rate, late-payment / NSF rate, and stable-employment percentage? A property-management company in the area should have these aggregated.
- How much new for-sale + rental construction is in the pipeline within 1–3 miles? Heavy new supply typically softens prices + rents 12–24 months out; constrained supply supports both.
Investment metrics
- 1% rule
- 0.77% ✗
- Cap rate
- 5.48%
- Cash-on-cash
- -2.91%
- DSCR
- 0.87
- GRM
- 10.8
CMA / ARV
- ARV (on-the-fly)
- $230,175
- Comps found
- 12
Show comp detail 12 sales within ~0.75 mi
| Address | Dist | Beds/Ba | Sqft | Sold | Price | $/sf | Match |
|---|---|---|---|---|---|---|---|
| 4642 Ashton Rd | 0.14mi | 3/2.5 | 1,718 (+1%) | 10mo | $245,000 | $143 | 78 |
| 1776 Inverness Dr | 0.20mi | 3/2.0 | 1,707 (+0%) | 11mo | $140,000 | $82 | 73 |
| 4627 Cheltenham Rd | 0.06mi | 4/2.5 (+1) | 1,568 (-8%) | 0mo | $228,000 | $145 | 72 |
| 1926 Martindale Dr | 0.26mi | 3/2.0 | 1,863 (+9%) | 11mo | $218,000 | $117 | 55 |
| 1933 Saint Paul Ave | 0.37mi | 4/2.0 (+1) | 1,610 (-6%) | 6mo | $130,000 | $81 | 55 |
| 1930 Alder Rd | 0.47mi | 4/2.0 (+1) | 1,818 (+7%) | 5mo | $240,000 | $132 | 50 |
| 5425 S Sumac Cir | 0.68mi | 3/2.0 | 1,668 (-2%) | 9mo | $224,900 | $135 | 49 |
| 4787 Friar Ave | 0.68mi | 3/2.0 | 1,808 (+6%) | 9mo | $197,000 | $109 | 42 |
| 2169 Quailridge Dr | 0.75mi | 4/2.0 (+1) | 1,666 (-2%) | 12mo | $229,000 | $137 | 38 |
| 5409 S Sumac Cir | 0.74mi | 3/2.0 | 1,840 (+8%) | 9mo | $244,000 | $133 | 37 |
| 4312 Wavetree Dr | 0.67mi | 4/2.0 (+1) | 1,902 (+12%) | 3mo | $325,000 | $171 | 34 |
| 1803 Saint Paul Ave | 0.59mi | 4/2.0 (+1) | 1,519 (-11%) | 11mo | $224,000 | $147 | 32 |
Match score weights: distance 35% · size 25% · config 20% · recency 20%. Top-matched comps best support the ARV.
Projected returns pro-forma
-3.0% appreciation · 3.17% rent growth · sell at horizon
- IRR
- -21.0%
- Equity multiple
- 0.27×
- Total profit
- $-41,809
- Equity at exit
- $30,566
- IRR
- -14.0%
- Equity multiple
- 0.19×
- Total profit
- $-46,679
- Equity at exit
- $17,725
Cash invested: $57,400 (down + closing). Projections, not guarantees.
Landlord ↔ Tenant lean methodology
- Overall (STATE)
- 85 Strongly Landlord-Friendly
- State North Carolina
- 85 Strongly Landlord-Friendly · R+3
- County
- — inherits STATE
- City
- — inherits STATE
ZIP-level market 28304
- Home prices YoY
- -21.7%
- Rents YoY
- 3.2%
- Active inventory
- 302
- Price-to-rent
- 10.8×
Monthly cashflow live
- Estimated rent
- $1,583 high interval (Pro) →
- Mortgage (P&I)
- −$1,075
- Tax from tax record
- −$230 /mo · $2,754/yr
- Insurance
- −$85
- HOA
- −$0
- Vacancy / Maint / Mgmt
- −$332
- Net cashflow
- $-139
Break-even live
UW: 25.0% down · 7.5% · 30yr · 1.5% tax · 5.0% vac · 8.0% maint · 8.0% mgmt
Financing live
Cash to close
- Down payment
- $51,250
- Closing costs
- $6,150
- Reserves months
- —
- Total cash needed
- —
Loan-product check · same deal, 3 products live
Conventional
25% down · 7.5% · 30yr
- Down + closing
- —
- Monthly P&I
- —
- Monthly cashflow
- —
- DSCR
- —
- Eligible?
- —
Personal DTI + credit; lowest rate.
DSCR
20% down · 8.5% · 30yr
- Down + closing
- —
- Monthly P&I
- —
- Monthly cashflow
- —
- DSCR
- —
- Eligible?
- —
No personal income docs; deal must DSCR.
Hard money
10% down · 12.0% · 12mo
- Down + closing
- —
- Monthly P&I
- —
- Monthly cashflow
- —
- DSCR
- —
- Eligible?
- —
Short-term bridge; refi at stabilization.
Rent comps 31 comps
| Address | Beds | Baths | Sqft | Rent | $/sqft | DOM | Units | Dist |
|---|---|---|---|---|---|---|---|---|
| 1819 Cawdor Dr Fayetteville, NC | 3.0 | 2.5 | 1572 | $1,600 | $1.02 | 13d | 1 | 0.28mi |
| 4101 Coventry Rd Fayetteville, NC | 3.0 | 1.0 | 1132 | $1,150 | $1.02 | 13d | 1 | 0.51mi |
| 4630 Canterbury Rd Fayetteville, NC | 3.0 | 2.0 | 1250 | $1,350 | $1.08 | 23d | 1 | 0.57mi |
| 5032 Shimmer Dr Fayetteville, NC | 4.0 | 2.0 | 1473 | $1,750 | $1.19 | 23d | 1 | 0.85mi |
| 5032 Shimmer Dr Fayetteville, NC | 4.0 | 2.0 | 1473 | $1,700 | $1.15 | 13d | 1 | 0.85mi |
| 4909 Walnut Dr Fayetteville, NC | 3.0 | 2.0 | 1188 | $1,500 | $1.26 | 23d | 1 | 0.86mi |
| 909 Sandalwood Dr Fayetteville, NC | 3.0 | 1.0 | 1346 | $1,595 | $1.18 | 23d | 1 | 0.88mi |
| 821 Sandalwood Dr Fayetteville, NC | 3.0 | 1.0 | 1204 | $1,200 | $1.00 | 13d | 1 | 0.88mi |
| 5632 Birch Rd Fayetteville, NC | 3.0 | 1.0 | 1228 | $1,250 | $1.02 | 23d | 1 | 0.92mi |
| 3526 Furman Dr Fayetteville, NC | 3.0 | 1.5 | 1050 | $1,500 | $1.43 | 23d | 1 | 1.00mi |
| 600 Faison Ave Fayetteville, NC | 3.0 | 2.0 | 1802 | $1,495 | $0.83 | 23d | 1 | 1.09mi |
| 4810 Alamance Rd Fayetteville, NC | 1.0–2.0 | 1.0–2.0 | 827 | $1,200 | $1.45 | 23d | 1 | 1.11mi |
| 5200 Cypress Rd Fayetteville, NC | 3.0 | 1.0 | 1210 | $1,250 | $1.03 | 23d | 1 | 1.11mi |
| 5151 Queensdale Dr Fayetteville, NC | 3.0 | 2.0 | 1107 | $1,295 | $1.17 | 23d | 1 | 1.15mi |
| 5151 Queensdale Dr Fayetteville, NC | 3.0 | 2.0 | 1107 | $1,295 | $1.17 | 13d | 1 | 1.15mi |
| 395 Hicks Ave Fayetteville, NC | 3.0 | 2.5 | 1519 | $1,550 | $1.02 | 23d | 1 | 1.19mi |
| 1828 Paisley Ave Fayetteville, NC | 3.0 | 2.5 | 1886 | $1,950 | $1.03 | 13d | 1 | 1.22mi |
| 3325 Boone Trl Fayetteville, NC | 4.0 | 2.0 | 1494 | $1,960 | $1.31 | 13d | 1 | 1.22mi |
| 400 Roxie Ave Fayetteville, NC | 2.0 | 2.0 | 1162 | $1,700 | $1.46 | 13d | 1 | 1.27mi |
| 1815 Paisley Ave Fayetteville, NC | 3.0 | 2.0 | 1508 | $1,595 | $1.06 | 23d | 1 | 1.30mi |
| 5721 Randleman St Fayetteville, NC | 3.0 | 2.0 | 1050 | $1,575 | $1.50 | 23d | 1 | 1.31mi |
| 2524 Penny Dr Fayetteville, NC | 3.0 | 2.0 | 1330 | $1,400 | $1.05 | 23d | 1 | 1.32mi |
| 1401 Carnsmore Dr Fayetteville, NC | 3.0 | 2.5 | 1450 | $1,575 | $1.09 | 23d | 1 | 1.34mi |
| 5744 Randleman St Fayetteville, NC | 3.0 | 2.0 | 1171 | $1,395 | $1.19 | 23d | 1 | 1.37mi |
| 2690 Belhaven Rd Fayetteville, NC | 3.0 | 1.0 | 1264 | $1,350 | $1.07 | 23d | 1 | 1.38mi |
| 5706 McDougal Dr Fayetteville, NC | 3.0 | 2.0 | 1594 | $1,650 | $1.04 | 23d | 1 | 1.42mi |
| 5532 Robmont Dr Fayetteville, NC | 2.0 | 2.0 | 1301 | $1,800 | $1.38 | 13d | 1 | 1.43mi |
| 1583 Winnabow Dr Fayetteville, NC | 3.0 | 2.5 | 1550 | $2,100 | $1.35 | 23d | 1 | 1.44mi |
| 3120 Phillies Cir Fayetteville, NC | 3.0 | 1.5 | 1418 | $1,650 | $1.16 | 21d | 1 | 1.47mi |
| 5864 Aftonshire Dr Fayetteville, NC | 2.0 | 2.0 | 1100 | $1,100 | $1.00 | 23d | 1 | 1.49mi |
| 2207 Puffin Pl Fayetteville, NC | 3.0 | 2.0 | 1214 | $1,950 | $1.61 | 13d | 1 | 1.50mi |
Listing history 26 events
-
2026-06-18days on market $205,000 Active 209 DOM
-
2026-06-17days on market $205,000 Active 208 DOM
-
2026-06-16days on market $205,000 Active 207 DOM
-
2026-06-15days on market $205,000 Active 206 DOM
-
2026-06-14days on market $205,000 Active 204 DOM
-
2026-06-13days on market $205,000 Active 203 DOM
-
2026-06-10days on market $205,000 Active 201 DOM
-
2026-06-09days on market $205,000 Active 200 DOM
-
2026-06-08days on market $205,000 Active 199 DOM
-
2026-06-07days on market $205,000 Active 198 DOM
-
2026-06-03days on market $205,000 Active 194 DOM
-
2026-06-02days on market $205,000 Active 193 DOM
-
2026-06-01days on market $205,000 Active 192 DOM
-
2026-05-31days on market $205,000 Active 191 DOM
-
2026-05-30days on market $205,000 Active 190 DOM
-
2026-04-28price $205,000
-
2026-02-27price $214,900
-
2025-11-12$224,900 Active
-
2025-09-17$224,999 Active
-
2025-06-07price $240,000
-
2025-05-21price $250,000
-
2025-04-26price $255,000
-
2025-03-04price $260,000
-
2024-11-22price $280,000
-
2024-10-10$285,000 Active
-
1986-08-13soldstatus $63,500
ⓘ Source: listings_history table (triggers on properties + properties_extension) + one-shot
backfill from property_details.listing_events for pre-trigger history.
Tax reassessment forecast NC · Resets to sale price
- Current annual tax
- $2,754 · $230/mo
- Projected year-2 tax
- $2,754 · $230/mo
- Expected delta
- $0/yr ($0/mo · 0.0%)
ⓘ Screening estimate from a state-policy table — verify with the county assessor before closing.
Climate risk First Street
- Flood 1/10 Low FEMA zone X (unshaded) · 0% chance over 30 yrs
- Wildfire 4/10 Moderate
- Heat 7/10 Severe 7 d/yr ≥106°F today · 16 d/yr by 30 yrs out
- Wind 6/10 Major 74% chance of damaging wind over 30 yrs
- Air quality 1/10 Low 0 unhealthy d/yr today · 0 by 30 yrs out
Nearby sold comps map
Loading sold comps map…
Walkable amenities ~0.75 mi
Loading nearby amenities…
Taxation est. · year 1
- Rental income
- $18,998
- − Mortgage interest
- −$11,483
- − Property taxes
- −$2,754
- − Insurance
- −$1,025
- − Repairs & maintenance
- −$1,520
- − Management
- −$1,520
- − Depreciation
- −$5,964
- Taxable loss
- −$5,267
- Est. tax savings @ 24.0%
- +$1,264
- After-tax cash flow
- $-407/yr
For passive investors: Depreciation is non-cash, so a rental often shows a tax loss while cash-flowing — sheltering income. Rental losses are passive: they offset passive income freely, and up to $25,000/yr can offset ordinary (W-2) income if you actively participate and your MAGI is under $100k (phasing out to $0 by $150k); unused losses carry forward. On sale, claimed depreciation is recaptured at up to 25%, and gains may owe capital-gains tax (a 1031 exchange can defer both). Figures are a year-1 estimate at your 24.0% rate — not tax advice; consult a CPA.
Schools (NCES district)
- District
- Cumberland County Schools
- NCES district ID
- 3700011
- Math proficiency
- 32% ▼ -2.00%
- Reading proficiency
- 41% ▼ -1.00%
- Median HH income
- $44,168
- Composite
- 31.0/100
- National rank
- #6096
- State rank
- #126 of 178 in NC
Livability — Fayetteville
- Score
- 75/100
- State rank
- #45
- US rank
- #4031
Category grades
Schools grade is shown separately in the Schools card above.
Census & demographics
- Census place
- Fayetteville, NC
- County
- Cumberland County · 265,314 people
- City population
- 226,118
- Metro
- Fayetteville, NC
- Population (ZIP)
- 37,140
- Household income
- $58,563
- Rent vs Own
- Severe rent burden
- 1667.0
Population outlook (Cumberland County) Hauer SSP2
- Today (2025)
- 330,855 people
- By 2030
- 333,523 · +0.8%
- By 2040
- 335,583 · +1.4%
- By 2050
- 335,325 · +1.4%
- By 2075
- 342,853 · +3.6%
- By 2100
- 340,698 · +3.0%
Race, ethnicity, and origin ACS 2023
- Neighborhood character
- Highly diverse neighborhood (Simpson 0.70)
- Race & ethnicity
- Black 39% White 36% Hispanic / Latino 14% Two or more races 12% Asian 3% Native American 1%
- Hispanic origin (detail)
- Mexican 5% Puerto Rican 5%
- Common ancestry
- Slovak 2% Italian 1% Serbian 1%
- Foreign-born
- 8% · Canada, South Korea, Vietnam
- Languages at home
- 87% English-only · Spanish 9% Tagalog/Filipino 1% French/Haitian/Cajun 1%
Political lean MEDSL · Cumberland
- 2024 margin
- D (+13.4) · D 56.1% · R 42.7% · Other 1.2%
- 2008→2024 swing
- -4.3pp toward R · 2008: 17.7pp · 2024: 13.4pp
- All cycles
- 2024: D+13.4 2020: D+16.6 2016: D+16.0 2012: D+19.7 2008: D+17.7
Not yet ingested
- Civics
- —
Market trends
- HPI YoY
- ▼ -59.90%
- Current HPI
- 215.927
- Rent YoY
- ▲ 3.17%
- Metro
- Fayetteville, NC
- State GDP YoY
- ▲ 3.28%
- F500 in state
- 26
Industry mix (Fortune 500 HQ in NC)
| Industry | F500 HQs | Revenue |
|---|---|---|
| Financial Services | 2 | $213B |
|
||
| Retail | 2 | $95B |
|
||
| Industrial Conglomerate | 1 | $38B |
|
||
| Metals / Steel | 1 | $35B |
|
||
| Utilities | 1 | $30B |
|
||
| Industrial Machinery | 1 | $19B |
|
||
Price history
+222.8% since first listed11 events — show timeline
- 2026-04-28 Price Changed $205,000 TMLS
- 2026-02-27 Price Changed $214,900 TMLS
- 2025-11-12 Listed $224,900 TMLS
- 2025-09-17 Listed $224,999 LPRMLS
- 2025-06-07 Price Changed $240,000 LPRMLS
- 2025-05-21 Price Changed $250,000 LPRMLS
- 2025-04-26 Price Changed $255,000 LPRMLS
- 2025-03-04 Price Changed $260,000 LPRMLS
- 2024-11-22 Price Changed $280,000 LPRMLS
- 2024-10-10 Listed $285,000 LPRMLS
- 1986-08-13 Sold (Public Records) $63,500 Public Records
Property tax history
+6.0%/yrLatest (2025): $2,754 · +36.0% YoY. Source: county tax records.
Cash-flow waterfall
monthlySold comps — $/sqft
last 12 mo · ≤1 miLoading sold comps…