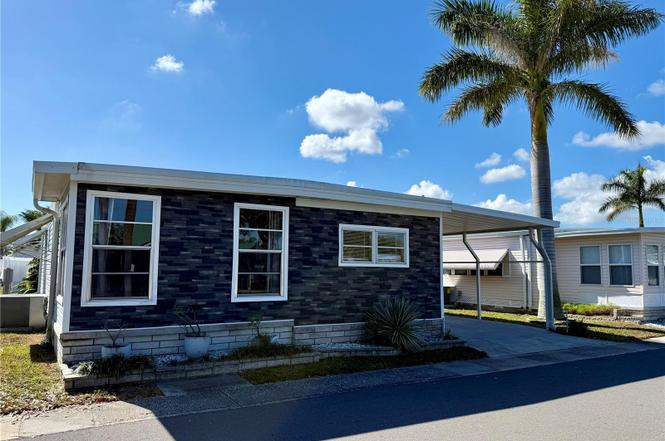
82257 3rd Ave N #257 · Pinellas Park, FL
Flood risk 6/10 · Moderate
- FEMA flood zone
- X (unshaded)
- Chance of flooding over 30 yrs
- 0.54%
- Est. flood insurance / yr
- $507 – $1,088
Fire risk 1/10 · Minimal
- Est. fire insurance / yr
- $947 – $1,759
Heat risk 10/10 · Severe
- Hot days now (above 107°F)
- 7 days/yr
- Hot days in 30 yrs
- 26 days/yr
Wind risk 10/10 · Severe
- Chance of severe wind over 30 yrs
- 99.0%
Air-quality risk 4/10 · Minor
- Unhealthy air days now
- 4 days/yr
- Unhealthy air days in 30 yrs
- 4 days/yr
Risk factors via First Street. Map © Google.
Why this score? — see what drove the C grade
The composite is a weighted blend of 9 inputs, each scored 0–100. Each bar is that input's sub-score; the figure is the points it added to the 100-point composite (weight × sub-score).
- Cash flow +26.3/30.0
- 1% rule +9.1/10.0
- DSCR +8.9/10.0
- Schools +4.3/10.0
- Livability +3.9/5.0
- Condition / age +2.5/5.0
- Rent growth +1.8/5.0
- ARV discount +0.0/15.0
- Appreciation +0.0/10.0
$135,000
🖨 Deal sheet 📄 Offer letter ✓ Due diligence
Listing remarks
* * VOTED BEST MOBILE HOME COMMUNITY 2026 in Pinellas Park/RESIDENT OWNED COMMUNITY * * Desirable 2 bedroom, 2 full bath fully furnished open floor plan. Huge primary bedroom with two separate built in closets, chest of drawers, ceiling fan and private ensuite bathroom with low step in shower and glass door. Spacious second bedroom also has two separate built in closets and ceiling fan. Guest bath has a tub/shower combo and two linen closets for extra storage. Large chef's kitchen with built in microwave, pantry, lots of cabinet and counter space. Dining area has a beautiful built in China and display cabinet. Spacious living area with ceiling fan. Bright natural light Florida room with
Key facts
- Outdoor living area
- Built in closets
- Large chef's kitchen
Tags
Property features AI
Finance
- Other: Furnished; Private maintained paved road
- Financial info: Total monthly fees $220; total annual fees $2,640
- HOA & community: HOA managed by West Coast Management/Terry Cross; Monthly HOA $220 (includes common area taxes, pool, escrow reserves, management, private road, recreational facilities, sewer, trash, water); Community amenities: Clubhouse, pool, spa/hot tub, recreation facilities, shuffleboard court, laundry, sidewalks, street lights; Senior community; Pets allowed (cats and dogs), max pet weight ~20 lbs; Buyer approval required; Deed restrictions; Golf carts allowed; Association recreation owned
Exterior
- Parking: Carport (1 space)
- Utilities: Public water; Public sewer; Electricity connected; Water connected; Sewer connected; Underground utilities; Cable available; Broadband/High-speed internet available
- Home design: Residential mobile home (double wide); One story; Faces north; Entry level: One level
- Construction: Vinyl siding; Metal roof / roof over; Crawlspace foundation with pillar/post/pier
- Exterior features: Awning(s); Private mailbox; Rain gutters; Sidewalk; Storage
Interior
- Kitchen: Microwave; Range; Refrigerator; Exhaust fan; Electric water heater
- Bedrooms: 2 bedrooms
- Flooring: Carpet; Linoleum
- Bathrooms: 2 full bathrooms
- Heating & cooling: Central heating; Electric heating; Heat pump; Central air conditioning
- Interior features: Ceiling fans; Open floor plan; Thermostat; Aluminum frame windows with blinds; Florida room
- Laundry & utility: Washer (included); Washer hookup; Outdoor laundry area
Neighborhood map
What this means for you Summary
Snapshot
- This is a 2-bed/2.0-bath manufactured listed at $135k.
Deal economics
- At list price, monthly cash flow is $349 ($4k/yr) — positive.
- The deal already cash-flows at list — no discount required.
- Meets the 1% rule at list price ($2k rent vs $135k).
- Recommended offer: $119k (12.0% below list) — sets the bar for market timing.
- Cap rate 9.4% vs local median 4.0% in Pinellas Park — top-decile yield for the area; either an underpriced asset or a hidden risk that comps aren't pricing in. Stress-test before assuming the spread holds.
Location & tenants
- Location reads 78/100 on livability (#170 in FL, #2,546 nationally) — a middle-class / working-renter tenant base. Strengths: commute A+, cost of living A+, housing A+; Watch: employment D+, schools D-, amenities F.
- Pinellas (suburban): math 51% / reading 51% proficiency, ranked #31 of 73 in FL (top 42%) — acceptable for families but not a draw, mixed tenant base, ~2y average lease.
- Market conditions: Rents soft (-3.0%/yr); 226 active listings in the ZIP; 18 comparable units currently listed for rent nearby; rentals at typical pace (median 14d on market — plan ~3-4 weeks tenant-placement turnaround); 2,676 units permitted in Pinellas County in 2024 (1,422 in 5+ unit buildings).
- This rent runs 40% of the median local income ($58k/yr) — at the standard rent-burdened threshold; future hikes will face affordability resistance.
Forward outlook
- Local home prices are declining (-3.0%/yr); year-one equity from $933 of loan paydown is wiped out by about $4k of value loss. Plan a longer hold.
- Pinellas County population projected at +14% by 2050 — modest demand growth; plan on rents tracking national, not racing it.
Negotiation context
- It's been on market 143 days — a 12% lower offer ($119k) is reasonable based on typical stale-listing flexibility.
- Current owner paid $31k; list at $135k implies a 335% gain — meaningful room to come down on a strong offer.
Risks & watch-outs
- Climate carrying-cost: major flood risk; severe wind risk, 99% chance of damaging wind over 30y; extreme-heat days projected 7→26/yr by 2055 (HVAC capex compounding) — expect insurance premiums to compound above CPI over the hold.
Questions for the listing agent
- It's been on market 143 days. Have you received any prior offers? Is the seller open to a 12% concession, seller financing, or rate buy-down credit?
- Built in 1971 — when were the roof, HVAC, electrical panel, plumbing, and water heater last replaced?
- What does the HOA fee cover, when was the last increase, and are there any pending special assessments or reserve-fund shortfalls?
- Why hasn't it sold? Are there any deal-killer items the seller is aware of (foundation, flood, title, zoning, code violations)?
- Is there a deadline driving the sale (1031 exchange, divorce, estate, relocation)? That informs how much negotiation room exists.
- Schools are D-rated, which usually means shorter tenancies and higher turnover. Who's the typical renter profile here, and what's been the actual vacancy rate?
- What's the average days-on-market for RENTAL listings here right now (not sales)? A rising rental-DOM trend means longer vacancies and softer asking-rent achievability than the comps imply.
- What's the recent tenant-quality profile in this submarket — average credit score on applications, eviction rate, late-payment / NSF rate, and stable-employment percentage? A property-management company in the area should have these aggregated.
- How much new for-sale + rental construction is in the pipeline within 1–3 miles? Heavy new supply typically softens prices + rents 12–24 months out; constrained supply supports both.
Investment metrics
- 1% rule
- 1.41% ✓
- Cap rate
- 9.40%
- Cash-on-cash
- 11.08%
- DSCR
- 1.49
- GRM
- 5.9
CMA / ARV
- ARV (on-the-fly)
- $107,520
- Comps found
- 9
Show comp detail 9 sales within ~0.75 mi
| Address | Dist | Beds/Ba | Sqft | Sold | Price | $/sf | Match |
|---|---|---|---|---|---|---|---|
| 34175 Canal Dr | 0.27mi | 2/2.0 | 954 (-1%) | 2mo | $117,500 | $123 | 85 |
| 82015 A St N #15 | 0.11mi | 2/2.0 | 915 (-5%) | 6mo | $108,000 | $118 | 82 |
| 82177 E St N #177 | 0.09mi | 2/2.0 | 1,008 (+5%) | 9mo | $30,000 | $30 | 80 |
| 34541 Violet Dr N | 0.25mi | 2/2.0 | 1,008 (+5%) | 1mo | $110,000 | $109 | 79 |
| 82009 A St N #9 | 0.09mi | 2/2.0 | 1,060 (+10%) | 12mo | $139,900 | $132 | 68 |
| 34479 Cactus Dr N | 0.29mi | 2/2.0 | 1,056 (+10%) | 2mo | $118,500 | $112 | 68 |
| 82226 F St N #226 | 0.16mi | 2/2.0 | 1,056 (+10%) | 10mo | $175,000 | $166 | 67 |
| 34076 Avocado Dr N | 0.27mi | 2/1.5 | 872 (-9%) | 5mo | $88,000 | $101 | 66 |
| 34041 Azalea Dr N | 0.27mi | 2/2.0 | 882 (-8%) | 11mo | $80,000 | $91 | 64 |
Match score weights: distance 35% · size 25% · config 20% · recency 20%. Top-matched comps best support the ARV.
Projected returns pro-forma
-3.0% appreciation · 0.0% rent growth · sell at horizon
- IRR
- -3.7%
- Equity multiple
- 0.87×
- Total profit
- $-5,053
- Equity at exit
- $20,129
- IRR
- 1.5%
- Equity multiple
- 1.09×
- Total profit
- $3,342
- Equity at exit
- $11,672
Cash invested: $37,800 (down + closing). Projections, not guarantees.
Landlord ↔ Tenant lean methodology
- Overall (STATE)
- 87 Strongly Landlord-Friendly
- State Florida
- 87 Strongly Landlord-Friendly · R+3
- County
- — inherits STATE
- City
- — inherits STATE
ZIP-level market 33781
- Rents YoY
- -3.0%
- Active inventory
- 226
- Price-to-rent
- 5.9×
Monthly cashflow live
- Estimated rent
- $1,904 high interval (Pro) →
- Mortgage (P&I)
- −$708
- Tax from tax record
- −$171 /mo · $2,050/yr
- Insurance
- −$56
- HOA
- −$220
- Vacancy / Maint / Mgmt
- −$400
- Net cashflow
- $349
Break-even live
UW: 25.0% down · 7.5% · 30yr · 1.5% tax · 5.0% vac · 8.0% maint · 8.0% mgmt
Financing live
Cash to close
- Down payment
- $33,750
- Closing costs
- $4,050
- Reserves months
- —
- Total cash needed
- —
Loan-product check · same deal, 3 products live
Conventional
25% down · 7.5% · 30yr
- Down + closing
- —
- Monthly P&I
- —
- Monthly cashflow
- —
- DSCR
- —
- Eligible?
- —
Personal DTI + credit; lowest rate.
DSCR
20% down · 8.5% · 30yr
- Down + closing
- —
- Monthly P&I
- —
- Monthly cashflow
- —
- DSCR
- —
- Eligible?
- —
No personal income docs; deal must DSCR.
Hard money
10% down · 12.0% · 12mo
- Down + closing
- —
- Monthly P&I
- —
- Monthly cashflow
- —
- DSCR
- —
- Eligible?
- —
Short-term bridge; refi at stabilization.
Rent comps 18 comps
| Address | Beds | Baths | Sqft | Rent | $/sqft | DOM | Units | Dist |
|---|---|---|---|---|---|---|---|---|
| 8851 US Highway 19 N Pinellas Park, FL | 1.0–3.0 | 1.0–2.0 | 993 | $2,295 | $2.31 | 2d | 23 | 0.43mi |
| 4355 84th Ave N Pinellas Park, FL | 1.0 | 1.0 | 700 | $1,550 | $2.21 | 2d | 10 | 0.45mi |
| 4071 76th Ave N Pinellas Park, FL | 2.0 | 1.0 | 700 | $1,724 | $2.46 | 4d | 3 | 0.48mi |
| 3110 Grand Ave Pinellas Park, FL | 1.0–3.0 | 1.0–2.0 | 1104 | $2,467 | $2.23 | 2d | 34 | 0.66mi |
| 4520 76th Ave N Pinellas Park, FL | 2.0 | 1.0 | 700 | $1,545 | $2.21 | 24d | 1 | 0.74mi |
| 4701 88th Ave N Pinellas Park, FL | 1.0–2.0 | 1.0–2.0 | 855 | $1,853 | $2.17 | 11d | 20 | 0.77mi |
| 4771 78th Ave N Pinellas Park, FL | 2.0 | 2.0 | 903 | $1,640 | $1.82 | 24d | 1 | 0.83mi |
| 8400 49th St N Pinellas Park, FL | 1.0–2.0 | 1.0–2.0 | 707 | $1,749 | $2.47 | 2d | 22 | 0.94mi |
| 4940 87th Ave Unit C Pinellas Park, FL | 2.0 | 1.0 | 700 | $2,600 | $3.71 | 24d | 1 | 0.94mi |
| 2790 Grand Ave Saint Petersburg, FL | 1.0–3.0 | 1.0–2.0 | 1017 | $2,782 | $2.73 | 2d | 16 | 0.98mi |
| 4675 72nd Ave N Pinellas Park, FL | 2.0 | 1.0 | 750 | $1,649 | $2.20 | 22d | 1 | 1.00mi |
| 3715 66th Ave N Unit B Pinellas Park, FL | 2.0 | 1.0 | 750 | $1,475 | $1.97 | 22d | 1 | 1.09mi |
| 4973 91st Ave Unit C Pinellas Park, FL | 2.0 | 2.0 | 875 | $1,475 | $1.69 | 14d | 1 | 1.09mi |
| 4973 91st Ave Unit 12 (C) Pinellas Park, FL | 2.0 | 2.0 | 875 | $1,475 | $1.69 | 15d | 1 | 1.09mi |
| 9505 49th St N Pinellas Park, FL | 1.0–3.0 | 1.0–2.0 | 1049 | $2,297 | $2.19 | 2d | 19 | 1.11mi |
| 7050 48th St N Pinellas Park, FL | 3.0 | 1.5 | 1008 | $2,350 | $2.33 | 24d | 1 | 1.14mi |
| 5060 76th Ave N #409 Pinellas Park, FL | 1.0 | 1.0 | 750 | $1,295 | $1.73 | 22d | 1 | 1.15mi |
| 9911 Dahlia St #38 Pinellas Park, FL | 2.0 | 1.0 | 850 | $1,300 | $1.53 | 8d | 1 | 1.39mi |
HOA detail
- Monthly dues
- $220 · $2,640/yr
Listing history 15 events
-
2026-06-18days on market $135,000 Active 143 DOM
-
2026-06-17days on market $135,000 Active 142 DOM
-
2026-06-16days on market $135,000 Active 141 DOM
-
2026-06-15days on market $135,000 Active 140 DOM
-
2026-06-13days on market $135,000 Active 138 DOM
-
2026-06-09days on market $135,000 Active 134 DOM
-
2026-06-08days on market $135,000 Active 133 DOM
-
2026-06-07days on market $135,000 Active 132 DOM
-
2026-06-04days on market $135,000 Active 129 DOM
-
2026-06-03days on market $135,000 Active 128 DOM
-
2026-06-01days on market $135,000 Active 126 DOM
-
2026-05-31days on market $135,000 Active 125 DOM
-
2026-03-10price $135,000
-
2026-01-26$145,000 Active
-
1996-02-01soldstatus $31,000
ⓘ Source: listings_history table (triggers on properties + properties_extension) + one-shot
backfill from property_details.listing_events for pre-trigger history.
Tax reassessment forecast FL · Resets to sale price
- Current annual tax
- $2,050 · $171/mo
- Projected year-2 tax
- $2,050 · $171/mo
- Expected delta
- $0/yr ($0/mo · 0.0%)
ⓘ Screening estimate from a state-policy table — verify with the county assessor before closing.
Climate risk First Street
- Flood 6/10 Major FEMA zone X (unshaded) · 54% chance over 30 yrs
- Wildfire 1/10 Low
- Heat 10/10 Extreme 7 d/yr ≥107°F today · 26 d/yr by 30 yrs out
- Wind 10/10 Extreme 99% chance of damaging wind over 30 yrs
- Air quality 4/10 Moderate 4 unhealthy d/yr today · 4 by 30 yrs out
Nearby sold comps map
Loading sold comps map…
Walkable amenities ~0.75 mi
Loading nearby amenities…
Taxation est. · year 1
- Rental income
- $22,848
- − Mortgage interest
- −$7,562
- − Property taxes
- −$2,050
- − Insurance
- −$675
- − Repairs & maintenance
- −$1,828
- − Management
- −$1,828
- − HOA
- −$2,640
- − Depreciation
- −$3,927
- Taxable income
- $2,338
- Est. tax owed @ 24.0%
- −$561
- After-tax cash flow
- $3,629/yr
For passive investors: Depreciation is non-cash, so a rental often shows a tax loss while cash-flowing — sheltering income. Rental losses are passive: they offset passive income freely, and up to $25,000/yr can offset ordinary (W-2) income if you actively participate and your MAGI is under $100k (phasing out to $0 by $150k); unused losses carry forward. On sale, claimed depreciation is recaptured at up to 25%, and gains may owe capital-gains tax (a 1031 exchange can defer both). Figures are a year-1 estimate at your 24.0% rate — not tax advice; consult a CPA.
Schools (NCES district)
- District
- Pinellas
- NCES district ID
- 1201560
- Math proficiency
- 51% ▼ -5.00%
- Reading proficiency
- 51% ▼ -3.00%
- Median HH income
- $46,270
- Composite
- 43.27/100
- National rank
- #3046
- State rank
- #31 of 73 in FL
Livability — Pinellas Park
- Score
- 78/100
- State rank
- #170
- US rank
- #2546
Category grades
Schools grade is shown separately in the Schools card above.
Census & demographics
- Census place
- Pinellas Park, FL
- County
- Pinellas County · 939,478 people
- City population
- 50,533
- Metro
- Tampa-St. Petersburg-Clearwater, FL
- Population (ZIP)
- 28,072
- Household income
- $57,785
- Rent vs Own
- Severe rent burden
- 1115.0
Population outlook (Pinellas County) Hauer SSP2
- Today (2025)
- 1,027,532 people
- By 2030
- 1,063,586 · +3.5%
- By 2040
- 1,125,020 · +9.5%
- By 2050
- 1,168,637 · +13.7%
- By 2075
- 1,265,188 · +23.1%
- By 2100
- 1,260,357 · +22.7%
Race, ethnicity, and origin ACS 2023
- Neighborhood character
- Diverse neighborhood (Simpson 0.60)
- Race & ethnicity
- White 59% Hispanic / Latino 16% Asian 14% Two or more races 11% Black 7%
- Hispanic origin (detail)
- Mexican 2% Puerto Rican 6% Cuban 5%
- Common ancestry
- Romanian 3% Lithuanian 3% Slovak 2%
- Foreign-born
- 18% · Canada, Vietnam, Jamaica
- Languages at home
- 72% English-only · Spanish 12% Vietnamese 7% Other Asian/Pacific 3%
Political lean MEDSL · Pinellas
- 2024 margin
- Lean R (+5.2) · D 46.9% · R 52.1%
- 2008→2024 swing
- -13.5pp toward R · 2008: 8.3pp · 2024: -5.2pp
- All cycles
- 2024: R+5.2 2020: D+0.2 2016: R+1.1 2012: D+5.6 2008: D+8.3
Not yet ingested
- Civics
- —
Market trends
- HPI YoY
- ▼ -409.77%
- Current HPI
- 348.546
- Rent YoY
- ▼ -2.95%
- Metro
- Tampa-St. Petersburg-Clearwater, FL
- State GDP YoY
- ▲ 3.28%
- F500 in state
- 36
Industry mix (Fortune 500 HQ in FL)
| Industry | F500 HQs | Revenue |
|---|---|---|
| Industrial Technology | 2 | $29B |
|
||
| Insurance | 2 | $17B |
|
||
| Retail | 1 | $60B |
|
||
| Technology Distribution | 1 | $58B |
|
||
| Homebuilding | 1 | $35B |
|
||
| Technology Manufacturing | 1 | $35B |
|
||
Price history
+335.5% since first listed3 events — show timeline
- 2026-03-10 Price Changed $135,000 Stellar MLS as Distributed by MLS Grid
- 2026-01-26 Listed $145,000 Stellar MLS as Distributed by MLS Grid
- 1996-02-01 Sold (Public Records) $31,000 Public Records
Property tax history
+7.3%/yrLatest (2025): $2,050 · +7.2% YoY. Source: county tax records.
Cash-flow waterfall
monthlySold comps — $/sqft
last 12 mo · ≤1 miLoading sold comps…