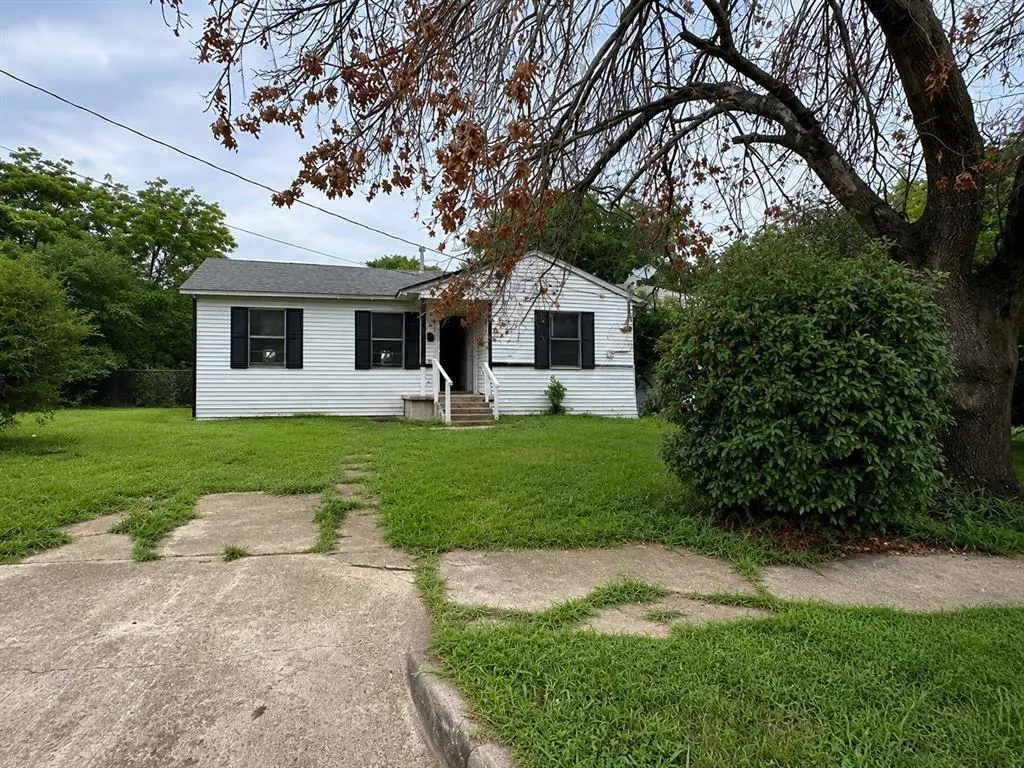
2951 E Ann Arbor Ave · Dallas, TX
Flood risk 1/10 · Minimal
- FEMA flood zone
- X (unshaded)
- Chance of flooding over 30 yrs
- 0.0%
- Est. flood insurance / yr
- $507 – $1,088
Fire risk 3/10 · Minor
- Est. fire insurance / yr
- $1,222 – $2,270
Heat risk 7/10 · Major
- Hot days now (above 109°F)
- 7 days/yr
- Hot days in 30 yrs
- 24 days/yr
Wind risk 6/10 · Moderate
- Chance of severe wind over 30 yrs
- 27.0%
Air-quality risk 2/10 · Minimal
- Unhealthy air days now
- 1 days/yr
- Unhealthy air days in 30 yrs
- 2 days/yr
Risk factors via First Street. Map © Google.
Why this score? — see what drove the B grade
The composite is a weighted blend of 9 inputs, each scored 0–100. Each bar is that input's sub-score; the figure is the points it added to the 100-point composite (weight × sub-score).
- Cash flow +30.0/30.0
- 1% rule +10.0/10.0
- DSCR +10.0/10.0
- ARV discount +7.5/15.0
- Livability +4.0/5.0
- Rent growth +3.6/5.0
- Schools +2.8/10.0
- Condition / age +2.5/5.0
- Appreciation +0.0/10.0
$55,000
🖨 Deal sheet 📄 Offer letter ✓ Due diligence
Listing remarks
MULTIPLE OFFERS RECEIVED - DUE NO LATER THAN 10AM - MONDAY - JUNE 1, 2026 Opportunity awaits at this 3-bedroom, 1-bath home nestled in an established neighborhood with convenient access to everything Dallas has to offer. With solid potential and a functional layout, this property is ideal for investors, renovators, or buyers looking to create a personalized space from the ground up. The home will require significant repairs and updates, making it a great candidate for a full remodel or value-add project. Spacious lot offers room to expand outdoor living, gardening, or future improvements. Located just minutes from major highways, commuting to downtown Dallas, Bishop Arts District, and ne
Key facts
- Nearby amenities
- Spacious lot
- Full remodel
Tags
Property features AI
Finance
- Other: Property is listed For Sale; Listing broker: Excel Realty; Built preowned
- Financial info: Treat as clear loan type; No second mortgage; Special listing condition: Real Estate Owned
- HOA & community: No association
Exterior
- Parking: Driveway parking
- Security: No surveillance devices noted
- Utilities: City water; City sewer; Not in a municipal utility district
- Home design: Single family residence; Residential property; One story; Built in 1945; Not attached to another unit
- Construction: Wood construction; Composition roof; Pillar/post/pier foundation
- Exterior features: No fencing; Lot is less than 0.5 acre (approx. 0.443 acre); Will not subdivide
Interior
- Kitchen: No appliances included
- Bedrooms: 3 bedrooms (primary bedroom on level 1, approx. 10 x 8)
- Flooring: Laminate flooring
- Bathrooms: 1 full bathroom
- Heating & cooling: No heating; No cooling
- Interior features: One level; One living area; Other interior features; Room count: 2
- Laundry & utility: No laundry features listed
Neighborhood map
What this means for you Summary
Snapshot
- This is a 1-bed/1.0-bath single-family listed at $55k.
Deal economics
- At list price, monthly cash flow is $533 ($6k/yr) — positive.
- The deal already cash-flows at list — no discount required.
- Meets the 1% rule at list price ($1k rent vs $55k).
- Recommended offer: $54k (1.5% below list) — sets the bar for market timing.
- Cap rate 17.9% vs local median 2.3% in Dallas — top-decile yield for the area; either an underpriced asset or a hidden risk that comps aren't pricing in. Stress-test before assuming the spread holds.
Location & tenants
- Location reads 81/100 on livability (#24 in TX, #1,380 nationally) — a professional / high-income tenant draw. Strengths: amenities A+, commute A+, housing A+; Watch: crime F.
- Dallas ISD (urban): math 31% / reading 36% proficiency, ranked #559 of 826 in TX (top 68%) — families likely to look elsewhere, expect single-tenant / working-renter base with shorter leases; 83% free/reduced lunch — lower-income household profile, screen leases tightly.
- Zoned schools: Elisha M Pease El (math 18% / reading 24%, grade F, #3,492 of 4,322 statewide, top 81%, 817 students, 98% FRL) — zoned schools average 98% FRL vs 83% district-wide (15 pts higher); higher-poverty schools than district average — tighter screening recommended.
- Zoned-school proficiency averages 21% at this address vs 34% district-wide (-12 pts) — the specific schools serving this property underperform the Dallas ISD average; the district grade overstates school quality for this exact location.
- Market conditions: Rents rising fast (+4.2%/yr); 249 active listings in the ZIP; 17 comparable units currently listed for rent nearby; rentals at typical pace (median 19d on market — plan ~3-4 weeks tenant-placement turnaround); lower-income renter base — watch delinquency; 12,577 units permitted in Dallas County in 2024 (6,829 in 5+ unit buildings).
- This rent runs 34% of the median local income ($41k/yr) — at the standard rent-burdened threshold; future hikes will face affordability resistance.
Forward outlook
- Local home prices are declining (-3.0%/yr); year-one equity from $380 of loan paydown is wiped out by about $2k of value loss. Plan a longer hold.
- Dallas County population projected at +35% by 2050 — long-run rental-demand tailwind backs the buy-and-hold thesis.
- At projected returns (-3.0% appreciation + 4.2% rent growth), your $15k cash investment doubles in ~3 years — after that, you're playing with house money.
Negotiation context
- It's been on market 16 days — a 2% lower offer ($54k) is reasonable based on typical stale-listing flexibility.
Risks & watch-outs
- Watch-outs: built in 1945 — expect roof / HVAC / electrical / plumbing capex.
- Climate carrying-cost: major wind risk, 27% chance of damaging wind over 30y; extreme-heat days projected 7→24/yr by 2055 (HVAC capex compounding) — expect insurance premiums to compound above CPI over the hold.
Questions for the listing agent
- Built in 1945 — when were the roof, HVAC, electrical panel, plumbing, and water heater last replaced?
- Is there a deadline driving the sale (1031 exchange, divorce, estate, relocation)? That informs how much negotiation room exists.
- Crime grade is F in this area — have there been break-ins, vandalism, or insurance claims at this property in the last 3 years? What carrier currently insures it and at what premium?
- What's the average days-on-market for RENTAL listings here right now (not sales)? A rising rental-DOM trend means longer vacancies and softer asking-rent achievability than the comps imply.
- What's the recent tenant-quality profile in this submarket — average credit score on applications, eviction rate, late-payment / NSF rate, and stable-employment percentage? A property-management company in the area should have these aggregated.
- How much new for-sale + rental construction is in the pipeline within 1–3 miles? Heavy new supply typically softens prices + rents 12–24 months out; constrained supply supports both.
Investment metrics
- 1% rule
- 2.10% ✓
- Cap rate
- 17.93%
- Cash-on-cash
- 41.55%
- DSCR
- 2.85
- GRM
- 4.0
CMA / ARV
- ARV (on-the-fly)
- $144,300
- Comps found
- 2
Show comp detail 2 sales within ~0.75 mi
| Address | Dist | Beds/Ba | Sqft | Sold | Price | $/sf | Match |
|---|---|---|---|---|---|---|---|
| 4848 Haas Dr | 0.48mi | 2/1.0 (+1) | 901 (-6%) | 8mo | $135,000 | $150 | 55 |
| 2855 Marjorie Ave | 0.63mi | 2/1.0 (+1) | 864 (-10%) | 13mo | $119,500 | $138 | 38 |
Match score weights: distance 35% · size 25% · config 20% · recency 20%. Top-matched comps best support the ARV.
Projected returns pro-forma
-3.0% appreciation · 4.2% rent growth · sell at horizon
- IRR
- 39.5%
- Equity multiple
- 2.72×
- Total profit
- $26,482
- Equity at exit
- $8,201
- IRR
- 46.5%
- Equity multiple
- 5.73×
- Total profit
- $72,806
- Equity at exit
- $4,755
Cash invested: $15,400 (down + closing). Projections, not guarantees.
Landlord ↔ Tenant lean methodology
- Overall (STATE)
- 87 Strongly Landlord-Friendly
- State Texas
- 87 Strongly Landlord-Friendly · R+5
- County
- — inherits STATE
- City
- — inherits STATE
ZIP-level market 75216
- Home prices YoY
- -29.7%
- Rents YoY
- 4.2%
- Active inventory
- 249
- Price-to-rent
- 4.0×
Monthly cashflow live
- Estimated rent
- $1,156 high interval (Pro) →
- Mortgage (P&I)
- −$288
- Tax est. 1.5%
- −$69 /mo · $825/yr
- Insurance
- −$23
- HOA
- −$0
- Vacancy / Maint / Mgmt
- −$243
- Net cashflow
- $533
Break-even live
UW: 25.0% down · 7.5% · 30yr · 1.5% tax · 5.0% vac · 8.0% maint · 8.0% mgmt
Financing live
Cash to close
- Down payment
- $13,750
- Closing costs
- $1,650
- Reserves months
- —
- Total cash needed
- —
Loan-product check · same deal, 3 products live
Conventional
25% down · 7.5% · 30yr
- Down + closing
- —
- Monthly P&I
- —
- Monthly cashflow
- —
- DSCR
- —
- Eligible?
- —
Personal DTI + credit; lowest rate.
DSCR
20% down · 8.5% · 30yr
- Down + closing
- —
- Monthly P&I
- —
- Monthly cashflow
- —
- DSCR
- —
- Eligible?
- —
No personal income docs; deal must DSCR.
Hard money
10% down · 12.0% · 12mo
- Down + closing
- —
- Monthly P&I
- —
- Monthly cashflow
- —
- DSCR
- —
- Eligible?
- —
Short-term bridge; refi at stabilization.
Rent comps 17 comps
| Address | Beds | Baths | Sqft | Rent | $/sqft | DOM | Units | Dist |
|---|---|---|---|---|---|---|---|---|
| 3035 E Ledbetter Dr Dallas, TX | 1.0–2.0 | 1.0 | 643 | $1,100 | $1.71 | 3d | 1 | 0.64mi |
| 4836 Sunnyvale St Dallas, TX | 1.0–3.0 | 1.0–2.0 | 515 | $1,147 | $2.23 | 43d | 7 | 0.65mi |
| 3015 E Ledbetter Dr Dallas, TX | 2.0–3.0 | 2.0 | 1030 | $1,100 | $1.07 | 3d | 1 | 0.68mi |
| 3460 South Loop 12 Dallas, TX | 1.0–2.0 | 1.0–1.5 | 758 | $999 | $1.32 | 12d | 2 | 0.77mi |
| 3460 South Loop 12 Dallas, TX | 2.0 | 1.5 | 867 | $1,150 | $1.33 | 6d | 1 | 0.77mi |
| 3460 South Loop 12 Dallas, TX | 1.0 | 1.0 | 650 | $999 | $1.54 | 18d | 1 | 0.77mi |
| 2751 E Ledbetter Dr Dallas, TX | 1.0–3.0 | 1.0–1.5 | 794 | $962 | $1.21 | 43d | 3 | 0.94mi |
| 3130 Stag Rd Dallas, TX | 1.0–3.0 | 1.0–2.0 | 831 | $1,167 | $1.40 | 43d | 3 | 0.96mi |
| 2625 E Illinois Ave Dallas, TX | 1.0 | 1.0 | 650 | $999 | $1.54 | 24d | 1 | 1.07mi |
| 2625 E Illinois Ave Dallas, TX | 2.0 | 1.0 | 750 | $1,050 | $1.40 | 4d | 1 | 1.07mi |
| 2625 E Illinois Ave Dallas, TX | 1.0 | 1.0 | 650 | $950 | $1.46 | 18d | 1 | 1.07mi |
| 2625 E Illinois Ave Dallas, TX | 2.0 | 1.0 | 750 | $1,050 | $1.40 | 19d | 1 | 1.07mi |
| 2625 E Illinois Ave Unit 118 Dallas, TX | 1.0 | 1.0 | 650 | $999 | $1.54 | 19d | 1 | 1.07mi |
| 2625 E Illinois Ave Dallas, TX | 1.0–2.0 | 1.0 | 700 | $950 | $1.36 | 12d | 18 | 1.07mi |
| 2625 E Illinois Ave Unit 102 Dallas, TX | 2.0 | 1.0 | 750 | $1,050 | $1.40 | 24d | 1 | 1.09mi |
| 2503 Stovall Dr Dallas, TX | 2.0 | 2.0 | 768 | $2,300 | $2.99 | 43d | 1 | 1.27mi |
| 2303 Deer Path Dr Dallas, TX | 2.0 | 1.0 | 790 | $1,650 | $2.09 | 7d | 1 | 1.30mi |
Listing history 8 events
-
2026-06-07statusdays on market $55,000 Pending 16 DOM
-
2026-06-04days on market $55,000 Active 14 DOM
-
2026-06-03days on market $55,000 Active 13 DOM
-
2026-06-02days on market $55,000 Active 12 DOM
-
2026-06-01days on market $55,000 Active 11 DOM
-
2026-05-31days on market $55,000 Active 10 DOM
-
2026-05-21$55,000 Active
-
1974-07-08soldstatus
ⓘ Source: listings_history table (triggers on properties + properties_extension) + one-shot
backfill from property_details.listing_events for pre-trigger history.
Climate risk First Street
- Flood 1/10 Low FEMA zone X (unshaded) · 0% chance over 30 yrs
- Wildfire 3/10 Moderate
- Heat 7/10 Severe 7 d/yr ≥109°F today · 24 d/yr by 30 yrs out
- Wind 6/10 Major 27% chance of damaging wind over 30 yrs
- Air quality 2/10 Low 1 unhealthy d/yr today · 2 by 30 yrs out
Nearby sold comps map
Loading sold comps map…
Walkable amenities ~0.75 mi
Loading nearby amenities…
Taxation est. · year 1
- Rental income
- $13,874
- − Mortgage interest
- −$3,081
- − Property taxes
- −$825
- − Insurance
- −$275
- − Repairs & maintenance
- −$1,110
- − Management
- −$1,110
- − Depreciation
- −$1,600
- Taxable income
- $5,873
- Est. tax owed @ 24.0%
- −$1,410
- After-tax cash flow
- $4,990/yr
For passive investors: Depreciation is non-cash, so a rental often shows a tax loss while cash-flowing — sheltering income. Rental losses are passive: they offset passive income freely, and up to $25,000/yr can offset ordinary (W-2) income if you actively participate and your MAGI is under $100k (phasing out to $0 by $150k); unused losses carry forward. On sale, claimed depreciation is recaptured at up to 25%, and gains may owe capital-gains tax (a 1031 exchange can defer both). Figures are a year-1 estimate at your 24.0% rate — not tax advice; consult a CPA.
Schools (NCES district)
- District
- Dallas ISD
- NCES district ID
- 4816230
- Math proficiency
- 31% ▼ -16.00%
- Reading proficiency
- 36% ▼ -4.00%
- Median HH income
- $42,881
- Composite
- 28.41/100
- National rank
- #6763
- State rank
- #559 of 826 in TX
Livability — Dallas
- Score
- 81/100
- State rank
- #24
- US rank
- #1380
Category grades
Schools grade is shown separately in the Schools card above.
Census & demographics
- Census place
- Dallas, TX
- County
- Dallas County · 2,612,404 people
- City population
- 1,168,437
- Metro
- Dallas-Fort Worth-Arlington, TX
- Population (ZIP)
- 55,894
- Household income
- $41,386
- Rent vs Own
- Severe rent burden
- 2465.0
Population outlook (Dallas County) Hauer SSP2
- Today (2025)
- 2,979,839 people
- By 2030
- 3,191,823 · +7.1%
- By 2040
- 3,619,611 · +21.5%
- By 2050
- 4,026,915 · +35.1%
- By 2075
- 4,957,073 · +66.4%
- By 2100
- 5,508,725 · +84.9%
Race, ethnicity, and origin ACS 2023
- Neighborhood character
- Majority Black (51%)
- Race & ethnicity
- Black 51% Hispanic / Latino 44% Two or more races 14% White 3%
- Hispanic origin (detail)
- Mexican 40%
- Common ancestry
- Hispanic 1%
- Foreign-born
- 17% · Canada
- Languages at home
- 62% English-only · Spanish 37%
Political lean MEDSL · Dallas
- 2024 margin
- Strong D (+22.2) · D 60.2% · R 38.0% · Other 1.8%
- 2008→2024 swing
- +6.9pp toward D · 2008: 15.3pp · 2024: 22.2pp
- All cycles
- 2024: D+22.2 2020: D+31.6 2016: D+26.2 2012: D+15.4 2008: D+15.3
Not yet ingested
- Civics
- —
Market trends
- HPI YoY
- ▼ -126.35%
- Current HPI
- 299.1825
- Rent YoY
- ▲ 4.20%
- Metro
- Dallas-Fort Worth-Arlington, TX
- State GDP YoY
- ▲ 3.95%
- F500 in state
- 110
Industry mix (Fortune 500 HQ in TX)
| Industry | F500 HQs | Revenue |
|---|---|---|
| Energy | 16 | $1,198B |
|
||
| Technology | 5 | $198B |
|
||
| Engineering / Construction | 4 | $72B |
|
||
| Energy Services | 3 | $60B |
|
||
| Utilities | 3 | $41B |
|
||
| Healthcare | 2 | $330B |
|
||
Price history
2 events — show timeline
- 2026-05-21 Listed $55,000 NTREIS
- 1974-07-08 Sold (Public Records) — Public Records
Property tax history
+8.2%/yrLatest (2025): $3,789 · +0.1% YoY. Source: county tax records.
Cash-flow waterfall
monthlySold comps — $/sqft
last 12 mo · ≤1 miLoading sold comps…