10760 Wigwam Rd #69 · Jamestown, CA
Flood risk 1/10 · Minimal
- FEMA flood zone
- X (unshaded)
- Chance of flooding over 30 yrs
- 0.0%
- Est. flood insurance / yr
- $507 – $1,088
Fire risk 8/10 · Major
- Est. fire insurance / yr
- $659 – $1,223
Heat risk 6/10 · Moderate
- Hot days now (above 101°F)
- 7 days/yr
- Hot days in 30 yrs
- 17 days/yr
Wind risk 1/10 · Minimal
- Chance of severe wind over 30 yrs
- —
Air-quality risk 10/10 · Severe
- Unhealthy air days now
- 28 days/yr
- Unhealthy air days in 30 yrs
- 33 days/yr
Risk factors via First Street. Map © Google.
Why this score? — see what drove the B- grade
The composite is a weighted blend of 9 inputs, each scored 0–100. Each bar is that input's sub-score; the figure is the points it added to the 100-point composite (weight × sub-score).
- Cash flow +30.0/30.0
- DSCR +10.0/10.0
- 1% rule +8.6/10.0
- ARV discount +7.5/15.0
- Schools +3.3/10.0
- Livability +2.7/5.0
- Rent growth +2.5/5.0
- Condition / age +2.5/5.0
- Appreciation +0.0/10.0
$127,000
🖨 Deal sheet 📄 Offer letter ✓ Due diligence
Listing remarks MLS
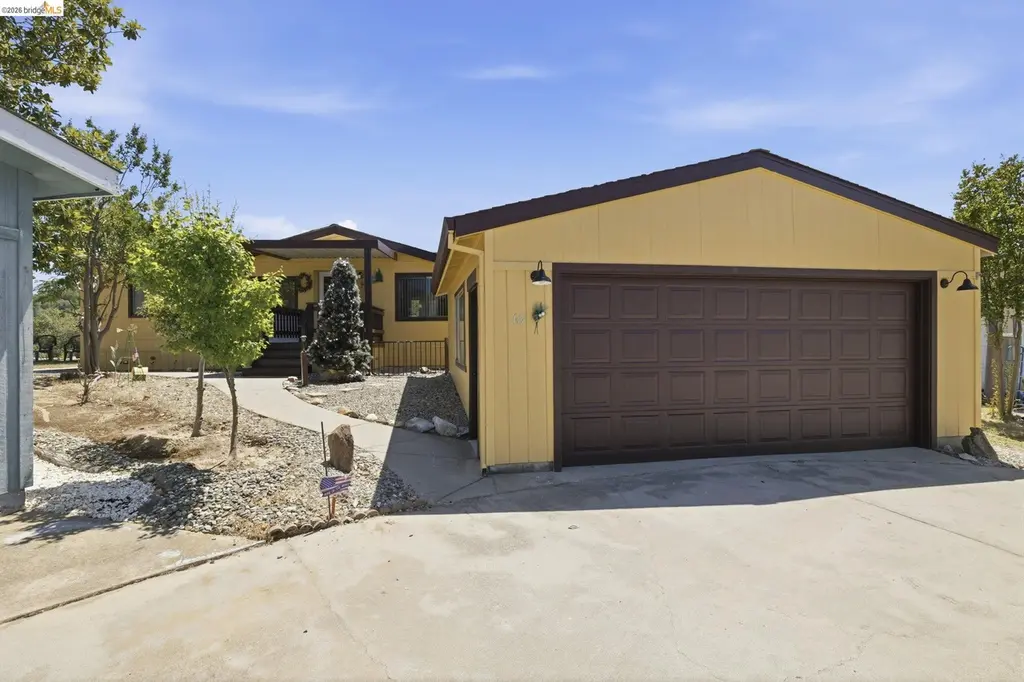
Welcome to 10760 Wig Wam Road space #69, located in the Twin Pines Mobile Home park. Do not miss the opportunity to see this beautiful single level spacious home with an open floor plan to include 3 bedrooms, 2 bathrooms, and a good-sized living room area. This home has a nice open feeling. Enjoy your quiet back porch, with a beautiful view, a small area for gardening on the side of the house, and a large garage for parking or storage needs. With a little love this home can be a perfect place for someone.
Key facts
- Private back porch
- New roof replacement
- Oversized garage
Tags
Property features AI
Finance
- Other: Living area approximately 1,000 square feet; Total rooms: 5
- HOA & community: Pets allowed in the park
Exterior
- Parking: Detached garage facing front; 2 garage spaces (2 covered spaces)
- Utilities: Sewer connected
- Home design: Manufactured in park (mobile home); Double wide
- Construction: Composition shingle roof; Siding (other)
- Exterior features: Front yard; Corner lot; Located on a cul-de-sac
Interior
- Kitchen: Dishwasher; Refrigerator; Disposal; Solid surface countertops
- Bedrooms: 3 bedrooms (street level)
- Flooring: Laminate flooring
- Bathrooms: 2 full bathrooms; Primary bathroom with stall shower; Other bathroom with solid surface and stall shower
- Heating & cooling: Central heating; Central air conditioning
- Interior features: Solid surface countertops; No additional rooms listed; Double pane windows
- Laundry & utility: Washer and dryer in kitchen area; 220-volt outlet; Cabinets in laundry area; Laundry facility (street level)
Neighborhood map
What this means for you Summary
Snapshot
- This is a 3-bed/2.0-bath manufactured listed at $127k.
Deal economics
- At list price, monthly cash flow is $489 ($6k/yr) — positive.
- The deal already cash-flows at list — no discount required.
- Meets the 1% rule at list price ($2k rent vs $127k).
- Cap rate 10.9% vs local median 4.5% in Jamestown — top-decile yield for the area; either an underpriced asset or a hidden risk that comps aren't pricing in. Stress-test before assuming the spread holds.
Location & tenants
- Location reads 53/100 on livability (#980 in CA) — a working-class tenant base; expect higher turnover. Strengths: crime B; Watch: housing C-, cost of living D, schools F.
- Sonora Union High (town): math 21% / reading 59% proficiency, ranked #243 of 517 in CA (top 47%) — families likely to look elsewhere, expect single-tenant / working-renter base with shorter leases.
- Market conditions: 75 active listings in the ZIP; 60 units permitted in Tuolumne County in 2024 (0 in 5+ unit buildings).
Forward outlook
- Local home prices are declining (-3.0%/yr); year-one equity from $878 of loan paydown is wiped out by about $4k of value loss. Plan a longer hold.
- Tuolumne County population projected at -15% by 2050 — secular population decline; favor cash flow + early exit over multi-decade hold.
- At projected returns (-3.0% appreciation + 3.0% rent growth), your $36k cash investment doubles in ~8 years — after that, you're playing with house money.
Negotiation context
- Only 11 days on market — expect competitive offers; lowballing is unlikely to land.
- 4 sale attempts since 12y ago with the ask held roughly flat each time — persistent listings suggest the price (not the market) is what's stuck; bring a comps-based counter.
Risks & watch-outs
- Climate carrying-cost: severe wildfire risk; extreme-heat days projected 7→17/yr by 2055 (HVAC capex compounding) — expect insurance premiums to compound above CPI over the hold.
Questions for the listing agent
- Built in 1960 — when were the roof, HVAC, electrical panel, plumbing, and water heater last replaced?
- Is there a deadline driving the sale (1031 exchange, divorce, estate, relocation)? That informs how much negotiation room exists.
- Schools are F-rated, which usually means shorter tenancies and higher turnover. Who's the typical renter profile here, and what's been the actual vacancy rate?
- What's the average days-on-market for RENTAL listings here right now (not sales)? A rising rental-DOM trend means longer vacancies and softer asking-rent achievability than the comps imply.
- What's the recent tenant-quality profile in this submarket — average credit score on applications, eviction rate, late-payment / NSF rate, and stable-employment percentage? A property-management company in the area should have these aggregated.
- How much new for-sale + rental construction is in the pipeline within 1–3 miles? Heavy new supply typically softens prices + rents 12–24 months out; constrained supply supports both.
Investment metrics
- 1% rule
- 1.36% ✓
- Cap rate
- 10.91%
- Cash-on-cash
- 16.51%
- DSCR
- 1.73
- GRM
- 6.1
CMA / ARV
- ARV (on-the-fly)
- $72,576
- Comps found
- 7
Show comp detail 7 sales within ~0.75 mi
| Address | Dist | Beds/Ba | Sqft | Sold | Price | $/sf | Match |
|---|---|---|---|---|---|---|---|
| 10678 Wigwam Rd #14 | 0.17mi | 3/2.0 | 1,232 (+7%) | 14mo | $114,000 | $93 | 69 |
| 18725 Hwy 108 #71 #71 | 0.35mi | 3/2.0 | 1,152 (0%) | 22mo | $59,000 | $51 | 65 |
| 18725 Hwy 108 #62 #62 | 0.38mi | 3/2.0 | 1,248 (+8%) | 14mo | $57,900 | $46 | 57 |
| 10678 Wigwam #10 | 0.17mi | 2/2.0 (-1) | 1,260 (+9%) | 22mo | $80,000 | $63 | 54 |
| 18717 Mill Villa Rd #156 | 0.75mi | 2/2.0 (-1) | 1,135 (-2%) | 6mo | $72,000 | $63 | 53 |
| 18371 5th Ave | 0.65mi | 3/2.0 | 1,188 (+3%) | 16mo | $306,500 | $258 | 51 |
| 18717 Mill Villa #101 #101 | 0.75mi | 2/2.0 (-1) | 1,040 (-10%) | 18mo | $144,000 | $138 | 29 |
Match score weights: distance 35% · size 25% · config 20% · recency 20%. Top-matched comps best support the ARV.
Projected returns pro-forma
-3.0% appreciation · 3.0% rent growth · sell at horizon
- IRR
- 7.6%
- Equity multiple
- 1.30×
- Total profit
- $10,598
- Equity at exit
- $18,936
- IRR
- 16.9%
- Equity multiple
- 2.39×
- Total profit
- $49,448
- Equity at exit
- $10,981
Cash invested: $35,560 (down + closing). Projections, not guarantees.
Landlord ↔ Tenant lean methodology
- Overall (STATE)
- 18 Strongly Tenant-Friendly
- State California
- 18 Strongly Tenant-Friendly · D+13
- County
- — inherits STATE
- City
- — inherits STATE
ZIP-level market 95327
- Active inventory
- 75
- Price-to-rent
- 6.1×
Monthly cashflow live
- Estimated rent
- $1,730 medium interval (Pro) →
- Mortgage (P&I)
- −$666
- Tax est. 1.5%
- −$159 /mo · $1,905/yr
- Insurance
- −$53
- HOA
- −$0
- Vacancy / Maint / Mgmt
- −$363
- Net cashflow
- $489
Break-even live
UW: 25.0% down · 7.5% · 30yr · 1.5% tax · 5.0% vac · 8.0% maint · 8.0% mgmt
Financing live
Cash to close
- Down payment
- $31,750
- Closing costs
- $3,810
- Reserves months
- —
- Total cash needed
- —
Loan-product check · same deal, 3 products live
Conventional
25% down · 7.5% · 30yr
- Down + closing
- —
- Monthly P&I
- —
- Monthly cashflow
- —
- DSCR
- —
- Eligible?
- —
Personal DTI + credit; lowest rate.
DSCR
20% down · 8.5% · 30yr
- Down + closing
- —
- Monthly P&I
- —
- Monthly cashflow
- —
- DSCR
- —
- Eligible?
- —
No personal income docs; deal must DSCR.
Hard money
10% down · 12.0% · 12mo
- Down + closing
- —
- Monthly P&I
- —
- Monthly cashflow
- —
- DSCR
- —
- Eligible?
- —
Short-term bridge; refi at stabilization.
Listing history 10 events
-
2026-06-18days on market $127,000 Active 11 DOM
-
2026-06-17days on market $127,000 Active 10 DOM
-
2026-06-16days on market $127,000 Active 9 DOM
-
2026-06-15days on market $127,000 Active 8 DOM
-
2026-06-14days on market $127,000 Active 6 DOM
-
2026-06-13days on market $127,000 Active 5 DOM
-
2026-06-10days on market $127,000 Active 3 DOM
-
2026-06-09days on market $127,000 Active 2 DOM
-
2026-06-08remarks 693-char remark
-
2026-06-08$127,000 Active 1 DOM
ⓘ Source: listings_history table (triggers on properties + properties_extension) + one-shot
backfill from property_details.listing_events for pre-trigger history.
Climate risk First Street
- Flood 1/10 Low FEMA zone X (unshaded) · 0% chance over 30 yrs
- Wildfire 8/10 Severe
- Heat 6/10 Major 7 d/yr ≥101°F today · 17 d/yr by 30 yrs out
- Wind 1/10 Low
- Air quality 10/10 Extreme 28 unhealthy d/yr today · 33 by 30 yrs out
Nearby sold comps map
Loading sold comps map…
Walkable amenities ~0.75 mi
Loading nearby amenities…
Taxation est. · year 1
- Rental income
- $20,761
- − Mortgage interest
- −$7,114
- − Property taxes
- −$1,905
- − Insurance
- −$635
- − Repairs & maintenance
- −$1,661
- − Management
- −$1,661
- − Depreciation
- −$3,695
- Taxable income
- $4,091
- Est. tax owed @ 24.0%
- −$982
- After-tax cash flow
- $4,888/yr
For passive investors: Depreciation is non-cash, so a rental often shows a tax loss while cash-flowing — sheltering income. Rental losses are passive: they offset passive income freely, and up to $25,000/yr can offset ordinary (W-2) income if you actively participate and your MAGI is under $100k (phasing out to $0 by $150k); unused losses carry forward. On sale, claimed depreciation is recaptured at up to 25%, and gains may owe capital-gains tax (a 1031 exchange can defer both). Figures are a year-1 estimate at your 24.0% rate — not tax advice; consult a CPA.
Schools (NCES district)
- District
- Sonora Union High
- NCES district ID
- 0637260
- Math proficiency
- 21% ▼ -12.00%
- Reading proficiency
- 59% ▼ -5.00%
- Median HH income
- $40,252
- Composite
- 33.41/100
- National rank
- #5470
- State rank
- #243 of 517 in CA
Livability — Jamestown
- Score
- 53/100
- State rank
- #980
- US rank
- #24642
Category grades
Schools grade is shown separately in the Schools card above.
Census & demographics
- Census place
- Jamestown, CA
- Population (ZIP)
- 8,799
Population outlook (Tuolumne County) Hauer SSP2
- Today (2025)
- 50,349 people
- By 2030
- 48,708 · -3.3%
- By 2040
- 45,284 · -10.1%
- By 2050
- 42,575 · -15.4%
- By 2075
- 36,827 · -26.9%
- By 2100
- 30,369 · -39.7%
Race, ethnicity, and origin ACS 2023
- Neighborhood character
- Majority White (63%)
- Race & ethnicity
- White 63% Hispanic / Latino 24% Two or more races 13% Black 7% Native American 3% Asian 1%
- Hispanic origin (detail)
- Mexican 15%
- Common ancestry
- Slovak 4% Serbian 3% Lithuanian 2%
- Foreign-born
- 5% · Canada
- Languages at home
- 87% English-only · Spanish 11% Other Asian/Pacific 1%
Political lean MEDSL · Tuolumne
- 2024 margin
- Strong R (+21.9) · D 37.9% · R 59.7% · Other 2.4%
- 2008→2024 swing
- -9.2pp toward R · 2008: -12.7pp · 2024: -21.9pp
- All cycles
- 2024: R+21.9 2020: R+18.8 2016: R+20.9 2012: R+15.9 2008: R+12.7
Not yet ingested
- Civics
- —
Market trends
- HPI YoY
- ▼ -129.96%
- Current HPI
- 100.2616
- Rent YoY
- —
- Metro
- —
- State GDP YoY
- ▲ 3.21%
- F500 in state
- 116
Industry mix (Fortune 500 HQ in CA)
| Industry | F500 HQs | Revenue |
|---|---|---|
| Technology | 27 | $1,492B |
|
||
| Financial Services | 3 | $174B |
|
||
| Retail | 3 | $44B |
|
||
| Insurance | 3 | $26B |
|
||
| Media / Entertainment | 2 | $115B |
|
||
| Pharmaceuticals / Biotech | 2 | $62B |
|
||
Price history
+159.2% since first listed7 events — show timeline
- 2026-06-07 Listed $127,000 bridgeMLS, Bay East AOR, or Contra Costa AOR
- 2024-01-05 Sold (MLS) $112,900 bridgeMLS, Bay East AOR, or Contra Costa AOR
- 2023-08-10 Listed $120,000 bridgeMLS, Bay East AOR, or Contra Costa AOR
- 2015-10-13 Sold (MLS) $25,000 bridgeMLS, Bay East AOR, or Contra Costa AOR
- 2015-08-07 Listed $25,000 bridgeMLS, Bay East AOR, or Contra Costa AOR
- 2015-02-26 Sold (MLS) $36,000 bridgeMLS, Bay East AOR, or Contra Costa AOR
- 2014-11-14 Listed $49,000 bridgeMLS, Bay East AOR, or Contra Costa AOR
Property tax history
-2.6%/yrLatest (2025): $200 · -24.1% YoY. Source: county tax records.
Cash-flow waterfall
monthlySold comps — $/sqft
last 12 mo · ≤1 miLoading sold comps…