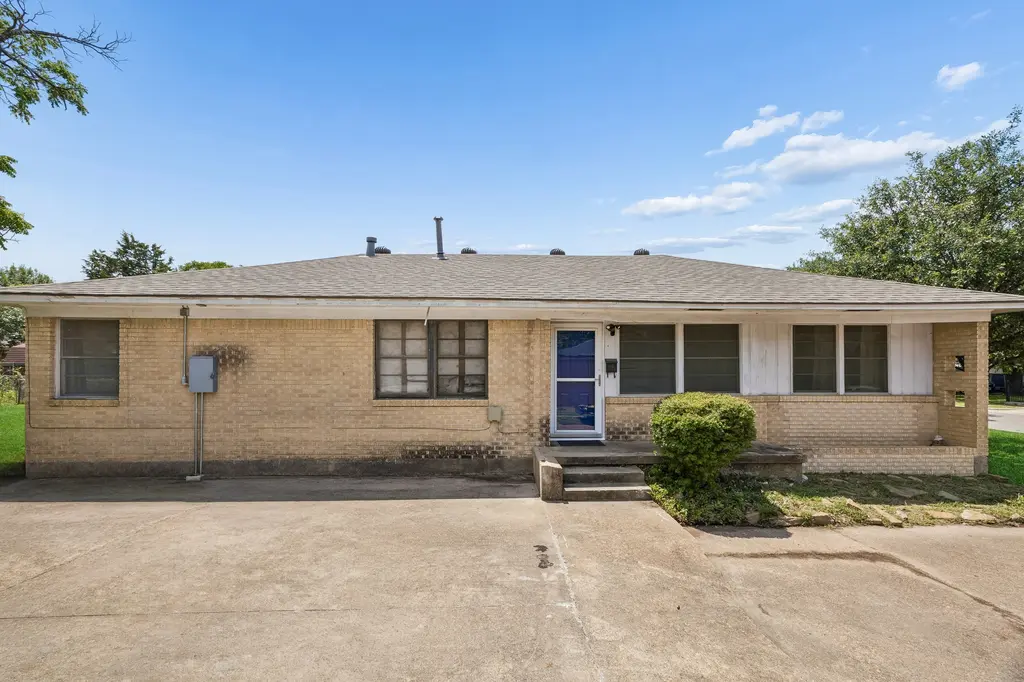
3040 June Dr · Dallas, TX
Flood risk No data
- FEMA flood zone
- —
- Chance of flooding over 30 yrs
- —
- Est. flood insurance / yr
- —
Fire risk No data
- Est. fire insurance / yr
- —
Heat risk No data
- Hot days now (above threshold)
- —
- Hot days in 30 yrs
- —
Wind risk No data
- Chance of severe wind over 30 yrs
- —
Air-quality risk No data
- Unhealthy air days now
- —
- Unhealthy air days in 30 yrs
- —
Risk factors via First Street. Map © Google.
Why this score? — see what drove the D+ grade
The composite is a weighted blend of 9 inputs, each scored 0–100. Each bar is that input's sub-score; the figure is the points it added to the 100-point composite (weight × sub-score).
- ARV discount +15.0/15.0
- Cash flow +13.7/30.0
- DSCR +4.2/10.0
- Livability +4.0/5.0
- 1% rule +3.9/10.0
- Schools +2.8/10.0
- Condition / age +2.5/5.0
- Rent growth +1.5/5.0
- Appreciation +0.0/10.0
$250,000
🖨 Deal sheet 📄 Offer letter ✓ Due diligence
Listing remarks
Located in an area of Dallas experiencing steady revitalization, this property presents a fantastic opportunity for first-time Buyrs, investors, or anyone looking to add value through cosmetic updates. Priced below market and tax value, this home offers solid potential with room to grow and make it your own. Central HVAC and fully functional, the home can reach full potential with easy cosmetic improvements. The affordable price point and improving neighborhood make this a very attractive investment. Whether you're searching for a starter home, rental property, or renovation project, this home offers the chance to build equity quickly and capitalize on the area's steady growth.
Key facts
- 9,017 sq ft lot
- Built 1951
- Listed 23 days
Property features AI
Finance
- Other: Total living area approximately 1,410
- Financial info: List price is $250,000
- HOA & community: HOA/community details not specified
Exterior
- Parking: Has garage
- Security: Security details not specified
- Utilities: Utility details not specified
- Home design: Single Family Residential; Built in 1951
- Construction: Construction details not specified; Roof/foundation details not specified
- Exterior features: Yard on a 9,017 sq ft lot
Interior
- Kitchen: Standard kitchen (appliances not specified)
- Bedrooms: 3 bedrooms
- Flooring: Flooring details not specified
- Bathrooms: 2 bathrooms
- Heating & cooling: Heating and cooling details not specified
- Interior features: Single-family layout
- Laundry & utility: Laundry/utility details not specified
Neighborhood map
What this means for you Summary
Snapshot
- This is a 4-bed/2.0-bath single-family listed at $250k.
Deal economics
- At list price, monthly cash flow is $20 ($244/yr) — positive.
- The deal already cash-flows at list — no discount required.
- To meet the 1% rule (rent ≥ 1% of price), the offer needs to be $221k (11.5% below list).
- Recommended offer: $221k (11.5% below list) — sets the bar for 1% rule.
- Cap rate 6.4% vs local median 2.3% in Dallas — top-decile yield for the area; either an underpriced asset or a hidden risk that comps aren't pricing in. Stress-test before assuming the spread holds.
Location & tenants
- Location reads 81/100 on livability (#24 in TX, #1,380 nationally) — a professional / high-income tenant draw. Strengths: amenities A+, commute A+, housing A+; Watch: schools C-, crime F.
- Dallas ISD (urban): math 31% / reading 36% proficiency, ranked #559 of 826 in TX (top 68%) — families likely to look elsewhere, expect single-tenant / working-renter base with shorter leases; 83% free/reduced lunch — lower-income household profile, screen leases tightly.
- Market conditions: Rents falling (-3.9%/yr); 161 active listings in the ZIP; 28 comparable units currently listed for rent nearby; rentals at typical pace (median 24d on market — plan ~3-4 weeks tenant-placement turnaround); 12,577 units permitted in Dallas County in 2024 (6,829 in 5+ unit buildings).
- At $2,213/mo this rent would consume 47% of the median local household income ($57k/yr) (locally 2585% of renters already pay >50% of income on rent) — very limited rent-growth headroom before tenants either downsize or default.
Forward outlook
- Local home prices are declining (-3.0%/yr); year-one equity from $2k of loan paydown is wiped out by about $8k of value loss. Plan a longer hold.
- Dallas County population projected at +35% by 2050 — long-run rental-demand tailwind backs the buy-and-hold thesis.
Negotiation context
- It's been on market 23 days — a 2% lower offer ($246k) is reasonable based on typical stale-listing flexibility.
Risks & watch-outs
- Watch-outs: built in 1951 — expect roof / HVAC / electrical / plumbing capex.
Questions for the listing agent
- Built in 1951 — when were the roof, HVAC, electrical panel, plumbing, and water heater last replaced?
- Is there a deadline driving the sale (1031 exchange, divorce, estate, relocation)? That informs how much negotiation room exists.
- Crime grade is F in this area — have there been break-ins, vandalism, or insurance claims at this property in the last 3 years? What carrier currently insures it and at what premium?
- The area grade is low — what's the realistic commute time and amenity access for the typical tenant pool here? Any planned neighborhood developments (good or bad) we should know about?
- What's the average days-on-market for RENTAL listings here right now (not sales)? A rising rental-DOM trend means longer vacancies and softer asking-rent achievability than the comps imply.
- What's the recent tenant-quality profile in this submarket — average credit score on applications, eviction rate, late-payment / NSF rate, and stable-employment percentage? A property-management company in the area should have these aggregated.
- How much new for-sale + rental construction is in the pipeline within 1–3 miles? Heavy new supply typically softens prices + rents 12–24 months out; constrained supply supports both.
Investment metrics
- 1% rule
- 0.89% ✗
- Cap rate
- 6.39%
- Cash-on-cash
- 0.35%
- DSCR
- 1.02
- GRM
- 9.4
CMA / ARV
- ARV (on-the-fly)
- $301,740
- Comps found
- 12
Show comp detail 12 sales within ~0.75 mi
| Address | Dist | Beds/Ba | Sqft | Sold | Price | $/sf | Match |
|---|---|---|---|---|---|---|---|
| 3202 Texas Dr | 0.16mi | 3/1.0 (-1) | 1,387 (-2%) | 10mo | $280,000 | $202 | 72 |
| 2835 Bentley Ave | 0.45mi | 4/1.0 | 1,400 (-1%) | 8mo | $240,000 | $171 | 67 |
| 2553 Clearview Cir | 0.62mi | 4/2.0 | 1,388 (-2%) | 8mo | $332,900 | $240 | 62 |
| 3719 Dutton Dr | 0.65mi | 3/2.0 (-1) | 1,395 (-1%) | 4mo | $299,900 | $215 | 60 |
| 3039 Dutton Dr | 0.23mi | 3/2.0 (-1) | 1,280 (-9%) | 12mo | $312,000 | $244 | 59 |
| 3031 Sharon St | 0.52mi | 3/2.0 (-1) | 1,448 (+3%) | 14mo | $315,200 | $218 | 55 |
| 3350 Glenhaven Blvd | 0.56mi | 3/2.0 (-1) | 1,300 (-8%) | 6mo | $260,000 | $200 | 51 |
| 3037 Grafton Ave | 0.58mi | 3/2.0 (-1) | 1,312 (-7%) | 10mo | $256,000 | $195 | 48 |
| 2541 W Illinois Ave | 0.59mi | 3/1.5 (-1) | 1,260 (-11%) | 7mo | $270,000 | $214 | 42 |
| 3815 Poinsettia Dr | 0.71mi | 3/2.0 (-1) | 1,256 (-11%) | 4mo | $279,900 | $223 | 40 |
| 3731 Poinsettia Dr | 0.66mi | 3/2.0 (-1) | 1,569 (+11%) | 13mo | $291,305 | $186 | 35 |
| 3218 Emmett St | 0.70mi | 3/2.0 (-1) | 1,198 (-15%) | 5mo | $220,000 | $184 | 34 |
Match score weights: distance 35% · size 25% · config 20% · recency 20%. Top-matched comps best support the ARV.
Projected returns pro-forma
-3.0% appreciation · 0.0% rent growth · sell at horizon
- IRR
- -19.2%
- Equity multiple
- 0.35×
- Total profit
- $-45,668
- Equity at exit
- $37,276
- IRR
- -19.6%
- Equity multiple
- 0.10×
- Total profit
- $-63,026
- Equity at exit
- $21,615
Cash invested: $70,000 (down + closing). Projections, not guarantees.
Landlord ↔ Tenant lean methodology
- Overall (STATE)
- 87 Strongly Landlord-Friendly
- State Texas
- 87 Strongly Landlord-Friendly · R+5
- County
- — inherits STATE
- City
- — inherits STATE
ZIP-level market 75211
- Rents YoY
- -3.9%
- Active inventory
- 161
- Price-to-rent
- 9.4×
Monthly cashflow live
- Estimated rent
- $2,213 high interval (Pro) →
- Mortgage (P&I)
- −$1,311
- Tax est. 1.5%
- −$312 /mo · $3,750/yr
- Insurance
- −$104
- HOA
- −$0
- Vacancy / Maint / Mgmt
- −$465
- Net cashflow
- $20
Break-even live
UW: 25.0% down · 7.5% · 30yr · 1.5% tax · 5.0% vac · 8.0% maint · 8.0% mgmt
Financing live
Cash to close
- Down payment
- $62,500
- Closing costs
- $7,500
- Reserves months
- —
- Total cash needed
- —
Loan-product check · same deal, 3 products live
Conventional
25% down · 7.5% · 30yr
- Down + closing
- —
- Monthly P&I
- —
- Monthly cashflow
- —
- DSCR
- —
- Eligible?
- —
Personal DTI + credit; lowest rate.
DSCR
20% down · 8.5% · 30yr
- Down + closing
- —
- Monthly P&I
- —
- Monthly cashflow
- —
- DSCR
- —
- Eligible?
- —
No personal income docs; deal must DSCR.
Hard money
10% down · 12.0% · 12mo
- Down + closing
- —
- Monthly P&I
- —
- Monthly cashflow
- —
- DSCR
- —
- Eligible?
- —
Short-term bridge; refi at stabilization.
Rent comps 28 comps
| Address | Beds | Baths | Sqft | Rent | $/sqft | DOM | Units | Dist |
|---|---|---|---|---|---|---|---|---|
| 2736 Rolinda Dr Dallas, TX | 3.0 | 2.0 | 1250 | $2,150 | $1.72 | 6d | 1 | 0.33mi |
| 2607 Clearview Cir Dallas, TX | 3.0 | 1.5 | 1486 | $1,950 | $1.31 | 7d | 1 | 0.55mi |
| 2925 Spruce Valley Ln Unit 403 Dallas, TX | 3.0 | 2.0 | 1477 | $2,500 | $1.69 | 20d | 1 | 0.72mi |
| 3228 Emmett St Dallas, TX | 3.0 | 1.0 | 1000 | $2,000 | $2.00 | 5d | 1 | 0.73mi |
| 2715 Grafton Ave Dallas, TX | 3.0 | 2.0 | 1403 | $2,650 | $1.89 | 43d | 1 | 0.75mi |
| 2122 Riviera Dr Dallas, TX | 3.0 | 2.0 | 1568 | $2,350 | $1.50 | 4d | 1 | 0.88mi |
| 4002 Falls Dr Dallas, TX | 3.0 | 2.0 | 1078 | $2,000 | $1.86 | 6d | 1 | 0.88mi |
| 2102 Elmwood Blvd Dallas, TX | 3.0 | 2.0 | 1588 | $2,000 | $1.26 | 24d | 1 | 1.04mi |
| 1918 Melbourne Ave Dallas, TX | 3.0 | 2.0 | 1076 | $2,200 | $2.04 | 43d | 1 | 1.11mi |
| 3310 Brooklyndell Ave Dallas, TX | 3.0 | 2.0 | 1400 | $2,300 | $1.64 | 43d | 1 | 1.16mi |
| 2859 W Brooklyn Ave Dallas, TX | 3.0 | 2.0 | 1430 | $2,950 | $2.06 | 43d | 1 | 1.21mi |
| 1819 Barlow Ave Dallas, TX | 4.0 | 2.0 | 1408 | $2,195 | $1.56 | 24d | 1 | 1.23mi |
| 3217 Cedarcroft Ln Dallas, TX | 3.0 | 3.0 | 1558 | $2,200 | $1.41 | 43d | 1 | 1.24mi |
| 3564 Virginia Blvd Dallas, TX | 3.0 | 2.0 | 1327 | $2,150 | $1.62 | 24d | 1 | 1.26mi |
| 3564 Virginia Blvd Dallas, TX | 3.0 | 2.0 | 1327 | $2,000 | $1.51 | 7d | 1 | 1.26mi |
| 1215 S Oak Cliff Blvd Dallas, TX | 3.0 | 2.0 | 1260 | $2,050 | $1.63 | 43d | 1 | 1.27mi |
| 3240 Springwood Ln Dallas, TX | 3.0 | 2.0 | 1840 | $2,099 | $1.14 | 17d | 1 | 1.27mi |
| 1718 Berkley Ave Dallas, TX | 3.0 | 2.0 | 1114 | $2,275 | $2.04 | 43d | 1 | 1.29mi |
| 2730 Gladstone Dr Dallas, TX | 3.0 | 2.0 | 1466 | $2,000 | $1.36 | 4d | 1 | 1.29mi |
| 3202 Noor St Dallas, TX | 4.0 | 2.0 | 1535 | $2,400 | $1.56 | 7d | 1 | 1.30mi |
| 3202 Noor St Dallas, TX | 4.0 | 2.0 | 1535 | $2,400 | $1.56 | 5d | 1 | 1.30mi |
| 4427 Las Haciendas Dr Dallas, TX | 3.0 | 2.0 | 1533 | $2,100 | $1.37 | 43d | 1 | 1.33mi |
| 3235 Noor St Dallas, TX | 4.0 | 2.0 | 1535 | $2,400 | $1.56 | 43d | 1 | 1.35mi |
| 3235 Noor St Dallas, TX | 4.0 | 2.0 | 1535 | $2,400 | $1.56 | 20d | 1 | 1.35mi |
| 3243 Noor St Dallas, TX | 4.0 | 2.0 | 1535 | $2,400 | $1.56 | 7d | 1 | 1.35mi |
| 4520 Wyoming St Dallas, TX | 3.0 | 1.0 | 1250 | $1,750 | $1.40 | 24d | 1 | 1.42mi |
| 1607 McAdams Ave Dallas, TX | 3.0 | 1.0 | 984 | $1,695 | $1.72 | 7d | 1 | 1.48mi |
| 1415 Mountain Lake Rd Dallas, TX | 3.0 | 2.0 | 1190 | $2,200 | $1.85 | 43d | 1 | 1.50mi |
Listing history 13 events
-
2026-06-18days on market $250,000 Active 23 DOM
-
2026-06-17days on market $250,000 Active 22 DOM
-
2026-06-16days on market $250,000 Active 21 DOM
-
2026-06-15days on market $250,000 Active 20 DOM
-
2026-06-13days on market $250,000 Active 18 DOM
-
2026-06-09days on market $250,000 Active 14 DOM
-
2026-06-08days on market $250,000 Active 13 DOM
-
2026-06-07days on market $250,000 Active 12 DOM
-
2026-06-04days on market $250,000 Active 9 DOM
-
2026-06-03days on market $250,000 Active 8 DOM
-
2026-06-02days on market $250,000 Active 7 DOM
-
2026-06-01days on market $250,000 Active 6 DOM
-
2026-05-31days on market $250,000 Active 5 DOM
ⓘ Source: listings_history table (triggers on properties + properties_extension) + one-shot
backfill from property_details.listing_events for pre-trigger history.
Nearby sold comps map
Loading sold comps map…
Walkable amenities ~0.75 mi
Loading nearby amenities…
Taxation est. · year 1
- Rental income
- $26,552
- − Mortgage interest
- −$14,004
- − Property taxes
- −$3,750
- − Insurance
- −$1,250
- − Repairs & maintenance
- −$2,124
- − Management
- −$2,124
- − Depreciation
- −$7,273
- Taxable loss
- −$3,973
- Est. tax savings @ 24.0%
- +$954
- After-tax cash flow
- $1,197/yr
For passive investors: Depreciation is non-cash, so a rental often shows a tax loss while cash-flowing — sheltering income. Rental losses are passive: they offset passive income freely, and up to $25,000/yr can offset ordinary (W-2) income if you actively participate and your MAGI is under $100k (phasing out to $0 by $150k); unused losses carry forward. On sale, claimed depreciation is recaptured at up to 25%, and gains may owe capital-gains tax (a 1031 exchange can defer both). Figures are a year-1 estimate at your 24.0% rate — not tax advice; consult a CPA.
Schools (NCES district)
- District
- Dallas ISD
- NCES district ID
- 4816230
- Math proficiency
- 31% ▼ -16.00%
- Reading proficiency
- 36% ▼ -4.00%
- Median HH income
- $42,881
- Composite
- 28.41/100
- National rank
- #6763
- State rank
- #559 of 826 in TX
Livability — Dallas
- Score
- 81/100
- State rank
- #24
- US rank
- #1380
Category grades
Schools grade is shown separately in the Schools card above.
Census & demographics
- Census place
- Dallas, TX
- County
- Dallas County · 2,612,404 people
- City population
- 1,168,437
- Metro
- Dallas-Fort Worth-Arlington, TX
- Population (ZIP)
- 73,534
- Household income
- $56,807
- Rent vs Own
- Severe rent burden
- 2585.0
Population outlook (Dallas County) Hauer SSP2
- Today (2025)
- 2,979,839 people
- By 2030
- 3,191,823 · +7.1%
- By 2040
- 3,619,611 · +21.5%
- By 2050
- 4,026,915 · +35.1%
- By 2075
- 4,957,073 · +66.4%
- By 2100
- 5,508,725 · +84.9%
Race, ethnicity, and origin ACS 2023
- Neighborhood character
- Predominantly Hispanic (79%)
- Race & ethnicity
- Hispanic / Latino 79% Two or more races 24% White 10% Black 9% Native American 2%
- Hispanic origin (detail)
- Mexican 69%
- Foreign-born
- 32% · Canada
- Languages at home
- 32% English-only · Spanish 67%
Political lean MEDSL · Dallas
- 2024 margin
- Strong D (+22.2) · D 60.2% · R 38.0% · Other 1.8%
- 2008→2024 swing
- +6.9pp toward D · 2008: 15.3pp · 2024: 22.2pp
- All cycles
- 2024: D+22.2 2020: D+31.6 2016: D+26.2 2012: D+15.4 2008: D+15.3
Not yet ingested
- Civics
- —
Market trends
- HPI YoY
- ▼ -233.57%
- Current HPI
- 343.4166
- Rent YoY
- ▼ -3.89%
- Metro
- Dallas-Fort Worth-Arlington, TX
- State GDP YoY
- ▲ 3.95%
- F500 in state
- 110
Industry mix (Fortune 500 HQ in TX)
| Industry | F500 HQs | Revenue |
|---|---|---|
| Energy | 16 | $1,198B |
|
||
| Technology | 5 | $198B |
|
||
| Engineering / Construction | 4 | $72B |
|
||
| Energy Services | 3 | $60B |
|
||
| Utilities | 3 | $41B |
|
||
| Healthcare | 2 | $330B |
|
||
Cash-flow waterfall
monthlySold comps — $/sqft
last 12 mo · ≤1 miLoading sold comps…