45038 387th Ave SE · Columbia, MN
Flood risk 1/10 · Minimal
- FEMA flood zone
- —
- Chance of flooding over 30 yrs
- 0.0%
- Est. flood insurance / yr
- —
Fire risk 5/10 · Moderate
- Est. fire insurance / yr
- $888 – $1,650
Heat risk 1/10 · Minimal
- Hot days now (above 93°F)
- 7 days/yr
- Hot days in 30 yrs
- 12 days/yr
Wind risk 1/10 · Minimal
- Chance of severe wind over 30 yrs
- —
Air-quality risk 3/10 · Minor
- Unhealthy air days now
- 3 days/yr
- Unhealthy air days in 30 yrs
- 3 days/yr
Risk factors via First Street. Map © Google.
Why this score? — see what drove the D- grade
The composite is a weighted blend of 9 inputs, each scored 0–100. Each bar is that input's sub-score; the figure is the points it added to the 100-point composite (weight × sub-score).
- Appreciation +9.3/10.0
- Cash flow +7.6/30.0
- ARV discount +7.5/15.0
- Schools +4.2/10.0
- Rent growth +2.5/5.0
- Livability +2.5/5.0
- Condition / age +2.5/5.0
- 1% rule +2.0/10.0
- DSCR +1.7/10.0
$143,900
🖨 Deal sheet (PDF) 📄 Offer letter ✓ Due diligence
Listing remarks
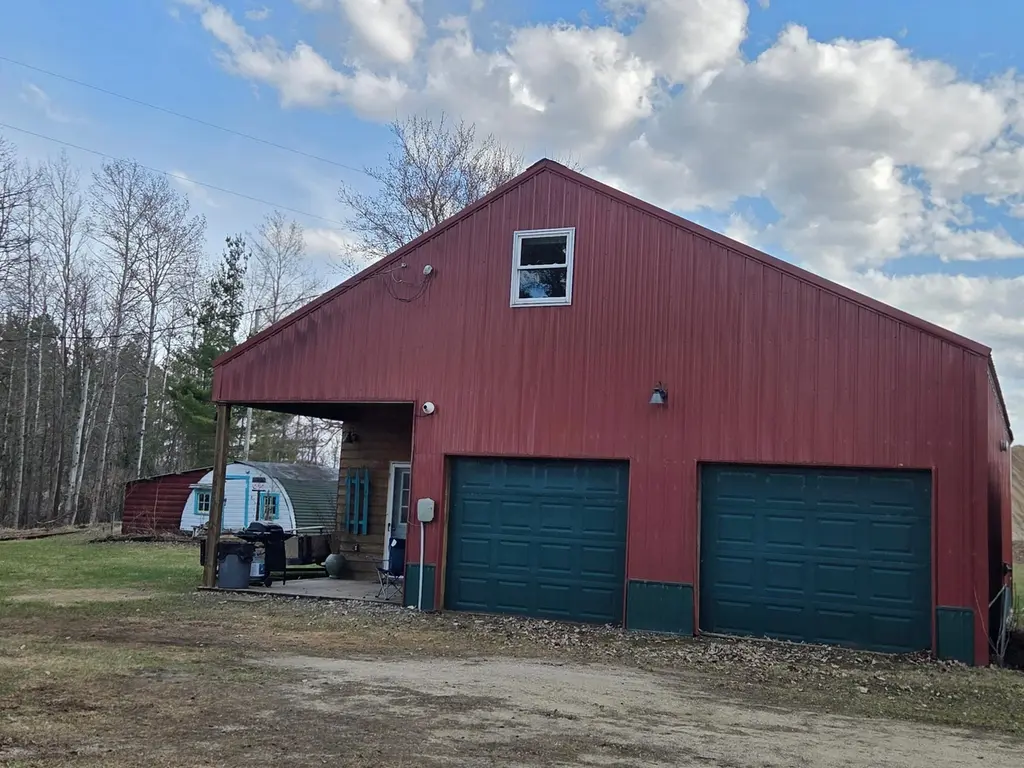
Own a truly distinctive northern Minnesota property just outside Lengby, Minnesota on 1.33 scenic acres. Rich in character and history, this property features an authentic 1890s Surveyor’s Cabin showcasing rustic original construction and distinctive craftsmanship throughout. Inside, you’ll find beautiful live-edge built-in shelves and dressers, two moon roofs that bring in natural light, and unique details that speak to true Up North living. The property also hosts a spacious 3-bedroom, 1.5 bath shouse (shed/house) offering comfortable living space offering a main floor primary bedroom paired with an oversized garage—ideal for storing "toys" or convert to a grea
Key facts
- 1.33 acre lot
- 2 garage spots
- Built 1890
Property features AI
Exterior
- Parking: Attached 2-car garage
- Utilities: Private water source; Private sewer; Electric and propane fuel
- Home design: Residential property; Two levels; Above-grade finished area approximately 1,937 (living area listed)
- Construction: Poured concrete foundation
- Exterior features: Metal exterior
Interior
- Bedrooms: 3 bedrooms
- Bathrooms: 1 full bathroom; 1 half bathroom
- Heating & cooling: Baseboard heating; Forced air heating; No central air
- Interior features: Basement present (no finished basement features listed); Baseboard and forced air heating
Neighborhood map
What this means for you Summary
Snapshot
- This is a 3-bed/1.0-bath single-family listed at $144k.
Deal economics
- At list price, monthly cash flow is $-172 ($-2k/yr) — negative.
- To cash-flow at today's rent, offer at most $114k (21.1% below list).
- To meet the 1% rule (rent ≥ 1% of price), the offer needs to be $100k (30.3% below list).
- Recommended offer: $100k (30.3% below list) — sets the bar for 1% rule.
Location & tenants
- Location reads: area grade D — affects rentability + tenant quality, not the cash-flow math above.
- Fosston Public School District (rural): math 47% / reading 52% proficiency, ranked #134 of 301 in MN (top 44%) — families likely to look elsewhere, expect single-tenant / working-renter base with shorter leases.
- Zoned schools: Magelssen Elementary (math 57% / reading 57%, grade C+, #265 of 857 statewide, top 35%, 343 students, 55% FRL); Fosston Secondary (math 37% / reading 47%, grade F, #222 of 471 statewide, top 50%, 278 students, 54% FRL) — zoned schools average 54% FRL vs 34% district-wide (21 pts higher); higher-poverty schools than district average — tighter screening recommended.
- Market conditions: 7 active listings in the ZIP; 42 units permitted in Polk County in 2024 (0 in 5+ unit buildings).
Forward outlook
- In year one you build about $13k of equity ($995 loan paydown + $12k appreciation (8.7% local appreciation)).
- Polk County population projected to shrink 7% by 2050 — rents likely to lag national; underwrite the cash flow, not the appreciation.
- By year 3, paydown + projected appreciation supports a ~$34k cash-out refi (75% LTV) — recoverable capital for the next deal without selling this one.
Negotiation context
- It's been on market 51 days — a 3% lower offer ($140k) is reasonable based on typical stale-listing flexibility.
- Current owner paid $91k; list at $144k implies a 57% gain — meaningful room to come down on a strong offer.
Risks & watch-outs
- Watch-outs: built in 1890 — expect roof / HVAC / electrical / plumbing capex.
- Climate carrying-cost: moderate wildfire risk — expect insurance premiums to compound above CPI over the hold.
Questions for the listing agent
- What do current leases actually rent for vs. the listed asking? Can we see a recent rent roll and the last 12 months of T-12 income?
- It's been on market 51 days. Have you received any prior offers? Is the seller open to a 30% concession, seller financing, or rate buy-down credit?
- Built in 1890 — when were the roof, HVAC, electrical panel, plumbing, and water heater last replaced?
- Is there a deadline driving the sale (1031 exchange, divorce, estate, relocation)? That informs how much negotiation room exists.
- The area grade is low — what's the realistic commute time and amenity access for the typical tenant pool here? Any planned neighborhood developments (good or bad) we should know about?
- What's the average days-on-market for RENTAL listings here right now (not sales)? A rising rental-DOM trend means longer vacancies and softer asking-rent achievability than the comps imply.
- What's the recent tenant-quality profile in this submarket — average credit score on applications, eviction rate, late-payment / NSF rate, and stable-employment percentage? A property-management company in the area should have these aggregated.
- How much new for-sale + rental construction is in the pipeline within 1–3 miles? Heavy new supply typically softens prices + rents 12–24 months out; constrained supply supports both.
Investment metrics
- 1% rule
- 0.70% ✗
- Cap rate
- 4.86%
- Cash-on-cash
- -5.12%
- DSCR
- 0.77
- GRM
- 12.0
CMA / ARV
No comps found within radius.
Projected returns pro-forma
8.67% appreciation · 3.0% rent growth · sell at horizon
- IRR
- 17.7%
- Equity multiple
- 2.35×
- Total profit
- $54,589
- Equity at exit
- $115,984
- IRR
- 16.7%
- Equity multiple
- 5.15×
- Total profit
- $167,029
- Equity at exit
- $236,886
Cash invested: $40,292 (down + closing). Projections, not guarantees.
Landlord ↔ Tenant lean methodology
- Overall (STATE)
- 46 Balanced
- State Minnesota
- 46 Balanced · D+2
- County
- — inherits STATE
- City
- — inherits STATE
ZIP-level market 56651
- Home prices YoY
- 3.6%
- Active inventory
- 7
- Price-to-rent
- 12.0×
Monthly cashflow live
- Estimated rent
- $1,003 medium interval (Pro) →
- Mortgage (P&I)
- −$755
- Tax from tax record
- −$150 /mo · $1,800/yr
- Insurance
- −$60
- HOA
- −$0
- Lot rent
- −$0
- Vacancy / Maint / Mgmt
- −$211
- Net cashflow
- $-172
Break-even live
Sensitivity live
| Price | -10% $-90 | -5% $-131 | +0% $-172 | +5% $-213 | +10% $-253 |
|---|---|---|---|---|---|
| Rent | -10% $-251 | -5% $-212 | +0% $-172 | +5% $-132 | +10% $-93 |
| Rate | -1.0pp $-99 | -0.5pp $-135 | base $-172 | +0.5pp $-209 | +1.0pp $-247 |
UW: 25.0% down · 7.5% · 30yr · 1.5% tax · 5.0% vac · 8.0% maint · 8.0% mgmt
Financing live
Cash to close
- Down payment
- $35,975
- Closing costs
- $4,317
- Reserves months
- —
- Total cash needed
- —
Loan-product check · same deal, 3 products live
Conventional
25% down · 7.5% · 30yr
- Down + closing
- —
- Monthly P&I
- —
- Monthly cashflow
- —
- DSCR
- —
- Eligible?
- —
Personal DTI + credit; lowest rate.
DSCR
20% down · 8.5% · 30yr
- Down + closing
- —
- Monthly P&I
- —
- Monthly cashflow
- —
- DSCR
- —
- Eligible?
- —
No personal income docs; deal must DSCR.
Hard money
10% down · 12.0% · 12mo
- Down + closing
- —
- Monthly P&I
- —
- Monthly cashflow
- —
- DSCR
- —
- Eligible?
- —
Short-term bridge; refi at stabilization.
Listing history 22 events
-
2026-06-22days on market $143,900 Active 51 DOM
-
2026-06-21days on market $143,900 Active 50 DOM
-
2026-06-21days on market $143,900 Active 49 DOM
-
2026-06-18days on market $143,900 Active 47 DOM
-
2026-06-17days on market $143,900 Active 46 DOM
-
2026-06-16days on market $143,900 Active 45 DOM
-
2026-06-15days on market $143,900 Active 44 DOM
-
2026-06-13days on market $143,900 Active 42 DOM
-
2026-06-12days on market $143,900 Active 41 DOM
-
2026-06-09days on market $143,900 Active 38 DOM
-
2026-06-08days on market $143,900 Active 37 DOM
-
2026-06-07days on market $143,900 Active 36 DOM
-
2026-06-05days on market $143,900 Active 34 DOM
-
2026-06-04days on market $143,900 Active 32 DOM
-
2026-06-02days on market $143,900 Active 31 DOM
-
2026-06-01days on market $143,900 Active 30 DOM
-
2026-05-31days on market $143,900 Active 29 DOM
-
2026-05-31days on market $143,900 Active 28 DOM
-
2026-05-03$159,900 Active 1054-char remark
-
2026-04-30historical $159,900 1054-char remark
-
2021-11-17soldstatus $91,476
-
2020-09-30soldstatus $62,000
ⓘ Source: listings_history table (triggers on properties + properties_extension) + one-shot
backfill from property_details.listing_events for pre-trigger history.
Tax reassessment forecast MN · Partial reset (capped growth)
- Current annual tax
- $1,800 · $150/mo
- Projected year-2 tax
- $1,800 · $150/mo
- Expected delta
- $0/yr ($0/mo · 0.0%)
ⓘ Screening estimate from a state-policy table — verify with the county assessor before closing.
Climate risk First Street
- Flood 1/10 Low 0% chance over 30 yrs
- Wildfire 5/10 Major
- Heat 1/10 Low 7 d/yr ≥93°F today · 12 d/yr by 30 yrs out
- Wind 1/10 Low
- Air quality 3/10 Moderate 3 unhealthy d/yr today · 3 by 30 yrs out
Nearby sold comps map
Loading sold comps map…
Walkable amenities ~0.75 mi
Loading nearby amenities…
Taxation est. · year 1
- Rental income
- $12,041
- − Mortgage interest
- −$8,061
- − Property taxes
- −$1,800
- − Insurance
- −$720
- − Repairs & maintenance
- −$963
- − Management
- −$963
- − Depreciation
- −$4,186
- Taxable loss
- −$4,652
- Est. tax savings @ 24.0%
- +$1,116
- After-tax cash flow
- $-946/yr
For passive investors: Depreciation is non-cash, so a rental often shows a tax loss while cash-flowing — sheltering income. Rental losses are passive: they offset passive income freely, and up to $25,000/yr can offset ordinary (W-2) income if you actively participate and your MAGI is under $100k (phasing out to $0 by $150k); unused losses carry forward. On sale, claimed depreciation is recaptured at up to 25%, and gains may owe capital-gains tax (a 1031 exchange can defer both). Figures are a year-1 estimate at your 24.0% rate — not tax advice; consult a CPA.
Schools (NCES district)
- District
- Fosston Public School District
- NCES district ID
- 2712300
- Math proficiency
- 47% ▼ -13.00%
- Reading proficiency
- 52% ▼ -14.00%
- Median HH income
- $43,823
- Composite
- 41.77/100
- National rank
- #3396
- State rank
- #134 of 301 in MN
Livability — Columbia
No livability data for this city. (Only ~50 U.S. cities are tracked.)
Census & demographics
- Population (ZIP)
- 638
Population outlook (Polk County) Hauer SSP2
- Today (2025)
- 31,123 people
- By 2030
- 30,720 · -1.3%
- By 2040
- 29,806 · -4.2%
- By 2050
- 29,022 · -6.8%
- By 2075
- 27,972 · -10.1%
- By 2100
- 26,953 · -13.4%
Race, ethnicity, and origin ACS 2023
- Neighborhood character
- Predominantly White (80%)
- Race & ethnicity
- White 80% Two or more races 11% Native American 7% Hispanic / Latino 4%
- Common ancestry
- Portuguese 35% Scotch-Irish 5% Scottish 4%
- Languages at home
- 83% English-only · German/W. Germanic 8% Russian/Polish/Slavic 3% Arabic 1%
Political lean MEDSL · Polk
- 2024 margin
- Solid R (+33.8) · D 32.3% · R 66.0% · Other 1.7%
- 2008→2024 swing
- -38.3pp toward R · 2008: 4.6pp · 2024: -33.8pp
- All cycles
- 2024: R+33.8 2020: R+28.4 2016: R+29.0 2012: R+5.8 2008: D+4.6
Not yet ingested
- Civics
- —
Market trends
- HPI YoY
- ▲ 8.67%
- Current HPI
- 246.7725
- Rent YoY
- —
- Metro
- —
- State GDP YoY
- ▲ 2.41%
- F500 in state
- 34
Industry mix (Fortune 500 HQ in MN)
| Industry | F500 HQs | Revenue |
|---|---|---|
| Healthcare | 2 | $407B |
|
||
| Retail | 2 | $150B |
|
||
| Consumer Goods | 2 | $32B |
|
||
| Industrial Machinery | 2 | $6B |
|
||
| Agriculture | 1 | $40B |
|
||
| Healthcare / Medical Devices | 1 | $32B |
|
||
Price history
+132.1% since first listed5 events — show timeline
- 2026-05-26 Price Changed $143,900 NORTHSTARMLS as Distributed by MLS Grid
- 2026-05-03 Listed $159,900 NORTHSTARMLS as Distributed by MLS Grid
- 2026-04-30 Coming Soon $159,900 NORTHSTARMLS as Distributed by MLS Grid
- 2021-11-17 Sold (Public Records) $91,476 Public Records
- 2020-09-30 Sold (Public Records) $62,000 Public Records
Property tax history
+4.0%/yrLatest (2026): $1,800 · -3.3% YoY. Source: county tax records.
Cash-flow waterfall
monthlySold comps — $/sqft
last 12 mo · ≤1 miLoading sold comps…