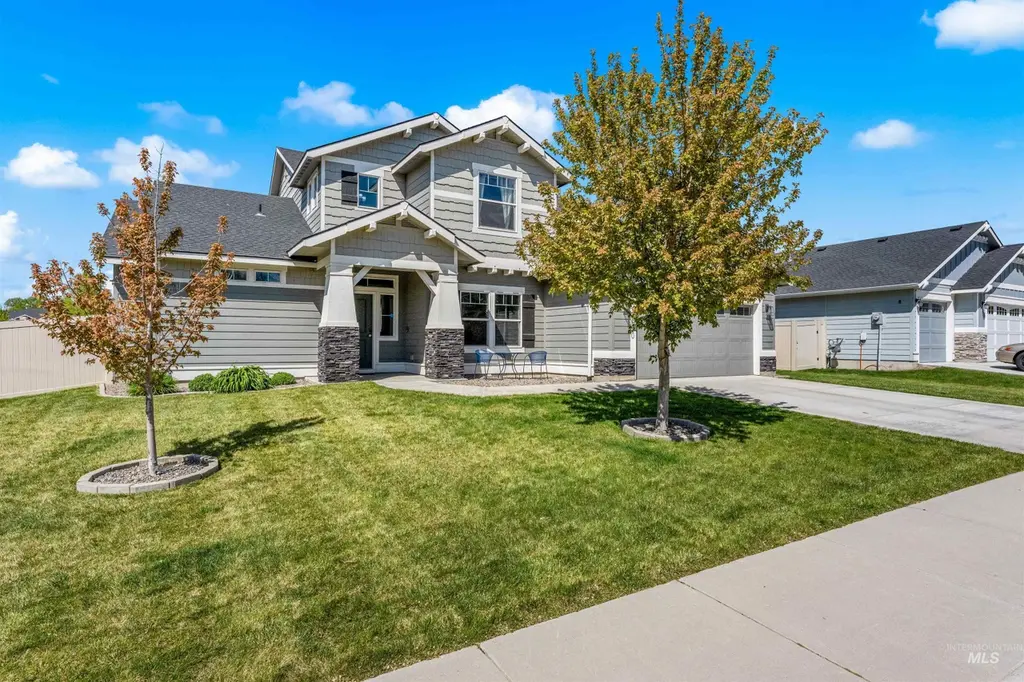
10890 W Sharpthorn · Boise City, ID
Flood risk 5/10 · Moderate
- FEMA flood zone
- X (unshaded)
- Chance of flooding over 30 yrs
- 0.32%
- Est. flood insurance / yr
- $507 – $1,088
Fire risk 6/10 · Moderate
- Est. fire insurance / yr
- $584 – $1,086
Heat risk 5/10 · Moderate
- Hot days now (above 96°F)
- 7 days/yr
- Hot days in 30 yrs
- 18 days/yr
Wind risk 1/10 · Minimal
- Chance of severe wind over 30 yrs
- —
Air-quality risk 8/10 · Major
- Unhealthy air days now
- 14 days/yr
- Unhealthy air days in 30 yrs
- 19 days/yr
Risk factors via First Street. Map © Google.
Why this score? — see what drove the D+ grade
The composite is a weighted blend of 9 inputs, each scored 0–100. Each bar is that input's sub-score; the figure is the points it added to the 100-point composite (weight × sub-score).
- ARV discount +15.0/15.0
- Cash flow +11.9/30.0
- Schools +5.2/10.0
- Rent growth +3.6/5.0
- DSCR +3.5/10.0
- Livability +2.5/5.0
- Condition / age +2.5/5.0
- 1% rule +2.3/10.0
- Appreciation +0.0/10.0
$540,000
🖨 Deal sheet 📄 Offer letter ✓ Due diligence
Listing remarks
Welcome to the Caden Creek community, where space, functionality, and comfort come together beautifully. This thoughtfully designed home offers 5 bedrooms plus a versatile loft and office, giving you room to live, work, and grow. The main level features a spacious primary suite with a walk in closet, creating a private retreat separate from the rest of the home. You will also find a dedicated office, a large laundry room, and an open concept kitchen and living area that is perfect for everyday living and entertaining. Upstairs, you will find three additional bedrooms, a full bathroom, and a generous loft or bonus space, ideal for a playroom, media room, or second living area. Step outside t
Key facts
- Open concept kitchen
- Dedicated office
- Versatile loft
Tags
Property features AI
Finance
- Other: Located in Boise South area
- HOA & community: Homeowners association with semi-annual dues of $350; Subdivision: Caden Creek
Exterior
- Parking: Attached tandem garage with room for 3 vehicles; 3 covered parking spaces
- Utilities: City water service; Sewer connected
- Home design: Single-family residence; Built in 2019
- Construction: Frame construction; Composition roof
- Exterior features: Metal and vinyl fencing; Auto sprinkler system; Standard suburban lot (approx. 6000–9999 sq ft)
Interior
- Kitchen: Granite counters; Dishwasher; Disposal; Microwave; Freestanding oven/range; Refrigerator; Pantry
- Bedrooms: 5 bedrooms — primary on the main level; remaining bedrooms on the upper level; Bedroom sizes include approximately 14 x 14 (primary), 11 x 11, 10 x 10, 10 x 11, and 11 x 11; Main-level office (approx. 11 x 10)
- Flooring: Tile; Carpet; Laminate
- Bathrooms: 3 bathrooms
- Heating & cooling: Forced air heating; Central air conditioning
- Interior features: Den/office; Family room; Rec/bonus room; Walk-in closets; Pantry; Granite counters
- Laundry & utility: Gas water heater
Neighborhood map
What this means for you Summary
Snapshot
- This is a 5-bed/3.0-bath single-family listed at $540k.
Deal economics
- At list price, monthly cash flow is $-135 ($-2k/yr) — negative.
- To cash-flow at today's rent, offer at most $516k (4.4% below list).
- To meet the 1% rule (rent ≥ 1% of price), the offer needs to be $392k (27.4% below list).
- Recommended offer: $392k (27.4% below list) — sets the bar for 1% rule.
- Cap rate 6.0% vs local median 2.6% in Boise City — top-decile yield for the area; either an underpriced asset or a hidden risk that comps aren't pricing in. Stress-test before assuming the spread holds.
Location & tenants
- Location reads: area grade D — affects rentability + tenant quality, not the cash-flow math above.
- Joint School District No. 2 (suburban): math 53% / reading 67% proficiency, ranked #11 of 92 in ID (top 12%) — acceptable for families but not a draw, mixed tenant base, ~2y average lease.
- Zoned schools: Lake Hazel Elementary School (math 57% / reading 57%, grade C+, #88 of 357 statewide, top 28%, 390 students, 26% FRL); Mountain View High School (math 42% / reading 72%, grade C, #21 of 169 statewide, top 13%, 2,462 students, 16% FRL) — zoned schools at 21% FRL track the district average.
- Market conditions: Rents rising fast (+4.3%/yr); 296 active listings in the ZIP; 2 comparable units currently listed for rent nearby; solid renter incomes; 5,129 units permitted in Ada County in 2024 (414 in 5+ unit buildings).
- At $3,920/mo this rent would consume 51% of the median local household income ($93k/yr) (locally 569% of renters already pay >50% of income on rent) — very limited rent-growth headroom before tenants either downsize or default.
Forward outlook
- Local home prices are declining (-3.0%/yr); year-one equity from $4k of loan paydown is wiped out by about $16k of value loss. Plan a longer hold.
- Ada County population projected at +45% by 2050 — long-run rental-demand tailwind backs the buy-and-hold thesis.
Negotiation context
- Only 4 days on market — expect competitive offers; lowballing is unlikely to land.
- 3 sale attempts since 7y ago with the ask held roughly flat each time — persistent listings suggest the price (not the market) is what's stuck; bring a comps-based counter.
Risks & watch-outs
- Climate carrying-cost: moderate flood risk; major wildfire risk; extreme-heat days projected 7→18/yr by 2055 (HVAC capex compounding) — expect insurance premiums to compound above CPI over the hold.
Questions for the listing agent
- What do current leases actually rent for vs. the listed asking? Can we see a recent rent roll and the last 12 months of T-12 income?
- What does the HOA fee cover, when was the last increase, and are there any pending special assessments or reserve-fund shortfalls?
- Is there a deadline driving the sale (1031 exchange, divorce, estate, relocation)? That informs how much negotiation room exists.
- The area grade is low — what's the realistic commute time and amenity access for the typical tenant pool here? Any planned neighborhood developments (good or bad) we should know about?
- What's the average days-on-market for RENTAL listings here right now (not sales)? A rising rental-DOM trend means longer vacancies and softer asking-rent achievability than the comps imply.
- What's the recent tenant-quality profile in this submarket — average credit score on applications, eviction rate, late-payment / NSF rate, and stable-employment percentage? A property-management company in the area should have these aggregated.
- How much new for-sale + rental construction is in the pipeline within 1–3 miles? Heavy new supply typically softens prices + rents 12–24 months out; constrained supply supports both.
Investment metrics
- 1% rule
- 0.73% ✗
- Cap rate
- 5.99%
- Cash-on-cash
- -1.07%
- DSCR
- 0.95
- GRM
- 11.5
CMA / ARV
- ARV (on-the-fly)
- $661,313
- Comps found
- 12
Show comp detail 12 sales within ~0.75 mi
| Address | Dist | Beds/Ba | Sqft | Sold | Price | $/sf | Match |
|---|---|---|---|---|---|---|---|
| 10890 W Sharpthorn | 0.00mi | 5/2.5 | 2,767 (0%) | 0mo | $540,000 | $195 | 98 |
| 4877 S Pinto Ave | 0.05mi | 5/2.0 | 2,768 (0%) | 10mo | $549,900 | $199 | 85 |
| 10889 W Harness St | 0.07mi | 4/2.5 (-1) | 2,615 (-6%) | 6mo | $540,000 | $207 | 76 |
| 11538 W Sharpthorn Dr | 0.39mi | 4/3.0 (-1) | 2,812 (+2%) | 1mo | $699,900 | $249 | 73 |
| 10990 W Highlander Dr | 0.10mi | 4/2.5 (-1) | 2,514 (-9%) | 1mo | $799,990 | $318 | 72 |
| 11286 W Highlander Rd | 0.27mi | 4/2.0 (-1) | 2,584 (-7%) | 1mo | $724,990 | $281 | 67 |
| 4875 S Townsend Pl | 0.37mi | 4/3.0 (-1) | 2,932 (+6%) | 9mo | $699,900 | $239 | 60 |
| 4270 S Varian Ave | 0.64mi | 4/3.5 (-1) | 2,855 (+3%) | 1mo | $698,000 | $244 | 57 |
| 5660 S Moon Land | 0.52mi | 4/2.5 (-1) | 2,982 (+8%) | 4mo | $520,000 | $174 | 52 |
| 10860 W Mohawk | 0.71mi | 4/2.0 (-1) | 2,535 (-8%) | 3mo | $600,000 | $237 | 41 |
| 9939 W Arabian Dr | 0.71mi | 4/2.0 (-1) | 2,557 (-8%) | 8mo | $534,900 | $209 | 38 |
| 10258 W Brownstone Dr | 0.69mi | 4/2.5 (-1) | 2,400 (-13%) | 3mo | $575,000 | $240 | 36 |
Match score weights: distance 35% · size 25% · config 20% · recency 20%. Top-matched comps best support the ARV.
Projected returns pro-forma
-3.0% appreciation · 4.26% rent growth · sell at horizon
- IRR
- -16.9%
- Equity multiple
- 0.40×
- Total profit
- $-91,325
- Equity at exit
- $80,516
- IRR
- -7.0%
- Equity multiple
- 0.53×
- Total profit
- $-70,429
- Equity at exit
- $46,689
Cash invested: $151,200 (down + closing). Projections, not guarantees.
Landlord ↔ Tenant lean methodology
- Overall (STATE)
- 91 Strongly Landlord-Friendly
- State Idaho
- 91 Strongly Landlord-Friendly · R+18
- County
- — inherits STATE
- City
- — inherits STATE
ZIP-level market 83709
- Rents YoY
- 4.3%
- Active inventory
- 296
- Price-to-rent
- 11.5×
Monthly cashflow live
- Estimated rent
- $3,920 medium interval (Pro) →
- Mortgage (P&I)
- −$2,832
- Tax from tax record
- −$117 /mo · $1,402/yr
- Insurance
- −$225
- HOA
- −$58
- Vacancy / Maint / Mgmt
- −$823
- Net cashflow
- $-135
Break-even live
UW: 25.0% down · 7.5% · 30yr · 1.5% tax · 5.0% vac · 8.0% maint · 8.0% mgmt
Financing live
Cash to close
- Down payment
- $135,000
- Closing costs
- $16,200
- Reserves months
- —
- Total cash needed
- —
Loan-product check · same deal, 3 products live
Conventional
25% down · 7.5% · 30yr
- Down + closing
- —
- Monthly P&I
- —
- Monthly cashflow
- —
- DSCR
- —
- Eligible?
- —
Personal DTI + credit; lowest rate.
DSCR
20% down · 8.5% · 30yr
- Down + closing
- —
- Monthly P&I
- —
- Monthly cashflow
- —
- DSCR
- —
- Eligible?
- —
No personal income docs; deal must DSCR.
Hard money
10% down · 12.0% · 12mo
- Down + closing
- —
- Monthly P&I
- —
- Monthly cashflow
- —
- DSCR
- —
- Eligible?
- —
Short-term bridge; refi at stabilization.
Rent comps 2 comps
| Address | Beds | Baths | Sqft | Rent | $/sqft | DOM | Units | Dist |
|---|---|---|---|---|---|---|---|---|
| 6346 S Rohanna Way Boise, ID | 4.0 | 2.5 | 2005 | $2,550 | $1.27 | 3d | 1 | 0.88mi |
| 10053 W Lyrical Dr Unit 1470095P Boise, ID | 4.0 | 2.5 | 2992 | $6,264 | $2.09 | 14d | 1 | 1.24mi |
HOA detail
- Monthly dues
- $58 · $696/yr
Listing history 17 events
-
2026-05-06status Pending
-
2026-05-06status Active
-
2026-05-05status Pending
-
2026-05-01$540,000 Active
-
2020-05-26status Pending
-
2020-04-25price $404,990
-
2020-04-17price $407,990
-
2020-04-03price $409,990
-
2020-02-15price $417,990
-
2020-01-23price $407,990
-
2019-12-31price $409,990
-
2019-12-13price $414,990
-
2019-11-19price $422,990
-
2019-10-23price $424,990
-
2019-09-10price $428,580
-
2019-06-22price $432,012
-
2019-06-13$429,422 Active
ⓘ Source: listings_history table (triggers on properties + properties_extension) + one-shot
backfill from property_details.listing_events for pre-trigger history.
Tax reassessment forecast ID · Resets to sale price
- Current annual tax
- $1,402 · $117/mo
- Projected year-2 tax
- $3,726 · $310/mo
- Expected delta
- +$2,324/yr (+$194/mo · 165.8%)
ⓘ Screening estimate from a state-policy table — verify with the county assessor before closing.
Climate risk First Street
- Flood 5/10 Major FEMA zone X (unshaded) · 32% chance over 30 yrs
- Wildfire 6/10 Major
- Heat 5/10 Major 7 d/yr ≥96°F today · 18 d/yr by 30 yrs out
- Wind 1/10 Low
- Air quality 8/10 Severe 14 unhealthy d/yr today · 19 by 30 yrs out
Nearby sold comps map
Loading sold comps map…
Walkable amenities ~0.75 mi
Loading nearby amenities…
Taxation est. · year 1
- Rental income
- $47,036
- − Mortgage interest
- −$30,248
- − Property taxes
- −$1,402
- − Insurance
- −$2,700
- − Repairs & maintenance
- −$3,763
- − Management
- −$3,763
- − HOA
- −$696
- − Depreciation
- −$15,709
- Taxable loss
- −$11,245
- Est. tax savings @ 24.0%
- +$2,699
- After-tax cash flow
- $1,078/yr
For passive investors: Depreciation is non-cash, so a rental often shows a tax loss while cash-flowing — sheltering income. Rental losses are passive: they offset passive income freely, and up to $25,000/yr can offset ordinary (W-2) income if you actively participate and your MAGI is under $100k (phasing out to $0 by $150k); unused losses carry forward. On sale, claimed depreciation is recaptured at up to 25%, and gains may owe capital-gains tax (a 1031 exchange can defer both). Figures are a year-1 estimate at your 24.0% rate — not tax advice; consult a CPA.
Schools (NCES district)
- District
- Joint School District No. 2
- NCES district ID
- 1602100
- Math proficiency
- 53% ▼ -6.00%
- Reading proficiency
- 67% ▼ -1.00%
- Median HH income
- $64,573
- Composite
- 52.42/100
- National rank
- #1576
- State rank
- #11 of 92 in ID
Livability — Boise City
No livability data for this city. (Only ~50 U.S. cities are tracked.)
Census & demographics
- County
- Ada County · 522,161 people
- City population
- 152,689
- Metro
- Boise City, ID
- Population (ZIP)
- 58,928
- Household income
- $92,786
- Rent vs Own
- Severe rent burden
- 569.0
Population outlook (Ada County) Hauer SSP2
- Today (2025)
- 535,818 people
- By 2030
- 585,751 · +9.3%
- By 2040
- 682,435 · +27.4%
- By 2050
- 775,818 · +44.8%
- By 2075
- 994,458 · +85.6%
- By 2100
- 1,148,884 · +114.4%
Race, ethnicity, and origin ACS 2023
- Neighborhood character
- Predominantly White (82%)
- Race & ethnicity
- White 82% Hispanic / Latino 8% Two or more races 7% Asian 3% Black 2%
- Hispanic origin (detail)
- Mexican 5%
- Common ancestry
- Portuguese 4% Slovak 3% Lithuanian 3%
- Foreign-born
- 7% · Canada, China, Vietnam
- Languages at home
- 90% English-only · Spanish 3% Russian/Polish/Slavic 1% Other Indo-European 1%
Political lean MEDSL · Ada
- 2024 margin
- R (+10.3) · D 43.4% · R 53.8% · Other 2.8%
- 2008→2024 swing
- -4.2pp toward R · 2008: -6.2pp · 2024: -10.3pp
- All cycles
- 2024: R+10.3 2020: R+3.9 2016: R+9.2 2012: R+11.3 2008: R+6.2
Not yet ingested
- Civics
- —
Market trends
- HPI YoY
- ▼ -379.92%
- Current HPI
- 358.8386
- Rent YoY
- ▲ 4.26%
- Metro
- Boise City, ID
- State GDP YoY
- ▲ 4.51%
- F500 in state
- 6
Industry mix (Fortune 500 HQ in ID)
| Industry | F500 HQs | Revenue |
|---|---|---|
| Retail | 1 | $79B |
|
||
| Technology | 1 | $25B |
|
||
| Food / Agriculture | 1 | $6B |
|
||
Price history
+25.8% since first listed17 events — show timeline
- 2026-05-06 Pending — IMLS
- 2026-05-06 Relisted — IMLS
- 2026-05-05 Pending — IMLS
- 2026-05-01 Listed $540,000 IMLS
- 2020-05-26 Pending — IMLS
- 2020-04-25 Price Changed $404,990 IMLS
- 2020-04-17 Price Changed $407,990 IMLS
- 2020-04-03 Price Changed $409,990 IMLS
- 2020-02-15 Price Changed $417,990 IMLS
- 2020-01-23 Price Changed $407,990 IMLS
- 2019-12-31 Price Changed $409,990 IMLS
- 2019-12-13 Price Changed $414,990 IMLS
- 2019-11-19 Price Changed $422,990 IMLS
- 2019-10-23 Price Changed $424,990 IMLS
- 2019-09-10 Price Changed $428,580 IMLS
- 2019-06-22 Price Changed $432,012 IMLS
- 2019-06-13 Listed $429,422 IMLS
Property tax history
-2.6%/yrLatest (2025): $1,402 · -2.6% YoY. Source: county tax records.
Cash-flow waterfall
monthlySold comps — $/sqft
last 12 mo · ≤1 miLoading sold comps…