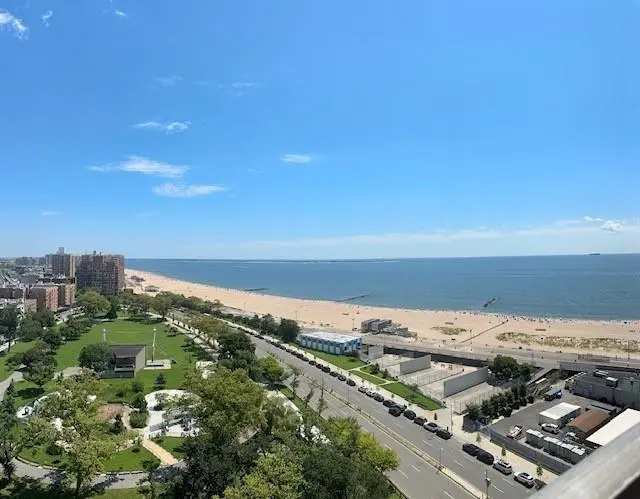
501 Surf Ave Unit 13S · New York, NY
Flood risk 7/10 · Major
- FEMA flood zone
- X (shaded)
- Chance of flooding over 30 yrs
- 0.87%
- Est. flood insurance / yr
- $507 – $1,088
Fire risk 1/10 · Minimal
- Est. fire insurance / yr
- $691 – $1,283
Heat risk 6/10 · Moderate
- Hot days now (above 97°F)
- 6 days/yr
- Hot days in 30 yrs
- 14 days/yr
Wind risk 8/10 · Major
- Chance of severe wind over 30 yrs
- 80.0%
Air-quality risk 4/10 · Minor
- Unhealthy air days now
- 5 days/yr
- Unhealthy air days in 30 yrs
- 7 days/yr
Risk factors via First Street. Map © Google.
Why this score? — see what drove the D- grade
The composite is a weighted blend of 9 inputs, each scored 0–100. Each bar is that input's sub-score; the figure is the points it added to the 100-point composite (weight × sub-score).
- ARV discount +7.5/15.0
- Appreciation +7.5/10.0
- Cash flow +5.4/30.0
- Schools +5.0/10.0
- Rent growth +4.3/5.0
- Livability +3.8/5.0
- Condition / age +2.5/5.0
- 1% rule +1.5/10.0
- DSCR +0.0/10.0
$525,000
🖨 Deal sheet (PDF) 📄 Offer letter ✓ Due diligence
Listing remarks
* * Brighton Beach – Brightwater Towers Condo * * NOTE Tenant occupied – can be sold with the tenant in place. Please allow a few days’ notice for showings. Largest and most desirable line in Brightwater Towers Condo. Spacious 1-bedroom apartment featuring a large living room/dining room combo, updated galley kitchen, and renovated bathroom. The bedroom includes a walk-in closet. Abundant closet space throughout. Common charges include all major utilities, including electricity. Low yearly taxes. Enjoy gorgeous ocean views from every room and a large private balcony. Full-service luxury oceanfront building with 24-hour security, outdoor heated pool and kiddie pool,
Key facts
- Pool
- Built 1964
- Listed 72 days
Property features AI
Finance
- Other: Building amenities include exercise room
- Financial info: Financing considered: exchange, bank mortgage, or cash; Typical down payment requirement noted (10%)
- HOA & community: Monthly maintenance fee; Maintenance includes parking and storage; Management by BWT; Manager phone available; Pets allowed (cats and dogs); Handicap accessible
Exterior
- Parking: Outdoor parking area; Parking included in maintenance
- Security: Full-time doorman; Card-operated door; Secure lobby; Security patrol; Resident superintendent
- Utilities: Electric; Gas; Heat; Water
- Home design: Residential unit in a detached building; Located on the 13th floor
- Construction: Detached building; Storage rooms available; Building contains 736 units
- Exterior features: Waterfront present; Balcony/terrace
Interior
- Kitchen: Galley kitchen; Microwave; Refrigerator
- Bedrooms: One bedroom on the first floor
- Flooring: Hardwood floors
- Bathrooms: One full bathroom on the first floor
- Heating & cooling: Central heating; Electric and gas utilities available
- Interior features: Central A/C with 2 units; Elevator; Laundry area; Microwave; Pool; Refrigerator; Terrace
- Laundry & utility: Laundry area; Card-operated laundry in the building
Neighborhood map
What this means for you Summary
Snapshot
- This is a 1-bed/1.0-bath condo listed at $525k.
Deal economics
- At list price, monthly cash flow is $-1k ($-15k/yr) — negative.
- To cash-flow at today's rent, offer at most $437k (16.7% below list).
- To meet the 1% rule (rent ≥ 1% of price), the offer needs to be $343k (34.6% below list).
- Recommended offer: $343k (34.6% below list) — sets the bar for 1% rule.
- Cap rate 3.7% vs local median 2.6% in New York — top-decile yield for the area; either an underpriced asset or a hidden risk that comps aren't pricing in. Stress-test before assuming the spread holds.
Location & tenants
- Location reads 75/100 on livability (#268 in NY, #4,188 nationally) — a middle-class / working-renter tenant base. Strengths: amenities A+, commute A+, health & safety A; Watch: crime F, cost of living F.
- Zoned schools: Elm Tree Elementary School (math 27% / reading 52%, grade F, #1,444 of 2,108 statewide, top 71%, 806 students, 94% FRL); Is 98 Bay Academy (math 96% / reading 96%, grade A+, #2 of 729 statewide, top 0%, 1,488 students, 63% FRL); Midwood High School (math 94% / reading 96%, grade A+, #83 of 1,100 statewide, top 8%, 4,062 students, 73% FRL).
- Market conditions: Rents rising fast (+7.0%/yr); 114 active listings in the ZIP; 9 comparable units currently listed for rent nearby; rentals at typical pace (median 27d on market — plan ~3-4 weeks tenant-placement turnaround); lower-income renter base — watch delinquency; 10,063 units permitted in Kings County in 2024 (9,789 in 5+ unit buildings).
- At $3,432/mo this rent would consume 94% of the median local household income ($44k/yr) (locally 4426% of renters already pay >50% of income on rent) — very limited rent-growth headroom before tenants either downsize or default.
Forward outlook
- In year one you build about $30k of equity ($4k loan paydown + $26k appreciation (5.0% local appreciation)).
- Kings County population projected at +13% by 2050 — modest demand growth; plan on rents tracking national, not racing it.
- By year 2, paydown + projected appreciation supports a ~$48k cash-out refi (75% LTV) — recoverable capital for the next deal without selling this one.
Negotiation context
- It's been on market 72 days — a 6% lower offer ($494k) is reasonable based on typical stale-listing flexibility.
- Current owner paid $420k; 25% above their basis — modest negotiation headroom, anchor on the comps not their cost.
Risks & watch-outs
- Watch-outs: flood insurance adds $66/mo; HOA is 21% of rent.
- Climate carrying-cost: major flood risk; severe wind risk, 80% chance of damaging wind over 30y; extreme-heat days projected 6→14/yr by 2055 (HVAC capex compounding) — expect insurance premiums to compound above CPI over the hold.
Questions for the listing agent
- What do current leases actually rent for vs. the listed asking? Can we see a recent rent roll and the last 12 months of T-12 income?
- It's been on market 72 days. Have you received any prior offers? Is the seller open to a 35% concession, seller financing, or rate buy-down credit?
- Built in 1964 — when were the roof, HVAC, electrical panel, plumbing, and water heater last replaced?
- What's the actual annual flood-insurance premium (NFIP or private), and is the property in a SFHA with mandatory coverage?
- What does the HOA fee cover, when was the last increase, and are there any pending special assessments or reserve-fund shortfalls?
- Any open or pending special assessments — roof, HVAC, plumbing, elevator, façade? What's the per-unit balance and payoff schedule, and is the seller paying it off at close or rolling it to the buyer?
- Why hasn't it sold? Are there any deal-killer items the seller is aware of (foundation, flood, title, zoning, code violations)?
- Is there a deadline driving the sale (1031 exchange, divorce, estate, relocation)? That informs how much negotiation room exists.
- Schools are B-rated — typically a magnet for longer-tenancy family renters. What's the average tenant stay here, and is there a school-zone premium baked into asking?
- Crime grade is F in this area — have there been break-ins, vandalism, or insurance claims at this property in the last 3 years? What carrier currently insures it and at what premium?
- The area grade is low — what's the realistic commute time and amenity access for the typical tenant pool here? Any planned neighborhood developments (good or bad) we should know about?
- What's the average days-on-market for RENTAL listings here right now (not sales)? A rising rental-DOM trend means longer vacancies and softer asking-rent achievability than the comps imply.
- What's the recent tenant-quality profile in this submarket — average credit score on applications, eviction rate, late-payment / NSF rate, and stable-employment percentage? A property-management company in the area should have these aggregated.
- How much new apartment / multifamily construction is in the pipeline within 1–3 miles? Heavy new supply (>2% of stock underway) typically softens rents 12–24 months out; light construction supports rent growth.
Investment metrics
- 1% rule
- 0.65% ✗
- Cap rate
- 3.68%
- Cash-on-cash
- -9.34%
- DSCR
- 0.58
- GRM
- 12.7
CMA / ARV
No comps found within radius.
Projected returns pro-forma
4.98% appreciation · 7.03% rent growth · sell at horizon
- IRR
- 6.0%
- Equity multiple
- 1.40×
- Total profit
- $58,076
- Equity at exit
- $296,937
- IRR
- 9.7%
- Equity multiple
- 2.88×
- Total profit
- $276,437
- Equity at exit
- $511,998
Cash invested: $147,000 (down + closing). Projections, not guarantees.
Landlord ↔ Tenant lean methodology
- Overall (CITY)
- 0 Strongly Tenant-Friendly
- State New York
- 15 Strongly Tenant-Friendly · D+10
- County
- — inherits STATE
- City New York
- 0 Strongly Tenant-Friendly · D+34
ZIP-level market 11224
- Home prices YoY
- 1.0%
- Rents YoY
- 7.0%
- Active inventory
- 114
- Price-to-rent
- 12.7×
Monthly cashflow live
- Estimated rent
- $3,432 high interval (Pro) →
- Mortgage (P&I)
- −$2,753
- Tax from tax record
- −$171 /mo · $2,046/yr
- Insurance
- −$219
- Flood insurance flood zone
- −$66 /mo · $798/yr
- HOA est. from 1 same-building comp
- −$713
- Vacancy / Maint / Mgmt
- −$721
- Net cashflow
- $-1,211
Break-even live
Sensitivity live
| Price | -10% $-913 | -5% $-1,062 | +0% $-1,211 | +5% $-1,359 | +10% $-1,508 |
|---|---|---|---|---|---|
| Rent | -10% $-1,482 | -5% $-1,346 | +0% $-1,211 | +5% $-1,075 | +10% $-939 |
| Rate | -1.0pp $-946 | -0.5pp $-1,077 | base $-1,211 | +0.5pp $-1,347 | +1.0pp $-1,485 |
UW: 25.0% down · 7.5% · 30yr · 1.5% tax · 5.0% vac · 8.0% maint · 8.0% mgmt
Financing live
Cash to close
- Down payment
- $131,250
- Closing costs
- $15,750
- Reserves months
- —
- Total cash needed
- —
Loan-product check · same deal, 3 products live
Conventional
25% down · 7.5% · 30yr
- Down + closing
- —
- Monthly P&I
- —
- Monthly cashflow
- —
- DSCR
- —
- Eligible?
- —
Personal DTI + credit; lowest rate.
DSCR
20% down · 8.5% · 30yr
- Down + closing
- —
- Monthly P&I
- —
- Monthly cashflow
- —
- DSCR
- —
- Eligible?
- —
No personal income docs; deal must DSCR.
Hard money
10% down · 12.0% · 12mo
- Down + closing
- —
- Monthly P&I
- —
- Monthly cashflow
- —
- DSCR
- —
- Eligible?
- —
Short-term bridge; refi at stabilization.
Rent comps 9 comps
| Address | Beds | Baths | Sqft | Rent | $/sqft | DOM | Units | Dist |
|---|---|---|---|---|---|---|---|---|
| 532 Neptune Ave Brooklyn, NY | 1.0–3.0 | 1.0–2.0 | 948 | $3,375 | $3.56 | 1d | 8 | 0.23mi |
| 2971 Shell Rd Unit 720 Brooklyn, NY | 2.0 | 2.0 | 920 | $4,100 | $4.46 | 26d | 1 | 0.31mi |
| 2971 Shell Rd Unit 704 Brooklyn, NY | 2.0 | 1.0 | 826 | $3,950 | $4.78 | 26d | 1 | 0.31mi |
| 2971 Shell Rd Unit 711 Brooklyn, NY | 2.0 | 2.0 | 907 | $4,200 | $4.63 | 26d | 1 | 0.31mi |
| 2971 Shell Rd Unit 508 Brooklyn, NY | 2.0 | 2.0 | 930 | $4,099 | $4.41 | 26d | 1 | 0.31mi |
| 2971 Shell Rd Unit 406 Brooklyn, NY | 2.0 | 2.0 | 920 | $3,550 | $3.86 | 26d | 1 | 0.31mi |
| 2971 Shell Rd Unit 612 Brooklyn, NY | 2.0 | 2.0 | 907 | $4,150 | $4.58 | 26d | 1 | 0.31mi |
| 1515 Surf Ave Brooklyn, NY | 1.0–2.0 | 1.0 | 706 | $3,220 | $4.56 | 0d | 16 | 0.47mi |
| 2483 W 16th St Brooklyn, NY | 1.0 | 1.0 | 800 | $1,800 | $2.25 | 22d | 1 | 0.94mi |
HOA detail condo
- Monthly dues
- $0 · $0/yr
- Likely covers
- waterelectricpoolsecurity
- Assessments
- None detected in remarks — confirm with the listing agent.
Listing history 15 events
-
2026-06-21days on market $525,000 Active 72 DOM
-
2026-06-18days on market $525,000 Active 69 DOM
-
2026-06-17days on market $525,000 Active 68 DOM
-
2026-06-15days on market $525,000 Active 66 DOM
-
2026-06-13days on market $525,000 Active 64 DOM
-
2026-06-10days on market $525,000 Active 60 DOM
-
2026-06-08days on market $525,000 Active 59 DOM
-
2026-06-08days on market $525,000 Active 58 DOM
-
2026-06-04days on market $525,000 Active 55 DOM
-
2026-06-03days on market $525,000 Active 54 DOM
-
2026-06-01days on market $525,000 Active 52 DOM
-
2026-05-31days on market $525,000 Active 51 DOM
-
2026-04-10$525,000 Active
-
2020-03-19soldstatus $420,000
-
1994-05-18soldstatus $108,500
ⓘ Source: listings_history table (triggers on properties + properties_extension) + one-shot
backfill from property_details.listing_events for pre-trigger history.
Tax reassessment forecast NY · Partial reset (capped growth)
- Current annual tax
- $2,046 · $171/mo
- Projected year-2 tax
- $5,459 · $455/mo
- Expected delta
- +$3,413/yr (+$284/mo · 166.8%)
ⓘ Screening estimate from a state-policy table — verify with the county assessor before closing.
Climate risk First Street
- Flood 7/10 Severe FEMA zone X (shaded) · 87% chance over 30 yrs
- Wildfire 1/10 Low
- Heat 6/10 Major 6 d/yr ≥97°F today · 14 d/yr by 30 yrs out
- Wind 8/10 Severe 80% chance of damaging wind over 30 yrs
- Air quality 4/10 Moderate 5 unhealthy d/yr today · 7 by 30 yrs out
Nearby sold comps map
Loading sold comps map…
Walkable amenities ~0.75 mi
Loading nearby amenities…
Taxation est. · year 1
- Rental income
- $41,184
- − Mortgage interest
- −$29,408
- − Property taxes
- −$2,046
- − Insurance
- −$3,422
- − Repairs & maintenance
- −$3,295
- − Management
- −$3,295
- − HOA
- −$8,556
- − Depreciation
- −$15,273
- Taxable loss
- −$24,111
- Est. tax savings @ 24.0%
- +$5,787
- After-tax cash flow
- $-8,740/yr
For passive investors: Depreciation is non-cash, so a rental often shows a tax loss while cash-flowing — sheltering income. Rental losses are passive: they offset passive income freely, and up to $25,000/yr can offset ordinary (W-2) income if you actively participate and your MAGI is under $100k (phasing out to $0 by $150k); unused losses carry forward. On sale, claimed depreciation is recaptured at up to 25%, and gains may owe capital-gains tax (a 1031 exchange can defer both). Figures are a year-1 estimate at your 24.0% rate — not tax advice; consult a CPA.
Schools (NCES district)
No district data.
Livability — New York
- Score
- 75/100
- State rank
- #268
- US rank
- #4188
Category grades
Schools grade is shown separately in the Schools card above.
Census & demographics
- Census place
- New York, NY
- County
- Kings County · 2,614,986 people
- City population
- 7,731,280
- Metro
- New York-Newark-Jersey City, NY-NJ-PA
- Population (ZIP)
- 50,822
- Household income
- $43,648
- Rent vs Own
- Severe rent burden
- 4426.0
Population outlook (Kings County) Hauer SSP2
- Today (2025)
- 2,847,441 people
- By 2030
- 2,937,006 · +3.1%
- By 2040
- 3,095,491 · +8.7%
- By 2050
- 3,228,968 · +13.4%
- By 2075
- 3,321,723 · +16.7%
- By 2100
- 3,111,387 · +9.3%
Race, ethnicity, and origin ACS 2023
- Neighborhood character
- Diverse neighborhood (Simpson 0.68)
- Race & ethnicity
- White 48% Black 22% Hispanic / Latino 19% Asian 8% Two or more races 7%
- Hispanic origin (detail)
- Mexican 5% Puerto Rican 8% Dominican 2%
- Common ancestry
- Scotch-Irish 10% Subsaharan African 7% Romanian 1%
- Foreign-born
- 48% · Canada, China
- Languages at home
- 42% English-only · Russian/Polish/Slavic 32% Spanish 11% Chinese 5%
Political lean MEDSL · Kings
- 2024 margin
- Solid D (+44.0) · D 72.0% · R 28.0%
- 2008→2024 swing
- -15.5pp toward R · 2008: 59.4pp · 2024: 44.0pp
- All cycles
- 2024: D+44.0 2020: D+54.8 2016: D+61.8 2012: D+63.9 2008: D+59.4
Not yet ingested
- Civics
- —
Market trends
- HPI YoY
- ▲ 4.98%
- Current HPI
- 505.1405
- Rent YoY
- ▲ 7.03%
- Metro
- New York-Newark-Jersey City, NY-NJ-PA
- State GDP YoY
- ▲ 2.60%
- F500 in state
- 92
Industry mix (Fortune 500 HQ in NY)
| Industry | F500 HQs | Revenue |
|---|---|---|
| Financial Services | 10 | $950B |
|
||
| Consumer Goods | 9 | $162B |
|
||
| Insurance | 4 | $225B |
|
||
| Telecommunications | 2 | $144B |
|
||
| Pharmaceuticals | 2 | $112B |
|
||
| Media / Entertainment | 2 | $69B |
|
||
Price history
+383.9% since first listed3 events — show timeline
- 2026-04-10 Listed $525,000 BNYMLS
- 2020-03-19 Sold (Public Records) $420,000 Public Records
- 1994-05-18 Sold (Public Records) $108,500 Public Records
Property tax history
+3.8%/yrLatest (2025): $2,046 · +55.8% YoY. Source: county tax records.
Cash-flow waterfall
monthlySold comps — $/sqft
last 12 mo · ≤1 miLoading sold comps…