 🏗️ New Construction
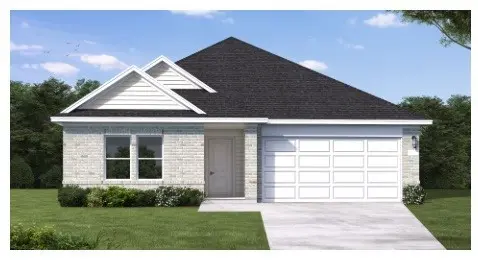
6706 Pebble Bluff Ct · Cove, TX
Flood risk 1/10 · Minimal
- FEMA flood zone
- X (unshaded)
- Chance of flooding over 30 yrs
- 0.0%
- Est. flood insurance / yr
- $507 – $1,088
Fire risk 4/10 · Minor
- Est. fire insurance / yr
- $1,222 – $2,270
Heat risk 9/10 · Severe
- Hot days now (above 111°F)
- 7 days/yr
- Hot days in 30 yrs
- 24 days/yr
Wind risk 9/10 · Severe
- Chance of severe wind over 30 yrs
- 99.0%
Air-quality risk 2/10 · Minimal
- Unhealthy air days now
- 1 days/yr
- Unhealthy air days in 30 yrs
- 1 days/yr
Risk factors via First Street. Map © Google.
Why this score? — see what drove the D- grade
The composite is a weighted blend of 9 inputs, each scored 0–100. Each bar is that input's sub-score; the figure is the points it added to the 100-point composite (weight × sub-score).
- Cash flow +9.0/30.0
- ARV discount +7.5/15.0
- Schools +6.2/10.0
- Rent growth +3.4/5.0
- Livability +3.2/5.0
- 1% rule +3.1/10.0
- DSCR +2.5/10.0
- Condition / age +2.2/5.0
- Appreciation +0.0/10.0
$304,990
🖨 Deal sheet 📄 Offer letter ✓ Due diligence
Listing remarks
This beautifully designed one-story home in Windcress offers 1,662 square feet of functional, open-concept living. With four spacious bedrooms, two full bathrooms, and a two-car garage, this layout is perfect for comfortable everyday living. Enjoy a durable four-sided brick exterior and a seamless flow between the kitchen, dining, and living areas — ideal for entertaining. Located in a resort-style community with a pool, playgrounds, pickleball courts, and quick access to SH99, I-10 and FM 146. Zoned to highly rated Barbers Hill Independent School District.
Key facts
- Open-concept living
- Quick access to i-10
- 7,494 sq ft lot
Tags
Property features AI
Finance
- Other: Pool access via association
- HOA & community: Association: Pulte Management; Association amenities: Playground, Pickleball, Pool; Association fee charged annually
Exterior
- Parking: Attached garage; 2 garage spaces
- Security: Home prewired for security; Security system owned; Smoke detector(s)
- Utilities: Public water; Public sewer
- Home design: Residential property; Under construction (new construction); Faces northwest; Slab foundation
- Construction: Brick construction; Composition roof; Built in 2026
- Exterior features: Deck; Porch; Patio; Private yard; Subdivision; Concrete road surface
Interior
- Kitchen: Dishwasher; Electric oven; Gas cooktop; Disposal; Microwave; ENERGY STAR qualified appliances
- Bedrooms: 4 total rooms
- Flooring: Carpet; Plank; Tile; Vinyl
- Bathrooms: 2 full bathrooms
- Heating & cooling: Central heating (gas); Central air (electric); Has heating; Has cooling
- Interior features: Breakfast bar; High ceilings; Kitchen island; Kitchen/family room combo; Quartz counters; Separate shower; Tub with shower; Walk-in pantry; Ceiling fan(s); Programmable thermostat; Low emissivity windows
- Laundry & utility: Washer hookup; Electric dryer hookup; Gas dryer hookup
Neighborhood map
What this means for you Summary
Snapshot
- This is a 4-bed/2.0-bath single-family listed at $305k. Condition is rated fair.
Deal economics
- At list price, monthly cash flow is $-237 ($-3k/yr) — negative.
- To cash-flow at today's rent, offer at most $270k (11.5% below list).
- To meet the 1% rule (rent ≥ 1% of price), the offer needs to be $246k (19.5% below list).
- Recommended offer: $246k (19.5% below list) — sets the bar for 1% rule.
Location & tenants
- Location reads 64/100 on livability (#766 in TX) — a middle-class / working-renter tenant base. Strengths: employment A+, housing A+, crime A; Watch: amenities F, commute F, health & safety F.
- Barbers Hill ISD (rural): math 72% / reading 65% proficiency, ranked #12 of 826 in TX (top 2%) — acceptable for families but not a draw, mixed tenant base, ~2y average lease.
- Zoned schools: Barbers Hill El South (math 68% / reading 62%, grade B+, #246 of 4,322 statewide, top 6%, 883 students, 37% FRL); Barbers Hill Middle South (math 77% / reading 63%, grade A, #58 of 1,662 statewide, top 4%, 636 students, 0% FRL); Barbers Hill H S (math 70% / reading 74%, grade B+, #95 of 1,632 statewide, top 7%, 1,972 students, 0% FRL) — zoned schools average 12% FRL vs 28% district-wide (16 pts lower); this property's tenant base skews higher-income than the district average.
- Market conditions: Rents rising (+3.4%/yr); 776 active listings in the ZIP; 6 comparable units currently listed for rent nearby; rentals at typical pace (median 20d on market — plan ~3-4 weeks tenant-placement turnaround); high-income renter base; 629 units permitted in Chambers County in 2024 (0 in 5+ unit buildings).
Forward outlook
- Local home prices are declining (-3.0%/yr); year-one equity from $2k of loan paydown is wiped out by about $9k of value loss. Plan a longer hold.
- Chambers County population projected at +46% by 2050 — long-run rental-demand tailwind backs the buy-and-hold thesis.
Negotiation context
- It's been on market 48 days — a 3% lower offer ($296k) is reasonable based on typical stale-listing flexibility.
- 2 sale attempts with the ask held roughly flat each time — persistent listings suggest the price (not the market) is what's stuck; bring a comps-based counter.
Risks & watch-outs
- Climate carrying-cost: severe wind risk, 99% chance of damaging wind over 30y; extreme-heat days projected 7→24/yr by 2055 (HVAC capex compounding) — expect insurance premiums to compound above CPI over the hold.
Questions for the listing agent
- What do current leases actually rent for vs. the listed asking? Can we see a recent rent roll and the last 12 months of T-12 income?
- It's been on market 48 days. Have you received any prior offers? Is the seller open to a 19% concession, seller financing, or rate buy-down credit?
- Have any recent inspections been done? Can we get a copy of the seller's disclosures and any deferred-maintenance estimates?
- What does the HOA fee cover, when was the last increase, and are there any pending special assessments or reserve-fund shortfalls?
- Is there a deadline driving the sale (1031 exchange, divorce, estate, relocation)? That informs how much negotiation room exists.
- Schools are D-rated, which usually means shorter tenancies and higher turnover. Who's the typical renter profile here, and what's been the actual vacancy rate?
- The area grade is low — what's the realistic commute time and amenity access for the typical tenant pool here? Any planned neighborhood developments (good or bad) we should know about?
- What's the average days-on-market for RENTAL listings here right now (not sales)? A rising rental-DOM trend means longer vacancies and softer asking-rent achievability than the comps imply.
- What's the recent tenant-quality profile in this submarket — average credit score on applications, eviction rate, late-payment / NSF rate, and stable-employment percentage? A property-management company in the area should have these aggregated.
- How much new for-sale + rental construction is in the pipeline within 1–3 miles? Heavy new supply typically softens prices + rents 12–24 months out; constrained supply supports both.
Investment metrics
- 1% rule
- 0.81% ✗
- Cap rate
- 5.36%
- Cash-on-cash
- -3.33%
- DSCR
- 0.85
- GRM
- 10.3
CMA / ARV
- ARV (median comp)
- $304,215
- List price
- $304,990
- Delta
- 0.25%
- Verdict
- FAIR
- Comps
- 20 within 1.0 mi
Show comp detail 12 sales within ~0.75 mi
| Address | Dist | Beds/Ba | Sqft | Sold | Price | $/sf | Match |
|---|---|---|---|---|---|---|---|
| 6743 Camila St | 0.30mi | 4/2.0 | 1,682 (+1%) | 2mo | $284,000 | $169 | 82 |
| 6818 Bens Lndg | 0.57mi | 4/2.5 | 1,642 (-1%) | 1mo | $269,800 | $164 | 69 |
| 6707 Alejandro Pl | 0.42mi | 3/2.0 (-1) | 1,592 (-4%) | 1mo | $299,100 | $188 | 68 |
| 6922 Bens Lndg | 0.63mi | 4/2.5 | 1,642 (-1%) | 1mo | $269,180 | $164 | 66 |
| 6714 Augusta Greens Dr | 0.45mi | 3/2.0 (-1) | 1,790 (+8%) | 2mo | $324,990 | $182 | 59 |
| 6830 Bens Lndg | 0.59mi | 3/2.0 (-1) | 1,580 (-5%) | 1mo | $274,870 | $174 | 59 |
| 7106 Thomas James Ct | 0.65mi | 4/2.0 | 1,777 (+7%) | 1mo | $297,690 | $168 | 57 |
| 6810 Bens Lndg | 0.47mi | 3/2.0 (-1) | 1,512 (-9%) | 2mo | $259,140 | $171 | 56 |
| 6714 Camila St | 0.28mi | 4/3.0 | 1,899 (+14%) | 4mo | $338,930 | $178 | 56 |
| 6706 Alejandro Pl | 0.39mi | 3/2.0 (-1) | 1,866 (+12%) | 4mo | $339,210 | $182 | 53 |
| 6702 Augusta Greens Dr | 0.45mi | 3/2.0 (-1) | 1,866 (+12%) | 2mo | $334,990 | $180 | 52 |
| 2015 Magnolia Bnd | 0.58mi | 3/2.0 (-1) | 1,804 (+8%) | 4mo | $405,000 | $225 | 50 |
Match score weights: distance 35% · size 25% · config 20% · recency 20%. Top-matched comps best support the ARV.
Projected returns pro-forma
-3.0% appreciation · 3.42% rent growth · sell at horizon
- IRR
- -21.4%
- Equity multiple
- 0.26×
- Total profit
- $-63,246
- Equity at exit
- $45,359
- IRR
- -13.9%
- Equity multiple
- 0.18×
- Total profit
- $-69,833
- Equity at exit
- $26,303
Cash invested: $85,180 (down + closing). Projections, not guarantees.
Landlord ↔ Tenant lean methodology
- Overall (STATE)
- 87 Strongly Landlord-Friendly
- State Texas
- 87 Strongly Landlord-Friendly · R+5
- County
- — inherits STATE
- City
- — inherits STATE
ZIP-level market 77523
- Home prices YoY
- -31.5%
- Rents YoY
- 3.4%
- Active inventory
- 776
- Price-to-rent
- 10.3×
Monthly cashflow live
- Estimated rent
- $2,457 high interval (Pro) →
- Mortgage (P&I)
- −$1,595
- Tax est. 1.5%
- −$380 /mo · $4,563/yr
- Insurance
- −$127
- HOA
- −$75
- Vacancy / Maint / Mgmt
- −$516
- Net cashflow
- $-237
Break-even live
UW: 25.0% down · 7.5% · 30yr · 1.5% tax · 5.0% vac · 8.0% maint · 8.0% mgmt
Financing live
Cash to close
- Down payment
- $76,054
- Closing costs
- $9,126
- Reserves months
- —
- Total cash needed
- —
Loan-product check · same deal, 3 products live
Conventional
25% down · 7.5% · 30yr
- Down + closing
- —
- Monthly P&I
- —
- Monthly cashflow
- —
- DSCR
- —
- Eligible?
- —
Personal DTI + credit; lowest rate.
DSCR
20% down · 8.5% · 30yr
- Down + closing
- —
- Monthly P&I
- —
- Monthly cashflow
- —
- DSCR
- —
- Eligible?
- —
No personal income docs; deal must DSCR.
Hard money
10% down · 12.0% · 12mo
- Down + closing
- —
- Monthly P&I
- —
- Monthly cashflow
- —
- DSCR
- —
- Eligible?
- —
Short-term bridge; refi at stabilization.
Rent comps 6 comps
| Address | Beds | Baths | Sqft | Rent | $/sqft | DOM | Units | Dist |
|---|---|---|---|---|---|---|---|---|
| 14930 Spring Forest Ln Baytown, TX | 4.0 | 2.0 | 1829 | $2,750 | $1.50 | 43d | 1 | 0.85mi |
| 14739 Sweet Water Dr Baytown, TX | 4.0 | 2.0 | 1821 | $2,395 | $1.32 | 1d | 1 | 0.92mi |
| 5815 Littoral Rd Baytown, TX | 3.0 | 2.0 | 1305 | $1,845 | $1.41 | 19d | 1 | 1.25mi |
| 8414 Liberty Sky Rd Baytown, TX | 3.0 | 2.5 | 2046 | $2,095 | $1.02 | 24d | 1 | 1.36mi |
| 21 Cotton Bayou Cir Cove, TX | 3.0 | 2.0 | 1216 | $1,195 | $0.98 | 3d | 1 | 1.36mi |
| 21 Cotton Bayou Cir Cove, TX | 3.0 | 2.0 | 1216 | $1,195 | $0.98 | 15d | 1 | 1.36mi |
HOA detail
- Monthly dues
- $75 · $900/yr
- Likely covers
- landscapingpool
Listing history 22 events
-
2026-06-18status $304,990 Pending 48 DOM
-
2026-06-18days on market $304,990 Active 48 DOM
-
2026-06-17days on market $304,990 Active 47 DOM
-
2026-06-16days on market $304,990 Active 46 DOM
-
2026-06-15days on market $304,990 Active 45 DOM
-
2026-06-13pricedays on market $304,990 Active 43 DOM
-
2026-06-09days on market $309,990 Active 39 DOM
-
2026-06-08days on market $309,990 Active 38 DOM
-
2026-06-07days on market $309,990 Active 37 DOM
-
2026-06-04days on market $309,990 Active 34 DOM
-
2026-06-03days on market $309,990 Active 33 DOM
-
2026-06-02days on market $309,990 Active 32 DOM
-
2026-06-01days on market $309,990 Active 31 DOM
-
2026-05-31days on market $309,990 Active 30 DOM
-
2026-05-14price $309,990 1173-char remark
-
2026-05-14price $309,990 567-char remark
-
2026-05-01$314,990 Active 567-char remark
-
2026-05-01historical
-
2026-03-20price $314,990 1173-char remark
-
2026-03-18price $314,990
-
2026-02-26$328,090 Active 1173-char remark
-
2026-02-23$328,090 Active
ⓘ Source: listings_history table (triggers on properties + properties_extension) + one-shot
backfill from property_details.listing_events for pre-trigger history.
Climate risk First Street
- Flood 1/10 Low FEMA zone X (unshaded) · 0% chance over 30 yrs
- Wildfire 4/10 Moderate
- Heat 9/10 Extreme 7 d/yr ≥111°F today · 24 d/yr by 30 yrs out
- Wind 9/10 Extreme 99% chance of damaging wind over 30 yrs
- Air quality 2/10 Low 1 unhealthy d/yr today · 1 by 30 yrs out
Nearby sold comps map
Loading sold comps map…
Walkable amenities ~0.75 mi
Loading nearby amenities…
Taxation est. · year 1
- Rental income
- $29,478
- − Mortgage interest
- −$17,041
- − Property taxes
- −$4,563
- − Insurance
- −$1,521
- − Repairs & maintenance
- −$2,358
- − Management
- −$2,358
- − HOA
- −$900
- − Depreciation
- −$8,850
- Taxable loss
- −$8,113
- Est. tax savings @ 24.0%
- +$1,947
- After-tax cash flow
- $-893/yr
For passive investors: Depreciation is non-cash, so a rental often shows a tax loss while cash-flowing — sheltering income. Rental losses are passive: they offset passive income freely, and up to $25,000/yr can offset ordinary (W-2) income if you actively participate and your MAGI is under $100k (phasing out to $0 by $150k); unused losses carry forward. On sale, claimed depreciation is recaptured at up to 25%, and gains may owe capital-gains tax (a 1031 exchange can defer both). Figures are a year-1 estimate at your 24.0% rate — not tax advice; consult a CPA.
Condition & rehab AI · 3 photos
This one-story home requires moderate repairs and maintenance, particularly to the exterior and interior paint. Updates to the exterior and interior paint, along with new flooring and modern appliances, would significantly increase its resale and rental value.
Repairs flagged
- Major Exterior paint — Paint appears faded and weathered
- Major Interior paint — Paint appears faded and needs touch-up
Value-add opportunities
- Resale Paint exterior — Fresh paint enhances curb appeal
- Resale Paint interior — Fresh paint enhances interior appeal
- Both Replace flooring — New flooring improves both resale and rental value
- Resale Update kitchen appliances — Modern appliances enhance kitchen appeal
- Resale Update bathrooms — Modern bathrooms enhance overall appeal
Renovation cost estimate screening
| Repair item | Severity | Est. cost |
|---|---|---|
| Exterior paint · Paint appears faded and weathered | Major | $15,000–50,000 |
| Interior paint · Paint appears faded and needs touch-up | Major | $15,000–50,000 |
| Total estimated repair cost · 2 items | $30,000–100,000 |
Value-add ROI direction
- Resale Paint exterior — Fresh paint enhances curb appeal ↑
- Resale Paint interior — Fresh paint enhances interior appeal ↑
- Both Replace flooring — New flooring improves both resale and rental value ↑
- Resale Update kitchen appliances — Modern appliances enhance kitchen appeal ↑
- Resale Update bathrooms — Modern bathrooms enhance overall appeal ↑
ⓘ Cost ranges are severity-bucket heuristics (US national rule-of-thumb). Get contractor quotes + a written scope before underwriting a rehab budget.
Schools (NCES district)
- District
- Barbers Hill ISD
- NCES district ID
- 4809450
- Math proficiency
- 72% ▼ -5.00%
- Reading proficiency
- 65% ▼ -1.00%
- Median HH income
- $87,257
- Composite
- 61.73/100
- National rank
- #737
- State rank
- #12 of 826 in TX
Livability — Cove
- Score
- 64/100
- State rank
- #766
- US rank
- #13996
Category grades
Schools grade is shown separately in the Schools card above.
Census & demographics
- County
- Chambers County · 30,186 people
- Metro
- Houston-The Woodlands-Sugar Land, TX
- Population (ZIP)
- 30,186
- Household income
- $124,188
- Rent vs Own
- Severe rent burden
- 549.0
Population outlook (Chambers County) Hauer SSP2
- Today (2025)
- 46,946 people
- By 2030
- 51,094 · +8.8%
- By 2040
- 59,578 · +26.9%
- By 2050
- 68,318 · +45.5%
- By 2075
- 90,485 · +92.7%
- By 2100
- 104,885 · +123.4%
Race, ethnicity, and origin ACS 2023
- Neighborhood character
- Majority White (62%)
- Race & ethnicity
- White 62% Hispanic / Latino 25% Two or more races 11% Black 8% Asian 2%
- Hispanic origin (detail)
- Mexican 22%
- Common ancestry
- Lithuanian 1% Slovak 1% Serbian 1%
- Foreign-born
- 9% · Canada
- Languages at home
- 82% English-only · Spanish 17%
Political lean MEDSL · Chambers
- 2024 margin
- Solid R (+65.6) · D 16.8% · R 82.4%
- 2008→2024 swing
- -14.4pp toward R · 2008: -51.2pp · 2024: -65.6pp
- All cycles
- 2024: R+65.6 2020: R+61.7 2016: R+62.1 2012: R+61.1 2008: R+51.2
Not yet ingested
- Civics
- —
Market trends
- HPI YoY
- ▼ -102.33%
- Current HPI
- 222.6999
- Rent YoY
- ▲ 3.42%
- Metro
- Houston-The Woodlands-Sugar Land, TX
- State GDP YoY
- ▲ 3.95%
- F500 in state
- 110
Industry mix (Fortune 500 HQ in TX)
| Industry | F500 HQs | Revenue |
|---|---|---|
| Energy | 16 | $1,198B |
|
||
| Technology | 5 | $198B |
|
||
| Engineering / Construction | 4 | $72B |
|
||
| Energy Services | 3 | $60B |
|
||
| Utilities | 3 | $41B |
|
||
| Healthcare | 2 | $330B |
|
||
Price history
-7.0% since first listed7 events — show timeline
- 2026-06-18 Pending — HARMLS
- 2026-06-11 Price Changed $304,990 HARMLS
- 2026-05-14 Price Changed $309,990 HARMLS
- 2026-05-01 Listing Removed — HARMLS
- 2026-05-01 Listed $314,990 HARMLS
- 2026-03-18 Price Changed $314,990 HARMLS
- 2026-02-23 Listed $328,090 HARMLS
Cash-flow waterfall
monthlySold comps — $/sqft
last 12 mo · ≤1 miLoading sold comps…