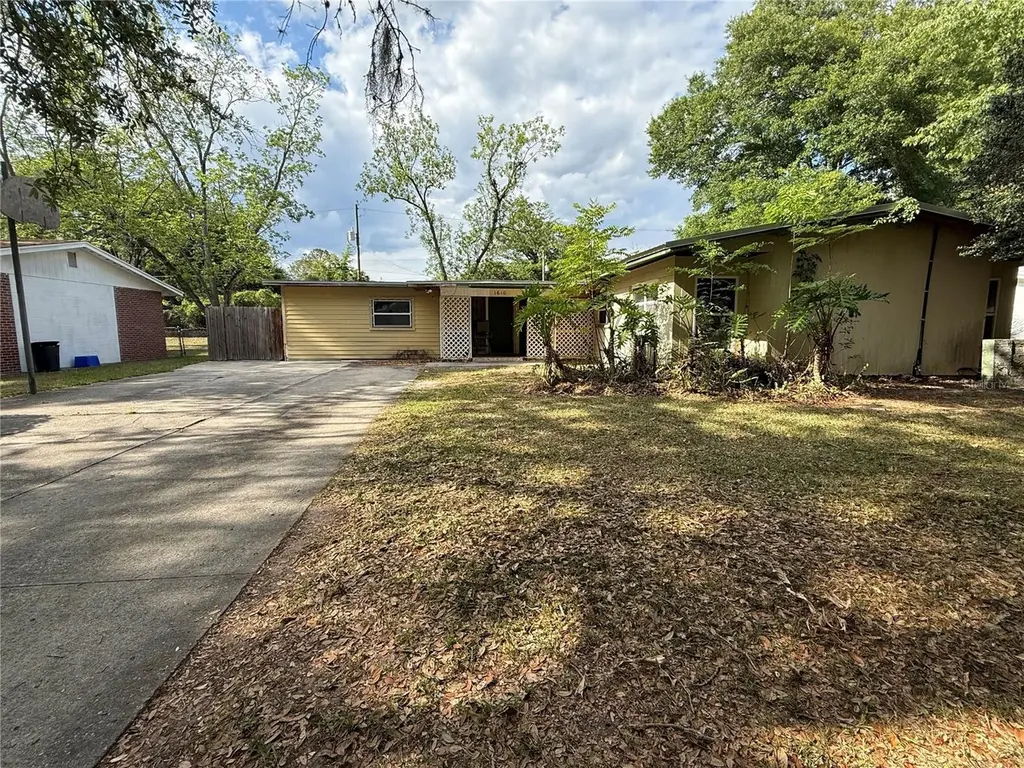
1610 NE 19th Pl · Gainesville, FL
Flood risk 1/10 · Minimal
- FEMA flood zone
- X (unshaded)
- Chance of flooding over 30 yrs
- 0.0%
- Est. flood insurance / yr
- $507 – $1,088
Fire risk 5/10 · Moderate
- Est. fire insurance / yr
- $947 – $1,759
Heat risk 8/10 · Major
- Hot days now (above 107°F)
- 7 days/yr
- Hot days in 30 yrs
- 21 days/yr
Wind risk 9/10 · Severe
- Chance of severe wind over 30 yrs
- 99.0%
Air-quality risk 3/10 · Minor
- Unhealthy air days now
- 3 days/yr
- Unhealthy air days in 30 yrs
- 3 days/yr
Risk factors via First Street. Map © Google.
Why this score? — see what drove the C- grade
The composite is a weighted blend of 9 inputs, each scored 0–100. Each bar is that input's sub-score; the figure is the points it added to the 100-point composite (weight × sub-score).
- Cash flow +21.1/30.0
- ARV discount +7.5/15.0
- DSCR +6.7/10.0
- 1% rule +4.5/10.0
- Schools +4.3/10.0
- Livability +4.0/5.0
- Rent growth +3.5/5.0
- Condition / age +2.5/5.0
- Appreciation +0.0/10.0
$199,997
🖨 Deal sheet 📄 Offer letter ✓ Due diligence
Listing remarks
Opportunity knocks in Carol Estates! This 3-bedroom, 2-bath home offers nearly 1,900 square feet of living space and sits on a spacious lot, ready for your vision and renovation plans. With solid bones and a generous layout, this property is perfect for investors, flippers, or buyers looking to create a custom home. Some of the big-ticket items are already taken care of: Roof replaced in 2021, Windows less than 6 years old, Plumbing updated (galvanized replaced with PVC) and Primary shower renovated in 2021. The size alone sets it apart, offering flexibility to reimagine the space and maximize value. Conveniently located with easy access to Gainesville’s key destinations, including th
Key facts
- Solid bones
- Generous layout
- Spacious lot
Tags
Property features AI
Finance
- Other: Homestead exemption indicated; No CDD; Lease restrictions not indicated
- HOA & community: No HOA association indicated; Development: Carol Estates
Exterior
- Utilities: Public water; Public sewer; Electricity connected; Cable available; Broadband/high‑speed internet available; Water connected; Sewer connected
- Home design: Single-family residence; One story; South-facing
- Construction: Frame construction with wood siding; Metal and shingle roof; Slab foundation; Built on a 0.2 acre lot
- Exterior features: Other exterior features
Interior
- Kitchen: Refrigerator included
- Bedrooms: 3 bedrooms
- Flooring: Carpet; Tile; Vinyl
- Bathrooms: 2 full bathrooms
- Heating & cooling: No heating system specified; No cooling system specified
- Interior features: Ceiling fans; Eat-in kitchen; Total of 6 rooms
- Laundry & utility: Laundry closet
Neighborhood map
What this means for you Summary
Snapshot
- This is a 3-bed/2.0-bath single-family listed at $200k.
Deal economics
- At list price, monthly cash flow is $286 ($3k/yr) — positive.
- The deal already cash-flows at list — no discount required.
- To meet the 1% rule (rent ≥ 1% of price), the offer needs to be $191k (4.6% below list).
- Recommended offer: $191k (4.6% below list) — sets the bar for 1% rule.
Location & tenants
- Location reads 81/100 on livability (#97 in FL, #1,480 nationally) — a professional / high-income tenant draw. Strengths: amenities A+, commute A+, cost of living A+; Watch: employment D+, crime F.
- Alachua (urban): math 49% / reading 54% proficiency, ranked #30 of 73 in FL (top 41%) — acceptable for families but not a draw, mixed tenant base, ~2y average lease.
- Market conditions: Rents rising fast (+4.0%/yr); 108 active listings in the ZIP; 1,774 units permitted in Alachua County in 2024 (984 in 5+ unit buildings).
- At $1,907/mo this rent would consume 46% of the median local household income ($49k/yr) (locally 1037% of renters already pay >50% of income on rent) — very limited rent-growth headroom before tenants either downsize or default.
Forward outlook
- Local home prices are declining (-3.0%/yr); year-one equity from $1k of loan paydown is wiped out by about $6k of value loss. Plan a longer hold.
- Alachua County population projected at +26% by 2050 — long-run rental-demand tailwind backs the buy-and-hold thesis.
Negotiation context
- It's been on market 55 days — a 3% lower offer ($194k) is reasonable based on typical stale-listing flexibility.
- Current owner paid $32k; list at $200k implies a 515% gain — meaningful room to come down on a strong offer.
Risks & watch-outs
- Climate carrying-cost: severe wind risk, 99% chance of damaging wind over 30y; moderate wildfire risk; extreme-heat days projected 7→21/yr by 2055 (HVAC capex compounding) — expect insurance premiums to compound above CPI over the hold.
Questions for the listing agent
- It's been on market 55 days. Have you received any prior offers? Is the seller open to a 5% concession, seller financing, or rate buy-down credit?
- Built in 1964 — when were the roof, HVAC, electrical panel, plumbing, and water heater last replaced?
- Is there a deadline driving the sale (1031 exchange, divorce, estate, relocation)? That informs how much negotiation room exists.
- Schools are B-rated — typically a magnet for longer-tenancy family renters. What's the average tenant stay here, and is there a school-zone premium baked into asking?
- Crime grade is F in this area — have there been break-ins, vandalism, or insurance claims at this property in the last 3 years? What carrier currently insures it and at what premium?
- What's the average days-on-market for RENTAL listings here right now (not sales)? A rising rental-DOM trend means longer vacancies and softer asking-rent achievability than the comps imply.
- What's the recent tenant-quality profile in this submarket — average credit score on applications, eviction rate, late-payment / NSF rate, and stable-employment percentage? A property-management company in the area should have these aggregated.
- How much new for-sale + rental construction is in the pipeline within 1–3 miles? Heavy new supply typically softens prices + rents 12–24 months out; constrained supply supports both.
Investment metrics
- 1% rule
- 0.95% ✗
- Cap rate
- 8.01%
- Cash-on-cash
- 6.14%
- DSCR
- 1.27
- GRM
- 8.7
CMA / ARV
No comps found within radius.
Projected returns pro-forma
-3.0% appreciation · 4.04% rent growth · sell at horizon
- IRR
- -5.8%
- Equity multiple
- 0.78×
- Total profit
- $-12,228
- Equity at exit
- $29,820
- IRR
- 4.9%
- Equity multiple
- 1.37×
- Total profit
- $20,996
- Equity at exit
- $17,292
Cash invested: $55,999 (down + closing). Projections, not guarantees.
Landlord ↔ Tenant lean methodology
- Overall (STATE)
- 87 Strongly Landlord-Friendly
- State Florida
- 87 Strongly Landlord-Friendly · R+3
- County
- — inherits STATE
- City
- — inherits STATE
ZIP-level market 32609
- Home prices YoY
- -23.5%
- Rents YoY
- 4.0%
- Active inventory
- 108
- Price-to-rent
- 8.7×
Monthly cashflow live
- Estimated rent
- $1,907 medium interval (Pro) →
- Mortgage (P&I)
- −$1,049
- Tax from tax record
- −$88 /mo · $1,059/yr
- Insurance
- −$83
- HOA
- −$0
- Vacancy / Maint / Mgmt
- −$401
- Net cashflow
- $286
Break-even live
UW: 25.0% down · 7.5% · 30yr · 1.5% tax · 5.0% vac · 8.0% maint · 8.0% mgmt
Financing live
Cash to close
- Down payment
- $49,999
- Closing costs
- $6,000
- Reserves months
- —
- Total cash needed
- —
Loan-product check · same deal, 3 products live
Conventional
25% down · 7.5% · 30yr
- Down + closing
- —
- Monthly P&I
- —
- Monthly cashflow
- —
- DSCR
- —
- Eligible?
- —
Personal DTI + credit; lowest rate.
DSCR
20% down · 8.5% · 30yr
- Down + closing
- —
- Monthly P&I
- —
- Monthly cashflow
- —
- DSCR
- —
- Eligible?
- —
No personal income docs; deal must DSCR.
Hard money
10% down · 12.0% · 12mo
- Down + closing
- —
- Monthly P&I
- —
- Monthly cashflow
- —
- DSCR
- —
- Eligible?
- —
Short-term bridge; refi at stabilization.
Listing history 19 events
-
2026-06-18days on market $199,997 Active 55 DOM
-
2026-06-17days on market $199,997 Active 54 DOM
-
2026-06-16days on market $199,997 Active 53 DOM
-
2026-06-15days on market $199,997 Active 52 DOM
-
2026-06-14days on market $199,997 Active 50 DOM
-
2026-06-13days on market $199,997 Active 49 DOM
-
2026-06-10days on market $199,997 Active 47 DOM
-
2026-06-09days on market $199,997 Active 46 DOM
-
2026-06-08days on market $199,997 Active 45 DOM
-
2026-06-07days on market $199,997 Active 44 DOM
-
2026-06-05days on market $199,997 Active 41 DOM
-
2026-06-03days on market $199,997 Active 40 DOM
-
2026-06-02days on market $199,997 Active 39 DOM
-
2026-06-01days on market $199,997 Active 38 DOM
-
2026-05-31days on market $199,997 Active 37 DOM
-
2026-05-30days on market $199,997 Active 36 DOM
-
2026-05-15price $199,997 1006-char remark
-
2026-04-24$223,000 Active 1006-char remark
-
1978-01-01soldstatus $32,500
ⓘ Source: listings_history table (triggers on properties + properties_extension) + one-shot
backfill from property_details.listing_events for pre-trigger history.
Tax reassessment forecast FL · Resets to sale price
- Current annual tax
- $1,059 · $88/mo
- Projected year-2 tax
- $1,660 · $138/mo
- Expected delta
- +$601/yr (+$50/mo · 56.7%)
ⓘ Screening estimate from a state-policy table — verify with the county assessor before closing.
Climate risk First Street
- Flood 1/10 Low FEMA zone X (unshaded) · 0% chance over 30 yrs
- Wildfire 5/10 Major
- Heat 8/10 Severe 7 d/yr ≥107°F today · 21 d/yr by 30 yrs out
- Wind 9/10 Extreme 99% chance of damaging wind over 30 yrs
- Air quality 3/10 Moderate 3 unhealthy d/yr today · 3 by 30 yrs out
Nearby sold comps map
Loading sold comps map…
Walkable amenities ~0.75 mi
Loading nearby amenities…
Taxation est. · year 1
- Rental income
- $22,887
- − Mortgage interest
- −$11,203
- − Property taxes
- −$1,059
- − Insurance
- −$1,000
- − Repairs & maintenance
- −$1,831
- − Management
- −$1,831
- − Depreciation
- −$5,818
- Taxable income
- $145
- Est. tax owed @ 24.0%
- −$35
- After-tax cash flow
- $3,401/yr
For passive investors: Depreciation is non-cash, so a rental often shows a tax loss while cash-flowing — sheltering income. Rental losses are passive: they offset passive income freely, and up to $25,000/yr can offset ordinary (W-2) income if you actively participate and your MAGI is under $100k (phasing out to $0 by $150k); unused losses carry forward. On sale, claimed depreciation is recaptured at up to 25%, and gains may owe capital-gains tax (a 1031 exchange can defer both). Figures are a year-1 estimate at your 24.0% rate — not tax advice; consult a CPA.
Schools (NCES district)
- District
- Alachua
- NCES district ID
- 1200030
- Math proficiency
- 49% ▼ -9.00%
- Reading proficiency
- 54% ▼ -3.00%
- Median HH income
- $42,683
- Composite
- 43.31/100
- National rank
- #3038
- State rank
- #30 of 73 in FL
Livability — Gainesville
- Score
- 81/100
- State rank
- #97
- US rank
- #1480
Category grades
Schools grade is shown separately in the Schools card above.
Census & demographics
- Census place
- Gainesville, FL
- County
- Alachua County · 218,005 people
- City population
- 188,348
- Metro
- Gainesville, FL
- Population (ZIP)
- 19,752
- Household income
- $49,406
- Rent vs Own
- Severe rent burden
- 1037.0
Population outlook (Alachua County) Hauer SSP2
- Today (2025)
- 289,834 people
- By 2030
- 305,873 · +5.5%
- By 2040
- 335,246 · +15.7%
- By 2050
- 364,719 · +25.8%
- By 2075
- 436,665 · +50.7%
- By 2100
- 482,920 · +66.6%
Race, ethnicity, and origin ACS 2023
- Neighborhood character
- Diverse neighborhood (Simpson 0.60)
- Race & ethnicity
- White 54% Black 33% Hispanic / Latino 8% Two or more races 6% Asian 1%
- Hispanic origin (detail)
- Mexican 2% Puerto Rican 2%
- Common ancestry
- Romanian 2% Slovak 1% Lithuanian 1%
- Foreign-born
- 5% · Canada, Vietnam
- Languages at home
- 92% English-only · Spanish 5% Other Indo-European 1% French/Haitian/Cajun 1%
Political lean MEDSL · Alachua
- 2024 margin
- Strong D (+21.0) · D 59.7% · R 38.8% · Other 1.5%
- 2008→2024 swing
- -0.6pp no change · 2008: 21.6pp · 2024: 21.0pp
- All cycles
- 2024: D+21.0 2020: D+27.2 2016: D+22.5 2012: D+17.3 2008: D+21.6
Not yet ingested
- Civics
- —
Market trends
- HPI YoY
- ▼ -93.25%
- Current HPI
- 304.1951
- Rent YoY
- ▲ 4.04%
- Metro
- Gainesville, FL
- State GDP YoY
- ▲ 3.28%
- F500 in state
- 36
Industry mix (Fortune 500 HQ in FL)
| Industry | F500 HQs | Revenue |
|---|---|---|
| Industrial Technology | 2 | $29B |
|
||
| Insurance | 2 | $17B |
|
||
| Retail | 1 | $60B |
|
||
| Technology Distribution | 1 | $58B |
|
||
| Homebuilding | 1 | $35B |
|
||
| Technology Manufacturing | 1 | $35B |
|
||
Price history
+515.4% since first listed3 events — show timeline
- 2026-05-15 Price Changed $199,997 Stellar MLS as Distributed by MLS Grid
- 2026-04-24 Listed $223,000 Stellar MLS as Distributed by MLS Grid
- 1978-01-01 Sold (Public Records) $32,500 Public Records
Property tax history
-4.7%/yrLatest (2025): $1,059 · +5.3% YoY. Source: county tax records.
Cash-flow waterfall
monthlySold comps — $/sqft
last 12 mo · ≤1 miLoading sold comps…