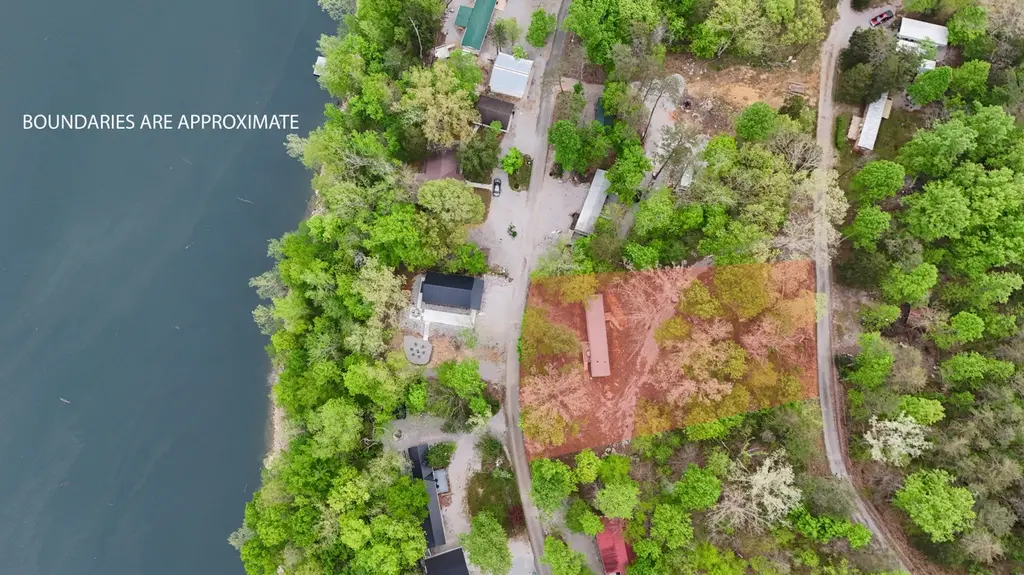
460 N Lake Dr · Burnside, KY
Flood risk 1/10 · Minimal
- FEMA flood zone
- X (unshaded)
- Chance of flooding over 30 yrs
- 0.0%
- Est. flood insurance / yr
- $507 – $1,088
Fire risk 3/10 · Minor
- Est. fire insurance / yr
- $839 – $1,559
Heat risk 4/10 · Minor
- Hot days now (above 102°F)
- 7 days/yr
- Hot days in 30 yrs
- 20 days/yr
Wind risk 2/10 · Minimal
- Chance of severe wind over 30 yrs
- 4.0%
Air-quality risk 1/10 · Minimal
- Unhealthy air days now
- 0 days/yr
- Unhealthy air days in 30 yrs
- 0 days/yr
Risk factors via First Street. Map © Google.
Why this score? — see what drove the C+ grade
The composite is a weighted blend of 9 inputs, each scored 0–100. Each bar is that input's sub-score; the figure is the points it added to the 100-point composite (weight × sub-score).
- Cash flow +21.4/30.0
- Appreciation +7.6/10.0
- DSCR +6.8/10.0
- ARV discount +6.3/15.0
- 1% rule +5.7/10.0
- Schools +4.0/10.0
- Livability +3.6/5.0
- Rent growth +2.5/5.0
- Condition / age +2.5/5.0
$135,000
🖨 Deal sheet 📄 Offer letter ✓ Due diligence
Listing remarks MLS
Lake Living with a View — Fully Furnished in Dixie Bend Welcome to this beautifully maintained 3-bedroom, 2-bath manufactured home, nestled on a peaceful, wooded lot in the desirable Dixie Bend boating community. Enjoy Lake Cumberland views right from your front porch, the perfect spot for morning coffee or winding down in the evenings. Fully furnished and move-in ready—just bring your clothes and start enjoying lake life from day one. This property also features: Private neighborhood boat slip, Quiet, wooded setting for privacy, and a Neighborhood watch for added peace of mind. Whether you're looking for a vacation getaway, a full-time residence, or an Airbnb investment, this one checks every box. Turnkey properties this close to Lake Cumberland are hard to find.
Key facts
- Quiet wooded setting
- 0.7 acre lot
- Built 2003
Tags
Neighborhood map
What this means for you Summary
Snapshot
- This is a 3-bed/2.0-bath other listed at $135k.
Deal economics
- At list price, monthly cash flow is $199 ($2k/yr) — positive.
- The deal already cash-flows at list — no discount required.
- Meets the 1% rule at list price ($1k rent vs $135k).
- Recommended offer: $127k (6.0% below list) — sets the bar for market timing.
- Cap rate 8.1% vs local median 3.0% in Burnside — top-decile yield for the area; either an underpriced asset or a hidden risk that comps aren't pricing in. Stress-test before assuming the spread holds.
Location & tenants
- Location reads 71/100 on livability (#141 in KY) — a middle-class / working-renter tenant base. Strengths: crime A+, cost of living A+, health & safety A+; Watch: schools D+, amenities F, commute F.
- Pulaski County (town): math 43% / reading 53% proficiency, ranked #17 of 165 in KY (top 10%) — families likely to look elsewhere, expect single-tenant / working-renter base with shorter leases.
- Market conditions: 84 active listings in the ZIP; 117 units permitted in Pulaski County in 2024 (50 in 5+ unit buildings).
Forward outlook
- In year one you build about $8k of equity ($933 loan paydown + $7k appreciation (5.2% local appreciation)).
- At projected returns (5.2% appreciation + 3.0% rent growth), your $38k cash investment doubles in ~4 years — after that, you're playing with house money.
- By year 5, paydown + projected appreciation supports a ~$35k cash-out refi (75% LTV) — recoverable capital for the next deal without selling this one.
Negotiation context
- It's been on market 64 days — a 6% lower offer ($127k) is reasonable based on typical stale-listing flexibility.
Questions for the listing agent
- It's been on market 64 days. Have you received any prior offers? Is the seller open to a 6% concession, seller financing, or rate buy-down credit?
- What does the HOA fee cover, when was the last increase, and are there any pending special assessments or reserve-fund shortfalls?
- Why hasn't it sold? Are there any deal-killer items the seller is aware of (foundation, flood, title, zoning, code violations)?
- Is there a deadline driving the sale (1031 exchange, divorce, estate, relocation)? That informs how much negotiation room exists.
- Schools are D-rated, which usually means shorter tenancies and higher turnover. Who's the typical renter profile here, and what's been the actual vacancy rate?
- What's the average days-on-market for RENTAL listings here right now (not sales)? A rising rental-DOM trend means longer vacancies and softer asking-rent achievability than the comps imply.
- What's the recent tenant-quality profile in this submarket — average credit score on applications, eviction rate, late-payment / NSF rate, and stable-employment percentage? A property-management company in the area should have these aggregated.
- How much new for-sale + rental construction is in the pipeline within 1–3 miles? Heavy new supply typically softens prices + rents 12–24 months out; constrained supply supports both.
Investment metrics
- 1% rule
- 1.07% ✓
- Cap rate
- 8.06%
- Cash-on-cash
- 6.32%
- DSCR
- 1.28
- GRM
- 7.8
CMA / ARV
- ARV (median comp)
- $131,482
- List price
- $135,000
- Delta
- 2.68%
- Verdict
- FAIR
- Comps
- 8 within 1.0 mi
Projected returns pro-forma
5.19% appreciation · 3.0% rent growth · sell at horizon
- IRR
- 18.7%
- Equity multiple
- 2.20×
- Total profit
- $45,309
- Equity at exit
- $78,091
- IRR
- 18.6%
- Equity multiple
- 4.32×
- Total profit
- $125,414
- Equity at exit
- $136,107
Cash invested: $37,800 (down + closing). Projections, not guarantees.
Landlord ↔ Tenant lean methodology
- Overall (STATE)
- 83 Strongly Landlord-Friendly
- State Kentucky
- 83 Strongly Landlord-Friendly · R+16
- County
- — inherits STATE
- City
- — inherits STATE
ZIP-level market 42519
- Home prices YoY
- 1.5%
- Active inventory
- 84
- Price-to-rent
- 7.8×
Monthly cashflow live
- Estimated rent
- $1,449 medium interval (Pro) →
- Mortgage (P&I)
- −$708
- Tax est. 1.5%
- −$169 /mo · $2,025/yr
- Insurance
- −$56
- HOA
- −$13
- Vacancy / Maint / Mgmt
- −$304
- Net cashflow
- $199
Break-even live
UW: 25.0% down · 7.5% · 30yr · 1.5% tax · 5.0% vac · 8.0% maint · 8.0% mgmt
Financing live
Cash to close
- Down payment
- $33,750
- Closing costs
- $4,050
- Reserves months
- —
- Total cash needed
- —
Loan-product check · same deal, 3 products live
Conventional
25% down · 7.5% · 30yr
- Down + closing
- —
- Monthly P&I
- —
- Monthly cashflow
- —
- DSCR
- —
- Eligible?
- —
Personal DTI + credit; lowest rate.
DSCR
20% down · 8.5% · 30yr
- Down + closing
- —
- Monthly P&I
- —
- Monthly cashflow
- —
- DSCR
- —
- Eligible?
- —
No personal income docs; deal must DSCR.
Hard money
10% down · 12.0% · 12mo
- Down + closing
- —
- Monthly P&I
- —
- Monthly cashflow
- —
- DSCR
- —
- Eligible?
- —
Short-term bridge; refi at stabilization.
HOA detail
- Monthly dues
- $13 · $156/yr
Listing history 17 events
-
2026-06-18days on market $135,000 Active 64 DOM
-
2026-06-17days on market $135,000 Active 63 DOM
-
2026-06-16days on market $135,000 Active 62 DOM
-
2026-06-15days on market $135,000 Active 61 DOM
-
2026-06-13days on market $135,000 Active 59 DOM
-
2026-06-12days on market $135,000 Active 58 DOM
-
2026-06-09days on market $135,000 Active 55 DOM
-
2026-06-08days on market $135,000 Active 54 DOM
-
2026-06-07days on market $135,000 Active 53 DOM
-
2026-06-07days on market $135,000 Active 52 DOM
-
2026-06-04days on market $135,000 Active 49 DOM
-
2026-06-02days on market $135,000 Active 48 DOM
-
2026-06-01days on market $135,000 Active 47 DOM
-
2026-05-31days on market $135,000 Active 46 DOM
-
2026-05-31days on market $135,000 Active 45 DOM
-
2026-05-18price $135,000 789-char remark
Show marketing remark (789 chars)
Lake Living with a View — Fully Furnished in Dixie Bend Welcome to this beautifully maintained 3-bedroom, 2-bath manufactured home, nestled on a peaceful, wooded lot in the desirable Dixie Bend boating community. Enjoy Lake Cumberland views right from your front porch, the perfect spot for morning coffee or winding down in the evenings. Fully furnished and move-in ready—just bring your clothes and start enjoying lake life from day one. This property also features: Private neighborhood boat slip, Quiet, wooded setting for privacy, and a Neighborhood watch for added peace of mind. Whether you're looking for a vacation getaway, a full-time residence, or an Airbnb investment, this one checks every box. Turnkey properties this close to Lake Cumberland are hard to find.
-
2026-04-15$140,000 Active 789-char remark
Show marketing remark (789 chars)
Lake Living with a View — Fully Furnished in Dixie Bend Welcome to this beautifully maintained 3-bedroom, 2-bath manufactured home, nestled on a peaceful, wooded lot in the desirable Dixie Bend boating community. Enjoy Lake Cumberland views right from your front porch, the perfect spot for morning coffee or winding down in the evenings. Fully furnished and move-in ready—just bring your clothes and start enjoying lake life from day one. This property also features: Private neighborhood boat slip, Quiet, wooded setting for privacy, and a Neighborhood watch for added peace of mind. Whether you're looking for a vacation getaway, a full-time residence, or an Airbnb investment, this one checks every box. Turnkey properties this close to Lake Cumberland are hard to find.
ⓘ Source: listings_history table (triggers on properties + properties_extension) + one-shot
backfill from property_details.listing_events for pre-trigger history.
Climate risk First Street
- Flood 1/10 Low FEMA zone X (unshaded) · 0% chance over 30 yrs
- Wildfire 3/10 Moderate
- Heat 4/10 Moderate 7 d/yr ≥102°F today · 20 d/yr by 30 yrs out
- Wind 2/10 Low 4% chance of damaging wind over 30 yrs
- Air quality 1/10 Low 0 unhealthy d/yr today · 0 by 30 yrs out
Nearby sold comps map
Loading sold comps map…
Walkable amenities ~0.75 mi
Loading nearby amenities…
Taxation est. · year 1
- Rental income
- $17,391
- − Mortgage interest
- −$7,562
- − Property taxes
- −$2,025
- − Insurance
- −$675
- − Repairs & maintenance
- −$1,391
- − Management
- −$1,391
- − HOA
- −$156
- − Depreciation
- −$3,927
- Taxable income
- $263
- Est. tax owed @ 24.0%
- −$63
- After-tax cash flow
- $2,324/yr
For passive investors: Depreciation is non-cash, so a rental often shows a tax loss while cash-flowing — sheltering income. Rental losses are passive: they offset passive income freely, and up to $25,000/yr can offset ordinary (W-2) income if you actively participate and your MAGI is under $100k (phasing out to $0 by $150k); unused losses carry forward. On sale, claimed depreciation is recaptured at up to 25%, and gains may owe capital-gains tax (a 1031 exchange can defer both). Figures are a year-1 estimate at your 24.0% rate — not tax advice; consult a CPA.
Schools (NCES district)
- District
- Pulaski County
- NCES district ID
- 2104950
- Math proficiency
- 43% ▼ -18.00%
- Reading proficiency
- 53% ▼ -13.00%
- Median HH income
- $35,366
- Composite
- 39.69/100
- National rank
- #3906
- State rank
- #17 of 165 in KY
Livability — Burnside
- Score
- 71/100
- State rank
- #141
- US rank
- #6774
Category grades
Schools grade is shown separately in the Schools card above.
Census & demographics
- Population (ZIP)
- 2,800
Population outlook (Pulaski County) Hauer SSP2
- Today (2025)
- 65,414 people
- By 2030
- 65,828 · +0.6%
- By 2040
- 65,972 · +0.9%
- By 2050
- 65,108 · -0.5%
- By 2075
- 61,647 · -5.8%
- By 2100
- 53,613 · -18.0%
Race, ethnicity, and origin ACS 2023
- Neighborhood character
- Predominantly White (88%)
- Race & ethnicity
- White 88% Two or more races 10% Hispanic / Latino 3% Native American 1%
- Common ancestry
- Italian 2% Serbian 1% Lithuanian 1%
- Foreign-born
- 1% · Canada
Political lean MEDSL · Pulaski
- 2024 margin
- Solid R (+65.2) · D 16.9% · R 82.1% · Other 1.0%
- 2008→2024 swing
- -9.9pp toward R · 2008: -55.4pp · 2024: -65.2pp
- All cycles
- 2024: R+65.2 2020: R+62.7 2016: R+66.7 2012: R+60.5 2008: R+55.4
Not yet ingested
- Civics
- —
Market trends
- HPI YoY
- ▲ 5.19%
- Current HPI
- 358.2137
- Rent YoY
- —
- Metro
- —
- State GDP YoY
- ▲ 1.81%
- F500 in state
- 4
Industry mix (Fortune 500 HQ in KY)
| Industry | F500 HQs | Revenue |
|---|---|---|
| Healthcare | 1 | $118B |
|
||
| Food / Beverage | 1 | $7B |
|
||
Price history
-3.6% since first listed2 events — show timeline
- 2026-05-18 Price Changed $135,000 ImagineMLS
- 2026-04-15 Listed $140,000 ImagineMLS
Property tax history
+21.0%/yrLatest (2025): $253 · -2.3% YoY. Source: county tax records.
Cash-flow waterfall
monthlySold comps — $/sqft
last 12 mo · ≤1 miLoading sold comps…