 Multi-family
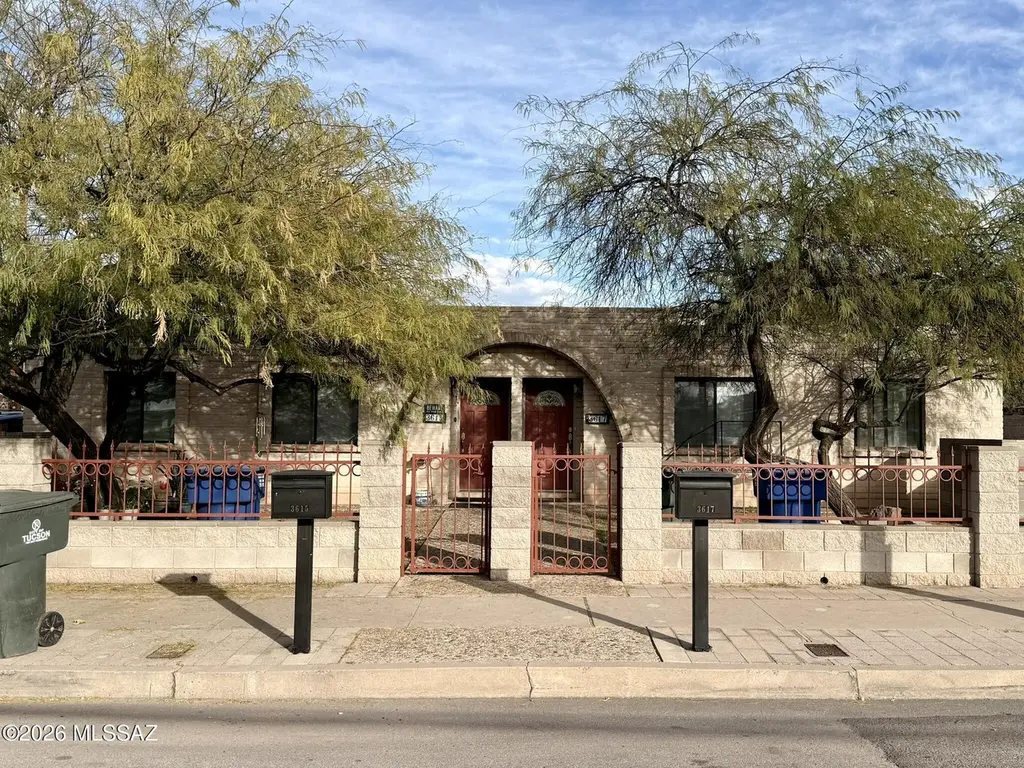
3615 S Lundy Ave · Tucson, AZ
Flood risk 1/10 · Minimal
- FEMA flood zone
- X (unshaded)
- Chance of flooding over 30 yrs
- 0.0%
- Est. flood insurance / yr
- $507 – $1,088
Fire risk 5/10 · Moderate
- Est. fire insurance / yr
- $610 – $1,132
Heat risk 8/10 · Major
- Hot days now (above 106°F)
- 7 days/yr
- Hot days in 30 yrs
- 19 days/yr
Wind risk 1/10 · Minimal
- Chance of severe wind over 30 yrs
- —
Air-quality risk 1/10 · Minimal
- Unhealthy air days now
- 0 days/yr
- Unhealthy air days in 30 yrs
- 0 days/yr
Risk factors via First Street. Map © Google.
Why this score? — see what drove the D grade
The composite is a weighted blend of 9 inputs, each scored 0–100. Each bar is that input's sub-score; the figure is the points it added to the 100-point composite (weight × sub-score).
- Cash flow +15.1/30.0
- ARV discount +9.4/15.0
- DSCR +4.6/10.0
- Livability +3.7/5.0
- 1% rule +3.1/10.0
- Rent growth +2.6/5.0
- Condition / age +2.5/5.0
- Schools +1.6/10.0
- Appreciation +0.0/10.0
$299,900
🖨 Deal sheet (PDF) 📄 Offer letter ✓ Due diligence
Multi-family units
County records classify this as Multi-Family (2-4 Unit). Listing-text estimate: 1 unit. estimate disagrees with records
Listing remarks MLS
Fantastic du-plex with steady rental activity, clean units, and space for parking. Each unit is a 2 bedroom/1 bath accompanied with a generous living space at the entry. Floorplan flows to kitchen. Each unit has their own backyard space, laundry, and side yard for parking for at least 2 cars - each unit. Located minutes from I-10 - this multi unit is ready to go.
Key facts
- Parking
- Side yard
- Clean units
Tags
Neighborhood map
What this means for you Summary
Snapshot
- This is a 4-bed/2.0-bath multifamily listed at $300k.
Deal economics
- At list price, monthly cash flow is $100 ($1k/yr) — positive.
- The deal already cash-flows at list — no discount required.
- To meet the 1% rule (rent ≥ 1% of price), the offer needs to be $242k (19.4% below list).
- Recommended offer: $242k (19.4% below list) — sets the bar for 1% rule.
- Cap rate 6.7% vs local median 3.7% in Tucson — top-decile yield for the area; either an underpriced asset or a hidden risk that comps aren't pricing in. Stress-test before assuming the spread holds.
Location & tenants
- Location reads 74/100 on livability (#17 in AZ, #4,502 nationally) — a middle-class / working-renter tenant base. Strengths: commute A+, cost of living A+, housing A+; Watch: health & safety C-, crime F, employment D-.
- Tucson Unified District (4403) (urban): math 14% / reading 23% proficiency, ranked #190 of 249 in AZ (top 76%) — low school quality limits family demand, transient renter base, plan for 1-2y turnover.
- Zoned schools: Hollinger K-8 School (math 20% / reading 22%, grade F, #722 of 1,109 statewide, top 66%, 687 students, 78% FRL); Utterback Middle School (math 6% / reading 17%, grade F, #180 of 218 statewide, top 83%, 263 students, 80% FRL); Pueblo High School (math 12% / reading 17%, grade F, #267 of 381 statewide, top 72%, 1,831 students, 65% FRL).
- Market conditions: Rents flat; 267 active listings in the ZIP; 17 comparable units currently listed for rent nearby; rentals at typical pace (median 18d on market — plan ~3-4 weeks tenant-placement turnaround); 5,268 units permitted in Pima County in 2024 (996 in 5+ unit buildings).
- At $2,418/mo this rent would consume 55% of the median local household income ($53k/yr) (locally 1517% of renters already pay >50% of income on rent) — very limited rent-growth headroom before tenants either downsize or default.
Forward outlook
- Local home prices are declining (-3.0%/yr); year-one equity from $2k of loan paydown is wiped out by about $9k of value loss. Plan a longer hold.
- Pima County population projected at +8% by 2050 — modest demand growth; plan on rents tracking national, not racing it.
Negotiation context
- It's been on market 118 days — a 9% lower offer ($273k) is reasonable based on typical stale-listing flexibility.
- 3 sale attempts with the ask held roughly flat each time — persistent listings suggest the price (not the market) is what's stuck; bring a comps-based counter.
Risks & watch-outs
- Climate carrying-cost: moderate wildfire risk; extreme-heat days projected 7→19/yr by 2055 (HVAC capex compounding) — expect insurance premiums to compound above CPI over the hold.
Questions for the listing agent
- It's been on market 118 days. Have you received any prior offers? Is the seller open to a 19% concession, seller financing, or rate buy-down credit?
- Built in 1969 — when were the roof, HVAC, electrical panel, plumbing, and water heater last replaced?
- Why hasn't it sold? Are there any deal-killer items the seller is aware of (foundation, flood, title, zoning, code violations)?
- Is there a deadline driving the sale (1031 exchange, divorce, estate, relocation)? That informs how much negotiation room exists.
- Schools are D-rated, which usually means shorter tenancies and higher turnover. Who's the typical renter profile here, and what's been the actual vacancy rate?
- Crime grade is F in this area — have there been break-ins, vandalism, or insurance claims at this property in the last 3 years? What carrier currently insures it and at what premium?
- The area grade is low — what's the realistic commute time and amenity access for the typical tenant pool here? Any planned neighborhood developments (good or bad) we should know about?
- What's the average days-on-market for RENTAL listings here right now (not sales)? A rising rental-DOM trend means longer vacancies and softer asking-rent achievability than the comps imply.
- What's the recent tenant-quality profile in this submarket — average credit score on applications, eviction rate, late-payment / NSF rate, and stable-employment percentage? A property-management company in the area should have these aggregated.
- How much new apartment / multifamily construction is in the pipeline within 1–3 miles? Heavy new supply (>2% of stock underway) typically softens rents 12–24 months out; light construction supports rent growth.
Investment metrics
- 1% rule
- 0.81% ✗
- Cap rate
- 6.69%
- Cash-on-cash
- 1.43%
- DSCR
- 1.06
- GRM
- 10.3
CMA / ARV
- ARV (median comp)
- $313,296
- List price
- $299,900
- Delta
- -4.28%
- Verdict
- FAIR
- Comps
- 20 within 1.0 mi
Show comp detail 5 sales within ~0.75 mi
| Address | Dist | Beds/Ba | Sqft | Sold | Price | $/sf | Match |
|---|---|---|---|---|---|---|---|
| 3613-3615 S Belmar Ave | 0.13mi | 4/2.0 | 1,608 (-7%) | 3mo | $337,500 | $210 | 79 |
| 528 W Columbia St | 0.54mi | 3/3.0 (-1) | 1,621 (-7%) | 4mo | $310,000 | $191 | 51 |
| 501 W Pennsylvania Dr | 0.70mi | 5/3.0 (+1) | 1,882 (+8%) | 2mo | $420,000 | $223 | 42 |
| 3820 S 3rd Ave | 0.64mi | 4/4.0 | 1,956 (+13%) | 0mo | $379,000 | $194 | 40 |
| 3819 S 16th Ave | 0.49mi | 5/3.0 (+1) | 1,882 (+8%) | 20mo | $425,000 | $226 | 37 |
Match score weights: distance 35% · size 25% · config 20% · recency 20%. Top-matched comps best support the ARV.
Projected returns pro-forma
-3.0% appreciation · 0.21% rent growth · sell at horizon
- IRR
- -16.9%
- Equity multiple
- 0.42×
- Total profit
- $-48,930
- Equity at exit
- $44,716
- IRR
- -14.1%
- Equity multiple
- 0.28×
- Total profit
- $-60,507
- Equity at exit
- $25,930
Cash invested: $83,972 (down + closing). Projections, not guarantees.
Landlord ↔ Tenant lean methodology
- Overall (STATE)
- 87 Strongly Landlord-Friendly
- State Arizona
- 87 Strongly Landlord-Friendly · R+3
- County
- — inherits STATE
- City
- — inherits STATE
ZIP-level market 85713
- Home prices YoY
- -24.5%
- Rents YoY
- 0.2%
- Active inventory
- 267
- Price-to-rent
- 20.7×
Monthly cashflow live
- Estimated rent
- $2,418 high interval (Pro) →
- Mortgage (P&I)
- −$1,573
- Tax from tax record
- −$112 /mo · $1,346/yr
- Insurance
- −$125
- HOA
- −$0
- Vacancy / Maint / Mgmt
- −$508
- Net cashflow
- $100
Break-even live
Sensitivity live
| Price | -10% $270 | -5% $185 | +0% $100 | +5% $16 | +10% $-69 |
|---|---|---|---|---|---|
| Rent | -10% $-91 | -5% $5 | +0% $100 | +5% $196 | +10% $291 |
| Rate | -1.0pp $251 | -0.5pp $177 | base $100 | +0.5pp $23 | +1.0pp $-56 |
2-unit breakdown (identical units grouped — click to expand)
| Units | Beds | Baths | Est. rent |
|---|---|---|---|
| 2× units | 2 | 1 | $2,418 |
| #1 | 2 | 1 | $1,209 |
| #2 | 2 | 1 | $1,209 |
| Total (2 units) | $2,418 | ||
UW: 25.0% down · 7.5% · 30yr · 1.5% tax · 5.0% vac · 8.0% maint · 8.0% mgmt
Financing live
Cash to close
- Down payment
- $74,975
- Closing costs
- $8,997
- Reserves months
- —
- Total cash needed
- —
Loan-product check · same deal, 3 products live
Conventional
25% down · 7.5% · 30yr
- Down + closing
- —
- Monthly P&I
- —
- Monthly cashflow
- —
- DSCR
- —
- Eligible?
- —
Personal DTI + credit; lowest rate.
DSCR
20% down · 8.5% · 30yr
- Down + closing
- —
- Monthly P&I
- —
- Monthly cashflow
- —
- DSCR
- —
- Eligible?
- —
No personal income docs; deal must DSCR.
Hard money
10% down · 12.0% · 12mo
- Down + closing
- —
- Monthly P&I
- —
- Monthly cashflow
- —
- DSCR
- —
- Eligible?
- —
Short-term bridge; refi at stabilization.
Rent comps 17 comps
| Address | Beds | Baths | Sqft | Rent | $/sqft | DOM | Units | Dist |
|---|---|---|---|---|---|---|---|---|
| 3420 S Clark Ave Tucson, AZ | 3.0 | 2.0 | 1100 | $1,495 | $1.36 | 13d | 1 | 0.25mi |
| 4213 S Lundy Ave Tucson, AZ | 3.0 | 1.0 | 1368 | $1,600 | $1.17 | 25d | 1 | 0.50mi |
| 251 W 38th St Tucson, AZ | 3.0 | 2.0 | 1050 | $1,800 | $1.71 | 16d | 1 | 0.61mi |
| 251 W 38th St Tucson, AZ | 3.0 | 2.0 | 1050 | $1,700 | $1.62 | 46d | 1 | 0.61mi |
| 251 W 38th St Tucson, AZ | 4.0 | 2.0 | 1880 | $2,400 | $1.28 | 5d | 1 | 0.61mi |
| 4050 S Kostka Ave Tucson, AZ | 3.0 | 1.0 | 1568 | $1,895 | $1.21 | 3d | 1 | 0.96mi |
| 1074 W Pennsylvania St Tucson, AZ | 4.0 | 2.0 | 1276 | $1,395 | $1.09 | 16d | 1 | 0.97mi |
| 202 E 32nd St Tucson, AZ | 3.0 | 1.0 | 1251 | $1,599 | $1.28 | 4d | 1 | 1.16mi |
| 202 E 32nd St Tucson, AZ | 3.0 | 1.0 | 1251 | $1,599 | $1.28 | 25d | 1 | 1.16mi |
| 2640 S Cottonwood Ln Unit 13 Tucson, AZ | 3.0 | 2.0 | 1200 | $1,395 | $1.16 | 45d | 1 | 1.18mi |
| 808 E 35th St Unit 1 Tucson, AZ | 3.0 | 2.0 | 1079 | $1,475 | $1.37 | 18d | 1 | 1.27mi |
| 808 E 35th St Tucson, AZ | 3.0 | 2.0 | 1079 | $1,525 | $1.41 | 25d | 1 | 1.27mi |
| 838 E 35th St Tucson, AZ | 4.0 | 2.0 | 1770 | $1,865 | $1.05 | 13d | 1 | 1.30mi |
| 2805 S Park Ave Tucson, AZ | 2.0–3.0 | 2.0 | 1236 | $2,350 | $1.90 | 3d | 6 | 1.32mi |
| 4608 S Fremont Ave Tucson, AZ | 4.0 | 2.0 | 1800 | $1,850 | $1.03 | 45d | 1 | 1.45mi |
| 425 W 26th St Tucson, AZ | 3.0 | 2.0 | 1250 | $1,450 | $1.16 | 45d | 1 | 1.47mi |
| 135 W 26th St Tucson, AZ | 3.0 | 2.0 | 1700 | $2,450 | $1.44 | 45d | 1 | 1.48mi |
Listing history 20 events
-
2026-06-21days on market $299,900 Active 118 DOM
-
2026-06-18days on market $299,900 Active 115 DOM
-
2026-06-17days on market $299,900 Active 114 DOM
-
2026-06-16days on market $299,900 Active 113 DOM
-
2026-06-15days on market $299,900 Active 112 DOM
-
2026-06-13days on market $299,900 Active 110 DOM
-
2026-06-10days on market $299,900 Active 107 DOM
-
2026-06-09days on market $299,900 Active 106 DOM
-
2026-06-08days on market $299,900 Active 105 DOM
-
2026-06-07days on market $299,900 Active 104 DOM
-
2026-06-05days on market $299,900 Active 101 DOM
-
2026-06-03days on market $299,900 Active 100 DOM
-
2026-06-02days on market $299,900 Active 99 DOM
-
2026-06-01days on market $299,900 Active 98 DOM
-
2026-05-31days on market $299,900 Active 97 DOM
-
2026-05-11status Active 366-char remark
Show marketing remark (366 chars)
Fantastic du-plex with steady rental activity, clean units, and space for parking. Each unit is a 2 bedroom/1 bath accompanied with a generous living space at the entry. Floorplan flows to kitchen. Each unit has their own backyard space, laundry, and side yard for parking for at least 2 cars - each unit. Located minutes from I-10 - this multi unit is ready to go.
-
2026-04-08historical Active Contingent 366-char remark
Show marketing remark (366 chars)
Fantastic du-plex with steady rental activity, clean units, and space for parking. Each unit is a 2 bedroom/1 bath accompanied with a generous living space at the entry. Floorplan flows to kitchen. Each unit has their own backyard space, laundry, and side yard for parking for at least 2 cars - each unit. Located minutes from I-10 - this multi unit is ready to go.
-
2026-03-11status Active 366-char remark
Show marketing remark (366 chars)
Fantastic du-plex with steady rental activity, clean units, and space for parking. Each unit is a 2 bedroom/1 bath accompanied with a generous living space at the entry. Floorplan flows to kitchen. Each unit has their own backyard space, laundry, and side yard for parking for at least 2 cars - each unit. Located minutes from I-10 - this multi unit is ready to go.
-
2026-03-06historical Active Contingent 366-char remark
Show marketing remark (366 chars)
Fantastic du-plex with steady rental activity, clean units, and space for parking. Each unit is a 2 bedroom/1 bath accompanied with a generous living space at the entry. Floorplan flows to kitchen. Each unit has their own backyard space, laundry, and side yard for parking for at least 2 cars - each unit. Located minutes from I-10 - this multi unit is ready to go.
-
2026-02-23$299,900 Active 366-char remark
Show marketing remark (366 chars)
Fantastic du-plex with steady rental activity, clean units, and space for parking. Each unit is a 2 bedroom/1 bath accompanied with a generous living space at the entry. Floorplan flows to kitchen. Each unit has their own backyard space, laundry, and side yard for parking for at least 2 cars - each unit. Located minutes from I-10 - this multi unit is ready to go.
ⓘ Source: listings_history table (triggers on properties + properties_extension) + one-shot
backfill from property_details.listing_events for pre-trigger history.
Tax reassessment forecast AZ · Resets to sale price
- Current annual tax
- $1,346 · $112/mo
- Projected year-2 tax
- $1,979 · $165/mo
- Expected delta
- +$634/yr (+$53/mo · 47.1%)
ⓘ Screening estimate from a state-policy table — verify with the county assessor before closing.
Climate risk First Street
- Flood 1/10 Low FEMA zone X (unshaded) · 0% chance over 30 yrs
- Wildfire 5/10 Major
- Heat 8/10 Severe 7 d/yr ≥106°F today · 19 d/yr by 30 yrs out
- Wind 1/10 Low
- Air quality 1/10 Low 0 unhealthy d/yr today · 0 by 30 yrs out
Nearby sold comps map
Loading sold comps map…
Walkable amenities ~0.75 mi
Loading nearby amenities…
Taxation est. · year 1
- Rental income
- $29,016
- − Mortgage interest
- −$16,799
- − Property taxes
- −$1,346
- − Insurance
- −$1,500
- − Repairs & maintenance
- −$2,321
- − Management
- −$2,321
- − Depreciation
- −$8,724
- Taxable loss
- −$3,995
- Est. tax savings @ 24.0%
- +$959
- After-tax cash flow
- $2,164/yr
For passive investors: Depreciation is non-cash, so a rental often shows a tax loss while cash-flowing — sheltering income. Rental losses are passive: they offset passive income freely, and up to $25,000/yr can offset ordinary (W-2) income if you actively participate and your MAGI is under $100k (phasing out to $0 by $150k); unused losses carry forward. On sale, claimed depreciation is recaptured at up to 25%, and gains may owe capital-gains tax (a 1031 exchange can defer both). Figures are a year-1 estimate at your 24.0% rate — not tax advice; consult a CPA.
Schools (NCES district)
- District
- Tucson Unified District (4403)
- NCES district ID
- 0408800
- Math proficiency
- 14% ▼ -17.00%
- Reading proficiency
- 23% ▼ -11.00%
- Median HH income
- $40,962
- Composite
- 15.78/100
- National rank
- #9270
- State rank
- #190 of 249 in AZ
Livability — Tucson
- Score
- 74/100
- State rank
- #17
- US rank
- #4502
Category grades
Schools grade is shown separately in the Schools card above.
Census & demographics
- Census place
- Tucson, AZ
- County
- Pima County · 1,012,107 people
- City population
- 839,336
- Metro
- Tucson, AZ
- Population (ZIP)
- 46,439
- Household income
- $53,152
- Rent vs Own
- Severe rent burden
- 1517.0
Population outlook (Pima County) Hauer SSP2
- Today (2025)
- 1,066,056 people
- By 2030
- 1,086,684 · +1.9%
- By 2040
- 1,117,160 · +4.8%
- By 2050
- 1,149,778 · +7.9%
- By 2075
- 1,271,480 · +19.3%
- By 2100
- 1,321,160 · +23.9%
Race, ethnicity, and origin ACS 2023
- Neighborhood character
- Predominantly Hispanic (70%)
- Race & ethnicity
- Hispanic / Latino 70% Two or more races 30% White 21% Native American 5% Black 3% Asian 1%
- Hispanic origin (detail)
- Mexican 67%
- Common ancestry
- Italian 1% Lithuanian 1% Portuguese 1%
- Foreign-born
- 19% · Canada, China
- Languages at home
- 49% English-only · Spanish 49%
Political lean MEDSL · Pima
- 2024 margin
- D (+15.2) · D 57.0% · R 41.8% · Other 1.2%
- 2008→2024 swing
- +9.1pp toward D · 2008: 6.1pp · 2024: 15.2pp
- All cycles
- 2024: D+15.2 2020: D+18.7 2016: D+13.5 2012: D+5.8 2008: D+6.1
Not yet ingested
- Civics
- —
Market trends
- HPI YoY
- ▼ -107.07%
- Current HPI
- 329.8338
- Rent YoY
- ▲ 0.21%
- Metro
- Tucson, AZ
- State GDP YoY
- ▲ 4.54%
- F500 in state
- 20
Industry mix (Fortune 500 HQ in AZ)
| Industry | F500 HQs | Revenue |
|---|---|---|
| Technology | 2 | $13B |
|
||
| Mining / Metals | 1 | $23B |
|
||
| Environmental Services | 1 | $16B |
|
||
| Metals / Steel | 1 | $14B |
|
||
| Technology Distribution | 1 | $9B |
|
||
| Homebuilding | 1 | $8B |
|
||
Price history
5 events — show timeline
- 2026-05-11 Relisted — MLSSAZ
- 2026-04-08 Contingent — MLSSAZ
- 2026-03-11 Relisted — MLSSAZ
- 2026-03-06 Contingent — MLSSAZ
- 2026-02-23 Listed $299,900 MLSSAZ
Property tax history
+2.9%/yrLatest (2025): $1,346 · +4.2% YoY. Source: county tax records.
Cash-flow waterfall
monthlySold comps — $/sqft
last 12 mo · ≤1 miLoading sold comps…