400 N Unitah St · Porum, OK
Flood risk No data
- FEMA flood zone
- —
- Chance of flooding over 30 yrs
- —
- Est. flood insurance / yr
- —
Fire risk No data
- Est. fire insurance / yr
- —
Heat risk No data
- Hot days now (above threshold)
- —
- Hot days in 30 yrs
- —
Wind risk No data
- Chance of severe wind over 30 yrs
- —
Air-quality risk No data
- Unhealthy air days now
- —
- Unhealthy air days in 30 yrs
- —
Risk factors via First Street. Map © Google.
Why this score? — see what drove the B+ grade
The composite is a weighted blend of 9 inputs, each scored 0–100. Each bar is that input's sub-score; the figure is the points it added to the 100-point composite (weight × sub-score).
- Cash flow +30.0/30.0
- 1% rule +10.0/10.0
- DSCR +10.0/10.0
- Appreciation +8.3/10.0
- ARV discount +7.5/15.0
- Livability +3.1/5.0
- Rent growth +2.5/5.0
- Condition / age +2.5/5.0
- Schools +1.7/10.0
$58,320
🖨 Deal sheet 📄 Offer letter ✓ Due diligence
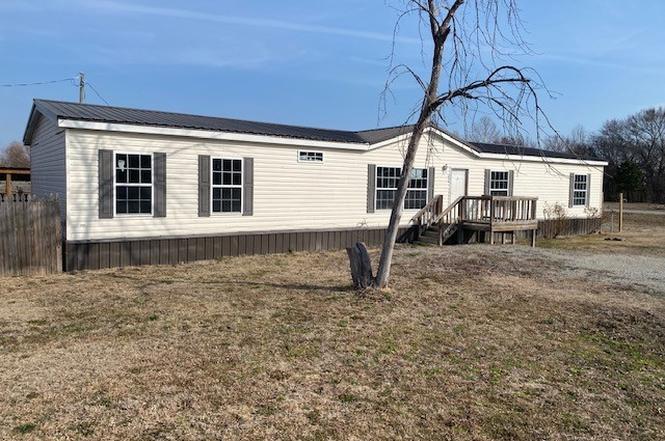
Listing remarks
Manufactured home with 3 bedrooms , 2 bathrooms. Features 2 living areas with fireplace in the den. Privacy fence and a corner lot. All this on . 32 of an acre. FHA $100 Down Sales Incentive for Owner Occupant
Key facts
- Privacy fence
- 2 living areas
- Fireplace in the den
Tags
Property features AI
Finance
- Other: Lot size approximately 0.321 acres
- Financial info: Annual taxes listed (financial specifics excluded per instructions)
- HOA & community: HOA information not provided
Exterior
- Parking: Parking details not provided
- Security: No safety shelter
- Utilities: Public water; Public sewer
- Home design: Single-story; South-facing; Modular/Prefabricated home
- Construction: Metal roof; Vinyl siding; Tie-down foundation; Built year source: Public records
- Exterior features: Deck; Privacy fencing; No other exterior features listed
Interior
- Kitchen: Laminate counters
- Bedrooms: Bedroom count not provided
- Flooring: Carpet; Tile
- Bathrooms: 2 full bathrooms
- Heating & cooling: Central heating (electric); Central air conditioning
- Interior features: Aluminum-framed windows; Laminate countertops; No additional interior features listed
- Laundry & utility: Electric water heater
Neighborhood map
What this means for you Summary
Snapshot
- This is a 3-bed/2.0-bath manufactured listed at $58k.
Deal economics
- At list price, monthly cash flow is $513 ($6k/yr) — positive.
- The deal already cash-flows at list — no discount required.
- Meets the 1% rule at list price ($1k rent vs $58k).
- Recommended offer: $53k (9.0% below list) — sets the bar for market timing.
Location & tenants
- Location reads 62/100 on livability (#240 in OK) — a middle-class / working-renter tenant base. Strengths: cost of living A+, housing A+, health & safety A+; Watch: schools F, crime F, amenities F.
- Porum (rural): math 19% / reading 24% proficiency, ranked #172 of 270 in OK (top 64%) — low school quality limits family demand, transient renter base, plan for 1-2y turnover; 70% free/reduced lunch — lower-income household profile, screen leases tightly.
- Market conditions: 129 active listings in the ZIP; 58 units permitted in Muskogee County in 2024 (0 in 5+ unit buildings).
Forward outlook
- In year one you build about $4k of equity ($403 loan paydown + $4k appreciation (6.6% local appreciation)).
- Muskogee County population projected at -15% by 2050 — secular population decline; favor cash flow + early exit over multi-decade hold.
- At projected returns (6.6% appreciation + 3.0% rent growth), your $16k cash investment doubles in ~2 years — after that, you're playing with house money.
- By year 8, paydown + projected appreciation supports a ~$33k cash-out refi (75% LTV) — recoverable capital for the next deal without selling this one.
Negotiation context
- It's been on market 114 days — a 9% lower offer ($53k) is reasonable based on typical stale-listing flexibility.
Questions for the listing agent
- It's been on market 114 days. Have you received any prior offers? Is the seller open to a 9% concession, seller financing, or rate buy-down credit?
- Why hasn't it sold? Are there any deal-killer items the seller is aware of (foundation, flood, title, zoning, code violations)?
- Is there a deadline driving the sale (1031 exchange, divorce, estate, relocation)? That informs how much negotiation room exists.
- Schools are F-rated, which usually means shorter tenancies and higher turnover. Who's the typical renter profile here, and what's been the actual vacancy rate?
- Crime grade is F in this area — have there been break-ins, vandalism, or insurance claims at this property in the last 3 years? What carrier currently insures it and at what premium?
- What's the average days-on-market for RENTAL listings here right now (not sales)? A rising rental-DOM trend means longer vacancies and softer asking-rent achievability than the comps imply.
- What's the recent tenant-quality profile in this submarket — average credit score on applications, eviction rate, late-payment / NSF rate, and stable-employment percentage? A property-management company in the area should have these aggregated.
- How much new for-sale + rental construction is in the pipeline within 1–3 miles? Heavy new supply typically softens prices + rents 12–24 months out; constrained supply supports both.
Investment metrics
- 1% rule
- 1.99% ✓
- Cap rate
- 16.84%
- Cash-on-cash
- 37.68%
- DSCR
- 2.68
- GRM
- 4.2
CMA / ARV
No comps found within radius.
Projected returns pro-forma
6.57% appreciation · 3.0% rent growth · sell at horizon
- IRR
- 48.5%
- Equity multiple
- 4.15×
- Total profit
- $51,500
- Equity at exit
- $38,777
- IRR
- 44.9%
- Equity multiple
- 8.68×
- Total profit
- $125,492
- Equity at exit
- $72,223
Cash invested: $16,330 (down + closing). Projections, not guarantees.
Landlord ↔ Tenant lean methodology
- Overall (STATE)
- 83 Strongly Landlord-Friendly
- State Oklahoma
- 83 Strongly Landlord-Friendly · R+20
- County
- — inherits STATE
- City
- — inherits STATE
ZIP-level market 74455
- Home prices YoY
- 2.3%
- Active inventory
- 129
- Price-to-rent
- 4.2×
Monthly cashflow live
- Estimated rent
- $1,159 medium interval (Pro) →
- Mortgage (P&I)
- −$306
- Tax est. 1.5%
- −$73 /mo · $875/yr
- Insurance
- −$24
- HOA
- −$0
- Vacancy / Maint / Mgmt
- −$243
- Net cashflow
- $513
Break-even live
UW: 25.0% down · 7.5% · 30yr · 1.5% tax · 5.0% vac · 8.0% maint · 8.0% mgmt
Financing live
Cash to close
- Down payment
- $14,580
- Closing costs
- $1,750
- Reserves months
- —
- Total cash needed
- —
Loan-product check · same deal, 3 products live
Conventional
25% down · 7.5% · 30yr
- Down + closing
- —
- Monthly P&I
- —
- Monthly cashflow
- —
- DSCR
- —
- Eligible?
- —
Personal DTI + credit; lowest rate.
DSCR
20% down · 8.5% · 30yr
- Down + closing
- —
- Monthly P&I
- —
- Monthly cashflow
- —
- DSCR
- —
- Eligible?
- —
No personal income docs; deal must DSCR.
Hard money
10% down · 12.0% · 12mo
- Down + closing
- —
- Monthly P&I
- —
- Monthly cashflow
- —
- DSCR
- —
- Eligible?
- —
Short-term bridge; refi at stabilization.
Listing history 18 events
-
2026-06-18days on market $58,320 Active 114 DOM
-
2026-06-17days on market $58,320 Active 113 DOM
-
2026-06-17price $58,320 Active 112 DOM
-
2026-06-16days on market $68,040 Active 112 DOM
-
2026-06-15days on market $68,040 Active 111 DOM
-
2026-06-13days on market $68,040 Active 109 DOM
-
2026-06-12days on market $68,040 Active 108 DOM
-
2026-06-09days on market $68,040 Active 105 DOM
-
2026-06-08days on market $68,040 Active 104 DOM
-
2026-06-08days on market $68,040 Active 103 DOM
-
2026-06-07days on market $68,040 Active 102 DOM
-
2026-06-04days on market $68,040 Active 99 DOM
-
2026-06-02days on market $68,040 Active 98 DOM
-
2026-06-01days on market $68,040 Active 97 DOM
-
2026-05-31days on market $68,040 Active 96 DOM
-
2026-05-15price $68,040
-
2026-04-14price $74,520
-
2026-02-24$81,000 Active
ⓘ Source: listings_history table (triggers on properties + properties_extension) + one-shot
backfill from property_details.listing_events for pre-trigger history.
Nearby sold comps map
Loading sold comps map…
Walkable amenities ~0.75 mi
Loading nearby amenities…
Taxation est. · year 1
- Rental income
- $13,910
- − Mortgage interest
- −$3,267
- − Property taxes
- −$875
- − Insurance
- −$292
- − Repairs & maintenance
- −$1,113
- − Management
- −$1,113
- − Depreciation
- −$1,697
- Taxable income
- $5,555
- Est. tax owed @ 24.0%
- −$1,333
- After-tax cash flow
- $4,820/yr
For passive investors: Depreciation is non-cash, so a rental often shows a tax loss while cash-flowing — sheltering income. Rental losses are passive: they offset passive income freely, and up to $25,000/yr can offset ordinary (W-2) income if you actively participate and your MAGI is under $100k (phasing out to $0 by $150k); unused losses carry forward. On sale, claimed depreciation is recaptured at up to 25%, and gains may owe capital-gains tax (a 1031 exchange can defer both). Figures are a year-1 estimate at your 24.0% rate — not tax advice; consult a CPA.
Schools (NCES district)
- District
- Porum
- NCES district ID
- 4024840
- Math proficiency
- 19% ▼ -11.00%
- Reading proficiency
- 24% ▼ -5.00%
- Median HH income
- $30,183
- Composite
- 17.25/100
- National rank
- #9092
- State rank
- #172 of 270 in OK
Livability — Porum
- Score
- 62/100
- State rank
- #240
- US rank
- #16214
Category grades
Schools grade is shown separately in the Schools card above.
Census & demographics
- Census place
- Porum, OK
- City population
- 2,717
- Population (ZIP)
- 2,717
Population outlook (Muskogee County) Hauer SSP2
- Today (2025)
- 66,842 people
- By 2030
- 64,969 · -2.8%
- By 2040
- 60,920 · -8.9%
- By 2050
- 56,978 · -14.8%
- By 2075
- 47,160 · -29.4%
- By 2100
- 35,336 · -47.1%
Race, ethnicity, and origin ACS 2023
- Neighborhood character
- Predominantly White (73%)
- Race & ethnicity
- White 73% Native American 15% Two or more races 9% Hispanic / Latino 2%
- Common ancestry
- Italian 1% Portuguese 1%
- Foreign-born
- 1% · Canada
- Languages at home
- 98% English-only · Other Asian/Pacific 1%
Political lean MEDSL · Muskogee
- 2024 margin
- Solid R (+37.6) · D 30.4% · R 68.0% · Other 1.7%
- 2008→2024 swing
- -22.6pp toward R · 2008: -15.0pp · 2024: -37.6pp
- All cycles
- 2024: R+37.6 2020: R+33.9 2016: R+29.2 2012: R+14.8 2008: R+15.0
Not yet ingested
- Civics
- —
Market trends
- HPI YoY
- ▲ 6.57%
- Current HPI
- 288.3386
- Rent YoY
- —
- Metro
- —
- State GDP YoY
- ▲ 1.55%
- F500 in state
- 6
Industry mix (Fortune 500 HQ in OK)
| Industry | F500 HQs | Revenue |
|---|---|---|
| Energy | 3 | $48B |
|
||
Price history
-16.0% since first listed3 events — show timeline
- 2026-05-15 Price Changed $68,040 MLS Technology, Inc.
- 2026-04-14 Price Changed $74,520 MLS Technology, Inc.
- 2026-02-24 Listed $81,000 MLS Technology, Inc.
Cash-flow waterfall
monthlySold comps — $/sqft
last 12 mo · ≤1 miLoading sold comps…