150 Burkewood Rd · Mount Vernon, NY
Flood risk 1/10 · Minimal
- FEMA flood zone
- X (unshaded)
- Chance of flooding over 30 yrs
- 0.0%
- Est. flood insurance / yr
- $507 – $1,088
Fire risk 1/10 · Minimal
- Est. fire insurance / yr
- $691 – $1,283
Heat risk 6/10 · Moderate
- Hot days now (above 98°F)
- 7 days/yr
- Hot days in 30 yrs
- 15 days/yr
Wind risk 6/10 · Moderate
- Chance of severe wind over 30 yrs
- 27.0%
Air-quality risk 5/10 · Moderate
- Unhealthy air days now
- 6 days/yr
- Unhealthy air days in 30 yrs
- 8 days/yr
Risk factors via First Street. Map © Google.
Why this score? — see what drove the C+ grade
The composite is a weighted blend of 9 inputs, each scored 0–100. Each bar is that input's sub-score; the figure is the points it added to the 100-point composite (weight × sub-score).
- Cash flow +18.5/30.0
- ARV discount +15.0/15.0
- 1% rule +7.5/10.0
- DSCR +5.8/10.0
- Rent growth +4.3/5.0
- Schools +3.7/10.0
- Livability +3.6/5.0
- Condition / age +2.5/5.0
- Appreciation +0.0/10.0
$575,000
🖨 Deal sheet 📄 Offer letter ✓ Due diligence
Listing remarks
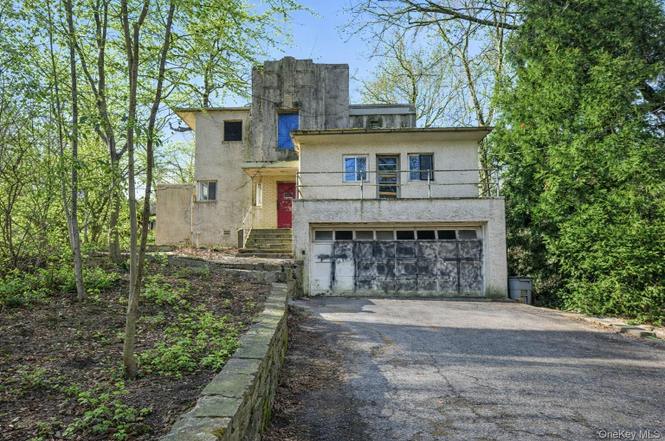
Renovation special with extraordinary potential. This unique Frank Lloyd Wright–inspired staggered contemporary, modeled after the iconic Block House and built in 1935, is ready to be restored to its architectural glory. The interior has been fully demolished, creating a rare opportunity for a visionary buyer, architect, or contractor to reimagine and rebuild a distinctive home in an exceptional setting. The original design features 4 bedrooms and 3 full baths, including three en-suite bedrooms with private terraces, emphasizing privacy and indoor–outdoor living. A dramatic great room with a cathedral ceiling, massive hearth fireplace, and balcony/librarium anchors the main leve
Key facts
- Balcony librarium
- Private terraces
- Dramatic family room
Tags
Property features AI
Finance
- Other: Living area reported from other source
Exterior
- Parking: Driveway; 2-car garage
- Utilities: Electricity connected (Con-Edison); Natural gas connected; Public sewer
- Home design: Single-family residence; Two levels; Fixer condition
- Construction: Stone construction; Block foundation; Built with a full basement
- Exterior features: Back yard; Borders state land; Private yard
Interior
- Kitchen: No appliances listed
- Bedrooms: Includes a bedroom on the first floor
- Bathrooms: Three full bathrooms
- Heating & cooling: Central air; No heating specified
- Interior features: First-floor bedroom; First-floor full bathroom; Beamed ceilings; Full basement
- Laundry & utility: No specific laundry or utility appliances listed
Neighborhood map
What this means for you Summary
Snapshot
- This is a 4-bed/3.0-bath single-family listed at $575k.
Deal economics
- At list price, monthly cash flow is $551 ($7k/yr) — positive.
- The deal already cash-flows at list — no discount required.
- Meets the 1% rule at list price ($7k rent vs $575k).
- Recommended offer: $558k (3.0% below list) — sets the bar for market timing.
Location & tenants
- Location reads 71/100 on livability (#397 in NY) — a middle-class / working-renter tenant base. Strengths: commute A+, health & safety A, employment B; Watch: crime D-, cost of living F.
- Mount Vernon School District (suburban): math 35% / reading 50% proficiency, ranked #485 of 590 in NY (top 82%) — families likely to look elsewhere, expect single-tenant / working-renter base with shorter leases; 62% free/reduced lunch — lower-income household profile, screen leases tightly.
- Zoned schools: Pennington School (math 42% / reading 62%, grade C-, #988 of 2,108 statewide, top 49%, 426 students, 45% FRL); Mount Vernon High School (math 54% / reading 75%, grade B-, #776 of 1,100 statewide, top 73%, 1,094 students, 76% FRL) — zoned schools at 60% FRL track the district average.
- Zoned-school proficiency averages 58% at this address vs 42% district-wide (+16 pts) — the actual schools serving this property are materially stronger than the Mount Vernon School District average implies; a family-tenant draw the district grade alone would hide.
- Market conditions: Rents rising fast (+7.0%/yr); 125 active listings in the ZIP; 10 comparable units currently listed for rent nearby; rentals leasing fast (median 5d on market — plan ~1-2 weeks tenant-placement turnaround); solid renter incomes; 954 units permitted in Westchester County in 2024 (649 in 5+ unit buildings).
Forward outlook
- Local home prices are declining (-3.0%/yr); year-one equity from $4k of loan paydown is wiped out by about $17k of value loss. Plan a longer hold.
- Westchester County population projected at +10% by 2050 — modest demand growth; plan on rents tracking national, not racing it.
- At projected returns (-3.0% appreciation + 7.0% rent growth), your $161k cash investment doubles in ~10 years — after that, you're playing with house money.
Negotiation context
- It's been on market 39 days — a 3% lower offer ($558k) is reasonable based on typical stale-listing flexibility.
- 8 sale attempts since 21y ago with the ask held roughly flat each time — persistent listings suggest the price (not the market) is what's stuck; bring a comps-based counter.
- Current owner paid $259k; list at $575k implies a 122% gain — meaningful room to come down on a strong offer.
Risks & watch-outs
- Watch-outs: property tax is 3.9% of price; built in 1935 — expect roof / HVAC / electrical / plumbing capex.
- Climate carrying-cost: major wind risk, 27% chance of damaging wind over 30y; extreme-heat days projected 7→15/yr by 2055 (HVAC capex compounding) — expect insurance premiums to compound above CPI over the hold.
Questions for the listing agent
- It's been on market 39 days. Have you received any prior offers? Is the seller open to a 3% concession, seller financing, or rate buy-down credit?
- Built in 1935 — when were the roof, HVAC, electrical panel, plumbing, and water heater last replaced?
- Property tax is high relative to price — has the assessment been appealed recently, and will the sale trigger a re-assessment?
- Is there a deadline driving the sale (1031 exchange, divorce, estate, relocation)? That informs how much negotiation room exists.
- Crime grade is D in this area — have there been break-ins, vandalism, or insurance claims at this property in the last 3 years? What carrier currently insures it and at what premium?
- What's the average days-on-market for RENTAL listings here right now (not sales)? A rising rental-DOM trend means longer vacancies and softer asking-rent achievability than the comps imply.
- What's the recent tenant-quality profile in this submarket — average credit score on applications, eviction rate, late-payment / NSF rate, and stable-employment percentage? A property-management company in the area should have these aggregated.
- How much new for-sale + rental construction is in the pipeline within 1–3 miles? Heavy new supply typically softens prices + rents 12–24 months out; constrained supply supports both.
Investment metrics
- 1% rule
- 1.25% ✓
- Cap rate
- 7.44%
- Cash-on-cash
- 4.11%
- DSCR
- 1.18
- GRM
- 6.7
CMA / ARV
- ARV (on-the-fly)
- $1,102,684
- Comps found
- 12
Show comp detail 12 sales within ~0.75 mi
| Address | Dist | Beds/Ba | Sqft | Sold | Price | $/sf | Match |
|---|---|---|---|---|---|---|---|
| 150 Burkewood Rd | 0.00mi | 4/3.0 | 2,638 (0%) | 0mo | $550,000 | $208 | 100 |
| 144 Douglas Pl | 0.27mi | 4/3.5 | 2,598 (-2%) | 6mo | $1,431,000 | $551 | 78 |
| 19 Huntwood Pl | 0.27mi | 4/4.5 | 2,600 (-1%) | 4mo | $1,100,000 | $423 | 76 |
| 35 Columbia Pl | 0.35mi | 4/3.5 | 2,847 (+8%) | 1mo | $1,190,000 | $418 | 68 |
| 22 Burkewood Rd | 0.17mi | 5/3.5 (+1) | 2,996 (+14%) | 0mo | $1,100,000 | $367 | 62 |
| 1 Village Ln | 0.29mi | 3/3.0 (-1) | 2,331 (-12%) | 2mo | $2,252,600 | $966 | 60 |
| 170 Lawrence St | 0.57mi | 4/3.0 | 2,900 (+10%) | 3mo | $800,000 | $276 | 54 |
| 105 Frederick Pl | 0.54mi | 4/2.5 | 2,900 (+10%) | 6mo | $780,000 | $269 | 52 |
| 5 Orchard Pl | 0.51mi | 4/3.5 | 2,288 (-13%) | 2mo | $2,997,500 | $1,310 | 51 |
| 55 Del Rey Dr | 0.52mi | 4/2.5 | 3,000 (+14%) | 3mo | $922,000 | $307 | 48 |
| 311 Hayward Ave | 0.56mi | 3/2.0 (-1) | 2,363 (-10%) | 4mo | $640,000 | $271 | 44 |
| 5 Greenfield Ave | 0.54mi | 5/4.0 (+1) | 3,000 (+14%) | 5mo | $3,300,000 | $1,100 | 39 |
Match score weights: distance 35% · size 25% · config 20% · recency 20%. Top-matched comps best support the ARV.
Projected returns pro-forma
-3.0% appreciation · 7.04% rent growth · sell at horizon
- IRR
- -4.3%
- Equity multiple
- 0.83×
- Total profit
- $-26,936
- Equity at exit
- $85,734
- IRR
- 10.4%
- Equity multiple
- 2.00×
- Total profit
- $160,322
- Equity at exit
- $49,715
Cash invested: $161,000 (down + closing). Projections, not guarantees.
Landlord ↔ Tenant lean methodology
- Overall (STATE)
- 15 Strongly Tenant-Friendly
- State New York
- 15 Strongly Tenant-Friendly · D+10
- County
- — inherits STATE
- City
- — inherits STATE
ZIP-level market 10552
- Rents YoY
- 7.0%
- Active inventory
- 125
- Price-to-rent
- 6.7×
Monthly cashflow live
- Estimated rent
- $7,171 high interval (Pro) →
- Mortgage (P&I)
- −$3,015
- Tax from tax record
- −$1,859 /mo · $22,312/yr
- Insurance
- −$240
- HOA
- −$0
- Vacancy / Maint / Mgmt
- −$1,506
- Net cashflow
- $551
Break-even live
UW: 25.0% down · 7.5% · 30yr · 1.5% tax · 5.0% vac · 8.0% maint · 8.0% mgmt
Financing live
Cash to close
- Down payment
- $143,750
- Closing costs
- $17,250
- Reserves months
- —
- Total cash needed
- —
Loan-product check · same deal, 3 products live
Conventional
25% down · 7.5% · 30yr
- Down + closing
- —
- Monthly P&I
- —
- Monthly cashflow
- —
- DSCR
- —
- Eligible?
- —
Personal DTI + credit; lowest rate.
DSCR
20% down · 8.5% · 30yr
- Down + closing
- —
- Monthly P&I
- —
- Monthly cashflow
- —
- DSCR
- —
- Eligible?
- —
No personal income docs; deal must DSCR.
Hard money
10% down · 12.0% · 12mo
- Down + closing
- —
- Monthly P&I
- —
- Monthly cashflow
- —
- DSCR
- —
- Eligible?
- —
Short-term bridge; refi at stabilization.
Rent comps 10 comps
| Address | Beds | Baths | Sqft | Rent | $/sqft | DOM | Units | Dist |
|---|---|---|---|---|---|---|---|---|
| 15 Hillside Rd Bronxville, NY | 5.0 | 3.5 | 2750 | $13,500 | $4.91 | 2d | 1 | 0.42mi |
| 375 Hawthorne Ter Mount Vernon, NY | 3.0 | 3.5 | 1975 | $10,000 | $5.06 | 1d | 1 | 0.65mi |
| 21 E Cedar St Mount Vernon, NY | 3.0 | 1.0 | 2600 | $3,750 | $1.44 | 20d | 1 | 0.68mi |
| 222 Primrose Ave Unit 2 Mt Vernon, NY | 5.0 | 2.0 | 1900 | $5,250 | $2.76 | 18d | 1 | 0.70mi |
| 26 Latimer Ln Bronxville, NY | 5.0 | 4.0 | 3200 | $13,995 | $4.37 | 1d | 1 | 0.93mi |
| 222 Lorraine Ave Mount Vernon, NY | 4.0 | 1.5 | 1948 | $5,500 | $2.82 | 7d | 1 | 1.04mi |
| 30 Cassilis Ave Bronxville, NY | 4.0 | 2.5 | 2808 | $6,250 | $2.23 | 1d | 1 | 1.23mi |
| 70 Elm Ave Unit Right Mt Vernon, NY | 3.0 | 2.5 | 1800 | $4,000 | $2.22 | 4d | 1 | 1.32mi |
| 106 Pelhamdale Ave Mount Vernon, NY | 3.0 | 2.0 | 2699 | $3,300 | $1.22 | 6d | 1 | 1.47mi |
| 9 Franklin St Eastchester, NY | 4.0 | 2.0 | 1800 | $4,800 | $2.67 | 4d | 1 | 1.48mi |
Listing history 22 events
-
2026-04-20status Pending
-
2026-03-12$575,000 Active
-
2026-03-03historical
-
2026-01-05price $579,000
-
2025-11-25$629,000 Active
-
2025-11-25historical
-
2025-11-15status Active
-
2025-11-15historical
-
2025-11-14status Active
-
2025-07-19status Pending
-
2025-06-04price $629,000
-
2025-05-06$699,000 Active
-
2025-05-05historical
-
2025-05-05soldstatus $259,000
-
2009-05-21historical
-
2008-11-21
-
2008-02-20historical
-
2007-10-31
-
2005-07-28historical
-
2005-05-21
-
2000-10-31soldstatus $415,000
-
1994-06-09soldstatus $276,000
ⓘ Source: listings_history table (triggers on properties + properties_extension) + one-shot
backfill from property_details.listing_events for pre-trigger history.
Tax reassessment forecast NY · Partial reset (capped growth)
- Current annual tax
- $22,312 · $1,859/mo
- Projected year-2 tax
- $22,312 · $1,859/mo
- Expected delta
- $0/yr ($0/mo · 0.0%)
ⓘ Screening estimate from a state-policy table — verify with the county assessor before closing.
Climate risk First Street
- Flood 1/10 Low FEMA zone X (unshaded) · 0% chance over 30 yrs
- Wildfire 1/10 Low
- Heat 6/10 Major 7 d/yr ≥98°F today · 15 d/yr by 30 yrs out
- Wind 6/10 Major 27% chance of damaging wind over 30 yrs
- Air quality 5/10 Major 6 unhealthy d/yr today · 8 by 30 yrs out
Nearby sold comps map
Loading sold comps map…
Walkable amenities ~0.75 mi
Loading nearby amenities…
Taxation est. · year 1
- Rental income
- $86,055
- − Mortgage interest
- −$32,209
- − Property taxes
- −$22,312
- − Insurance
- −$2,875
- − Repairs & maintenance
- −$6,884
- − Management
- −$6,884
- − Depreciation
- −$16,727
- Taxable loss
- −$1,837
- Est. tax savings @ 24.0%
- +$441
- After-tax cash flow
- $7,053/yr
For passive investors: Depreciation is non-cash, so a rental often shows a tax loss while cash-flowing — sheltering income. Rental losses are passive: they offset passive income freely, and up to $25,000/yr can offset ordinary (W-2) income if you actively participate and your MAGI is under $100k (phasing out to $0 by $150k); unused losses carry forward. On sale, claimed depreciation is recaptured at up to 25%, and gains may owe capital-gains tax (a 1031 exchange can defer both). Figures are a year-1 estimate at your 24.0% rate — not tax advice; consult a CPA.
Schools (NCES district)
- District
- Mount Vernon School District
- NCES district ID
- 3620100
- Math proficiency
- 35% ▼ -3.00%
- Reading proficiency
- 50% ▲ 6.00%
- Median HH income
- $50,890
- Composite
- 36.59/100
- National rank
- #4631
- State rank
- #485 of 590 in NY
Livability — Mount Vernon
- Score
- 71/100
- State rank
- #397
- US rank
- #6876
Category grades
Schools grade is shown separately in the Schools card above.
Census & demographics
- Census place
- Mount Vernon, NY
- County
- Westchester County · 709,332 people
- City population
- 61,313
- Metro
- New York-Newark-Jersey City, NY-NJ-PA
- Population (ZIP)
- 22,341
- Household income
- $96,717
- Rent vs Own
- Severe rent burden
- 652.0
Population outlook (Westchester County) Hauer SSP2
- Today (2025)
- 1,028,035 people
- By 2030
- 1,051,636 · +2.3%
- By 2040
- 1,098,520 · +6.9%
- By 2050
- 1,136,044 · +10.5%
- By 2075
- 1,196,925 · +16.4%
- By 2100
- 1,175,147 · +14.3%
Race, ethnicity, and origin ACS 2023
- Neighborhood character
- Highly diverse neighborhood (Simpson 0.72)
- Race & ethnicity
- Black 39% White 31% Hispanic / Latino 17% Two or more races 7% Asian 5%
- Hispanic origin (detail)
- Puerto Rican 5% Dominican 6%
- Common ancestry
- Russian 2% Estonian 2% Hispanic 1%
- Foreign-born
- 27% · Canada, China
- Languages at home
- 74% English-only · Spanish 12% Other Indo-European 7% French/Haitian/Cajun 2%
Political lean MEDSL · Westchester
- 2024 margin
- Strong D (+26.3) · D 63.1% · R 36.9%
- 2008→2024 swing
- -1.3pp toward R · 2008: 27.6pp · 2024: 26.3pp
- All cycles
- 2024: D+26.3 2020: D+36.3 2016: D+32.8 2012: D+22.2 2008: D+27.6
Not yet ingested
- Civics
- —
Market trends
- HPI YoY
- ▼ -393.94%
- Current HPI
- 244.3166
- Rent YoY
- ▲ 7.04%
- Metro
- New York-Newark-Jersey City, NY-NJ-PA
- State GDP YoY
- ▲ 2.60%
- F500 in state
- 92
Industry mix (Fortune 500 HQ in NY)
| Industry | F500 HQs | Revenue |
|---|---|---|
| Financial Services | 10 | $950B |
|
||
| Consumer Goods | 9 | $162B |
|
||
| Insurance | 4 | $225B |
|
||
| Telecommunications | 2 | $144B |
|
||
| Pharmaceuticals | 2 | $112B |
|
||
| Media / Entertainment | 2 | $69B |
|
||
Price history
+108.3% since first listed22 events — show timeline
- 2026-04-20 Pending — OneKey® MLS as Distributed by MLS Grid
- 2026-03-12 Listed $575,000 OneKey® MLS as Distributed by MLS Grid
- 2026-03-03 Listing Removed — OneKey® MLS as Distributed by MLS Grid
- 2026-01-05 Price Changed $579,000 OneKey® MLS as Distributed by MLS Grid
- 2025-11-25 Listing Removed — OneKey® MLS as Distributed by MLS Grid
- 2025-11-25 Listed $629,000 OneKey® MLS as Distributed by MLS Grid
- 2025-11-15 Relisted — OneKey® MLS as Distributed by MLS Grid
- 2025-11-15 Listing Removed — OneKey® MLS as Distributed by MLS Grid
- 2025-11-14 Relisted — OneKey® MLS as Distributed by MLS Grid
- 2025-07-19 Pending — OneKey® MLS as Distributed by MLS Grid
- 2025-06-04 Price Changed $629,000 OneKey® MLS as Distributed by MLS Grid
- 2025-05-06 Listed $699,000 OneKey® MLS as Distributed by MLS Grid
- 2025-05-05 Coming Soon — OneKey® MLS as Distributed by MLS Grid
- 2025-05-05 Sold (Public Records) $259,000 Public Records
- 2009-05-21 Delisted — HGMLS
- 2008-11-21 Listed — HGMLS
- 2008-02-20 Delisted — HGMLS
- 2007-10-31 Listed — HGMLS
- 2005-07-28 Delisted — HGMLS
- 2005-05-21 Listed — HGMLS
- 2000-10-31 Sold (Public Records) $415,000 Public Records
- 1994-06-09 Sold (Public Records) $276,000 Public Records
Property tax history
+2.2%/yrLatest (2025): $22,312 · +2.1% YoY. Source: county tax records.
Cash-flow waterfall
monthlySold comps — $/sqft
last 12 mo · ≤1 miLoading sold comps…