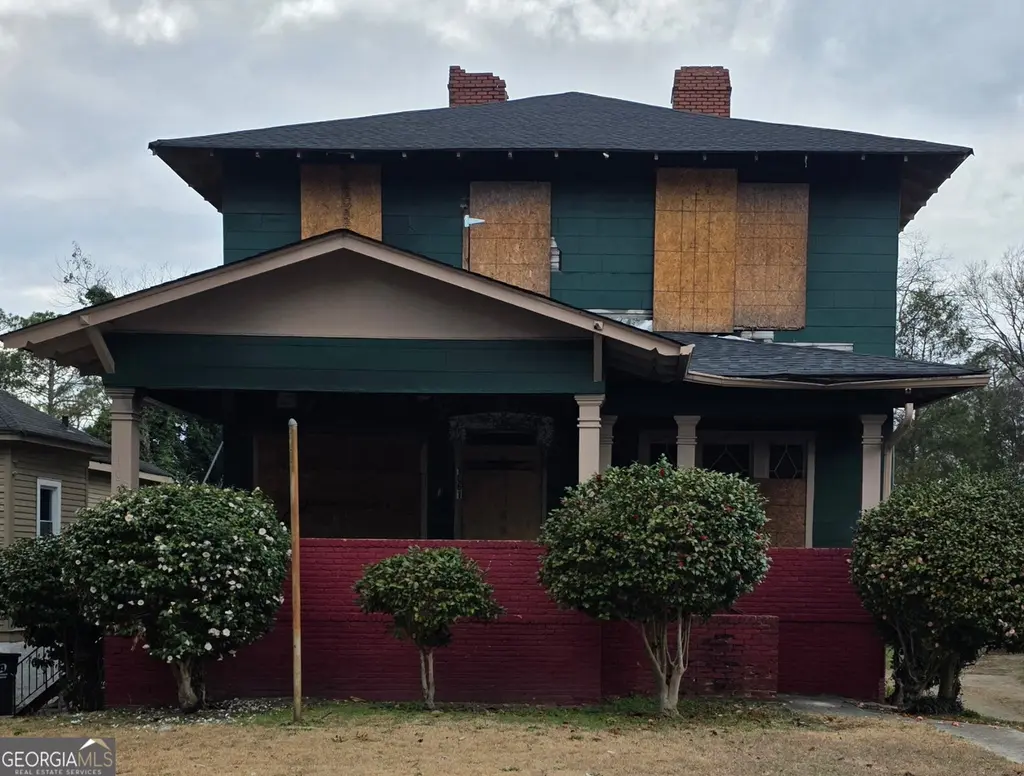
1061 Hillyer Ave · Macon-Bibb County, GA
Flood risk 4/10 · Minor
- FEMA flood zone
- X (unshaded)
- Chance of flooding over 30 yrs
- 0.13%
- Est. flood insurance / yr
- $473 – $860
Fire risk 1/10 · Minimal
- Est. fire insurance / yr
- $963 – $1,789
Heat risk 7/10 · Major
- Hot days now (above 108°F)
- 7 days/yr
- Hot days in 30 yrs
- 17 days/yr
Wind risk 6/10 · Moderate
- Chance of severe wind over 30 yrs
- 65.0%
Air-quality risk 3/10 · Minor
- Unhealthy air days now
- 3 days/yr
- Unhealthy air days in 30 yrs
- 4 days/yr
Risk factors via First Street. Map © Google.
Why this score? — see what drove the B- grade
The composite is a weighted blend of 9 inputs, each scored 0–100. Each bar is that input's sub-score; the figure is the points it added to the 100-point composite (weight × sub-score).
- Cash flow +30.0/30.0
- 1% rule +10.0/10.0
- DSCR +10.0/10.0
- ARV discount +7.5/15.0
- Rent growth +3.7/5.0
- Livability +2.5/5.0
- Condition / age +2.5/5.0
- Schools +1.2/10.0
- Appreciation +0.0/10.0
$79,900
🖨 Deal sheet (PDF) 📄 Offer letter ✓ Due diligence
Listing remarks
INVESTOR ALERT!!! PRICED TO SELL FAST - INCREDIBLE INVESTMENT OPPORTUNITY in Established Macon neighborhood with EXCELLENT COMPS! Originally 4BR/2BA with basement - was converted to 8BR/8BA! Former boarding house. Can be 8 INDIVIDUAL UNITS with separate bathrooms - CASH COW potential!!! SEPARATE BUILDING in back - additional income unit or storage. ACCESS FROM TWO DIFFERENT STREETS (front & back) unique feature! HUGE BACKYARD - tons of space and possibilities, large lot with excellent expansion potential, can convert to duplex. Solid brick foundation visible - good bones! INVESTOR DREAM: While it needs complete renovation, the conversion work is DONE - just needs updating and finis
Key facts
- Separate building
- Huge backyard
- Large lot
Tags
Property features AI
Finance
- Other: Property condition: fixer; Lot size approximately 0.28 acres
- HOA & community: No homeowners association
Exterior
- Parking: Off-street parking with side/rear entrance
- Utilities: Public water; Public sewer; Other utilities
- Home design: Single-family residence (house); Attached property; Two levels; Built in 1900; Entry level and facing direction not specified
- Construction: Composition roof; Slab foundation; Construction materials: other
- Exterior features: Private lot; Porch
Interior
- Kitchen: No appliances listed
- Bedrooms: 4 bedrooms
- Flooring: Flooring: other
- Bathrooms: 2 full bathrooms (1 on main level)
- Heating & cooling: Heating present (type: other); Cooling present (type: other)
- Interior features: Accessibility features present; Other interior features; One shared/common wall; Unfinished basement; 1 fireplace
- Laundry & utility: Laundry features listed (details not specified)
Neighborhood map
What this means for you Summary
Snapshot
- This is a 4-bed/2.0-bath single-family listed at $80k.
Deal economics
- At list price, monthly cash flow is $1k ($12k/yr) — positive.
- The deal already cash-flows at list — no discount required.
- Meets the 1% rule at list price ($2k rent vs $80k).
- Recommended offer: $75k (6.0% below list) — sets the bar for market timing.
- Cap rate 21.9% vs local median 5.5% in Macon-Bibb County — top-decile yield for the area; either an underpriced asset or a hidden risk that comps aren't pricing in. Stress-test before assuming the spread holds.
Location & tenants
- Location reads: area grade B — affects rentability + tenant quality, not the cash-flow math above.
- Bibb County (urban): math 11% / reading 18% proficiency, ranked #161 of 174 in GA (top 92%) — low school quality limits family demand, transient renter base, plan for 1-2y turnover; 75% free/reduced lunch — lower-income household profile, screen leases tightly.
- Zoned schools: Miller Magnet Middle School (math 16% / reading 33%, grade F, #301 of 470 statewide, top 66%, 585 students, 100% FRL); Central High School (math 8% / reading 2%, grade F, #394 of 424 statewide, top 97%, 844 students, 100% FRL) — zoned schools average 100% FRL vs 75% district-wide (25 pts higher); higher-poverty schools than district average — tighter screening recommended.
- Market conditions: Rents rising fast (+4.6%/yr); 257 active listings in the ZIP; 2 comparable units currently listed for rent nearby; lower-income renter base — watch delinquency; 154 units permitted in Bibb County in 2024 (0 in 5+ unit buildings).
- At $2,013/mo this rent would consume 62% of the median local household income ($39k/yr) (locally 2674% of renters already pay >50% of income on rent) — very limited rent-growth headroom before tenants either downsize or default.
Forward outlook
- Local home prices are declining (-3.0%/yr); year-one equity from $552 of loan paydown is wiped out by about $2k of value loss. Plan a longer hold.
- Bibb County population projected at -12% by 2050 — secular population decline; favor cash flow + early exit over multi-decade hold.
- At projected returns (-3.0% appreciation + 4.6% rent growth), your $22k cash investment doubles in ~3 years — after that, you're playing with house money.
Negotiation context
- It's been on market 87 days — a 6% lower offer ($75k) is reasonable based on typical stale-listing flexibility.
- 2 sale attempts; this cycle's ask is 78% above the opening price — seller raised mid-cycle; expect resistance to lowballs.
Risks & watch-outs
- Watch-outs: built in 1900 — expect roof / HVAC / electrical / plumbing capex.
- Climate carrying-cost: major wind risk, 65% chance of damaging wind over 30y; extreme-heat days projected 7→17/yr by 2055 (HVAC capex compounding) — expect insurance premiums to compound above CPI over the hold.
Questions for the listing agent
- It's been on market 87 days. Have you received any prior offers? Is the seller open to a 6% concession, seller financing, or rate buy-down credit?
- Built in 1900 — when were the roof, HVAC, electrical panel, plumbing, and water heater last replaced?
- Why hasn't it sold? Are there any deal-killer items the seller is aware of (foundation, flood, title, zoning, code violations)?
- Is there a deadline driving the sale (1031 exchange, divorce, estate, relocation)? That informs how much negotiation room exists.
- What's the average days-on-market for RENTAL listings here right now (not sales)? A rising rental-DOM trend means longer vacancies and softer asking-rent achievability than the comps imply.
- What's the recent tenant-quality profile in this submarket — average credit score on applications, eviction rate, late-payment / NSF rate, and stable-employment percentage? A property-management company in the area should have these aggregated.
- How much new for-sale + rental construction is in the pipeline within 1–3 miles? Heavy new supply typically softens prices + rents 12–24 months out; constrained supply supports both.
Investment metrics
- 1% rule
- 2.52% ✓
- Cap rate
- 21.93%
- Cash-on-cash
- 55.84%
- DSCR
- 3.48
- GRM
- 3.3
CMA / ARV
- ARV (on-the-fly)
- $288,927
- Comps found
- 4
Show comp detail 4 sales within ~0.75 mi
| Address | Dist | Beds/Ba | Sqft | Sold | Price | $/sf | Match |
|---|---|---|---|---|---|---|---|
| 125 Stonewall Pl | 0.72mi | 4/2.0 | 3,748 (+13%) | 9mo | $325,000 | $87 | 38 |
| 155 Oak Haven Ave | 0.69mi | 5/3.0 (+1) | 3,691 (+11%) | 8mo | $725,000 | $196 | 34 |
| 2639 Vineville Ave | 0.67mi | 4/2.5 | 3,804 (+14%) | 18mo | $294,000 | $77 | 27 |
| 2639 Vineville Ave | 0.67mi | 4/2.5 | 3,804 (+14%) | 18mo | $294,000 | $77 | 27 |
Match score weights: distance 35% · size 25% · config 20% · recency 20%. Top-matched comps best support the ARV.
Projected returns pro-forma
-3.0% appreciation · 4.61% rent growth · sell at horizon
- IRR
- 56.0%
- Equity multiple
- 3.53×
- Total profit
- $56,703
- Equity at exit
- $11,913
- IRR
- 61.6%
- Equity multiple
- 7.66×
- Total profit
- $148,922
- Equity at exit
- $6,908
Cash invested: $22,372 (down + closing). Projections, not guarantees.
Landlord ↔ Tenant lean methodology
- Overall (STATE)
- 90 Strongly Landlord-Friendly
- State Georgia
- 90 Strongly Landlord-Friendly · R+3
- County
- — inherits STATE
- City
- — inherits STATE
ZIP-level market 31204
- Rents YoY
- 4.6%
- Active inventory
- 257
- Price-to-rent
- 3.3×
Monthly cashflow live
- Estimated rent
- $2,013 medium interval (Pro) →
- Mortgage (P&I)
- −$419
- Tax from tax record
- −$96 /mo · $1,158/yr
- Insurance
- −$33
- HOA
- −$0
- Lot rent
- −$0
- Vacancy / Maint / Mgmt
- −$423
- Net cashflow
- $1,041
Break-even live
Sensitivity live
| Price | -10% $1,086 | -5% $1,064 | +0% $1,041 | +5% $1,019 | +10% $996 |
|---|---|---|---|---|---|
| Rent | -10% $882 | -5% $962 | +0% $1,041 | +5% $1,121 | +10% $1,200 |
| Rate | -1.0pp $1,081 | -0.5pp $1,061 | base $1,041 | +0.5pp $1,020 | +1.0pp $999 |
UW: 25.0% down · 7.5% · 30yr · 1.5% tax · 5.0% vac · 8.0% maint · 8.0% mgmt
Financing live
Cash to close
- Down payment
- $19,975
- Closing costs
- $2,397
- Reserves months
- —
- Total cash needed
- —
Loan-product check · same deal, 3 products live
Conventional
25% down · 7.5% · 30yr
- Down + closing
- —
- Monthly P&I
- —
- Monthly cashflow
- —
- DSCR
- —
- Eligible?
- —
Personal DTI + credit; lowest rate.
DSCR
20% down · 8.5% · 30yr
- Down + closing
- —
- Monthly P&I
- —
- Monthly cashflow
- —
- DSCR
- —
- Eligible?
- —
No personal income docs; deal must DSCR.
Hard money
10% down · 12.0% · 12mo
- Down + closing
- —
- Monthly P&I
- —
- Monthly cashflow
- —
- DSCR
- —
- Eligible?
- —
Short-term bridge; refi at stabilization.
Rent comps 2 comps
| Address | Beds | Baths | Sqft | Rent | $/sqft | DOM | Units | Dist |
|---|---|---|---|---|---|---|---|---|
| 2733 Hillcrest Ave Macon, GA | 4.0 | 3.0 | 3094 | $2,300 | $0.74 | 15d | 1 | 0.16mi |
| 240 Candler Dr Macon, GA | 3.0 | 2.0 | 2635 | $1,850 | $0.70 | 15d | 1 | 0.95mi |
Listing history 23 events
-
2026-06-21days on market $79,900 Active 87 DOM
-
2026-06-19days on market $79,900 Active 85 DOM
-
2026-06-18days on market $79,900 Active 84 DOM
-
2026-06-17days on market $79,900 Active 83 DOM
-
2026-06-16days on market $79,900 Active 82 DOM
-
2026-06-15days on market $79,900 Active 81 DOM
-
2026-06-14days on market $79,900 Active 79 DOM
-
2026-06-13days on market $79,900 Active 78 DOM
-
2026-06-10days on market $79,900 Active 76 DOM
-
2026-06-09days on market $79,900 Active 75 DOM
-
2026-06-09days on market $79,900 Active 74 DOM
-
2026-06-07days on market $79,900 Active 73 DOM
-
2026-06-03days on market $79,900 Active 69 DOM
-
2026-06-02days on market $79,900 Active 68 DOM
-
2026-06-01days on market $79,900 Active 67 DOM
-
2026-05-31days on market $79,900 Active 66 DOM
-
2026-05-30days on market $79,900 Active 65 DOM
-
2026-05-21price $79,900
-
2026-05-20price $65,000
-
2026-05-19status Back On Market
-
2026-04-14status Under Contract
-
2026-02-22price $55,000
-
2026-02-18$45,000 New
ⓘ Source: listings_history table (triggers on properties + properties_extension) + one-shot
backfill from property_details.listing_events for pre-trigger history.
Tax reassessment forecast GA · Resets to sale price
- Current annual tax
- $1,158 · $96/mo
- Projected year-2 tax
- $1,158 · $96/mo
- Expected delta
- $0/yr ($0/mo · 0.0%)
ⓘ Screening estimate from a state-policy table — verify with the county assessor before closing.
Climate risk First Street
- Flood 4/10 Moderate FEMA zone X (unshaded) · 13% chance over 30 yrs
- Wildfire 1/10 Low
- Heat 7/10 Severe 7 d/yr ≥108°F today · 17 d/yr by 30 yrs out
- Wind 6/10 Major 65% chance of damaging wind over 30 yrs
- Air quality 3/10 Moderate 3 unhealthy d/yr today · 4 by 30 yrs out
Nearby sold comps map
Loading sold comps map…
Walkable amenities ~0.75 mi
Loading nearby amenities…
Taxation est. · year 1
- Rental income
- $24,150
- − Mortgage interest
- −$4,476
- − Property taxes
- −$1,158
- − Insurance
- −$400
- − Repairs & maintenance
- −$1,932
- − Management
- −$1,932
- − Depreciation
- −$2,324
- Taxable income
- $11,929
- Est. tax owed @ 24.0%
- −$2,863
- After-tax cash flow
- $9,631/yr
For passive investors: Depreciation is non-cash, so a rental often shows a tax loss while cash-flowing — sheltering income. Rental losses are passive: they offset passive income freely, and up to $25,000/yr can offset ordinary (W-2) income if you actively participate and your MAGI is under $100k (phasing out to $0 by $150k); unused losses carry forward. On sale, claimed depreciation is recaptured at up to 25%, and gains may owe capital-gains tax (a 1031 exchange can defer both). Figures are a year-1 estimate at your 24.0% rate — not tax advice; consult a CPA.
Schools (NCES district)
- District
- Bibb County
- NCES district ID
- 1300420
- Math proficiency
- 11% ▼ -14.00%
- Reading proficiency
- 18% ▼ -11.00%
- Median HH income
- $37,426
- Composite
- 12.13/100
- National rank
- #9654
- State rank
- #161 of 174 in GA
Livability — Macon-Bibb County
No livability data for this city. (Only ~50 U.S. cities are tracked.)
Census & demographics
- Census place
- Macon-Bibb County, GA
- County
- Bibb County · 164,332 people
- City population
- 143,186
- Metro
- Macon-Bibb County, GA
- Population (ZIP)
- 32,421
- Household income
- $38,784
- Rent vs Own
- Severe rent burden
- 2674.0
Population outlook (Bibb County) Hauer SSP2
- Today (2025)
- 148,772 people
- By 2030
- 145,904 · -1.9%
- By 2040
- 139,404 · -6.3%
- By 2050
- 131,603 · -11.5%
- By 2075
- 111,050 · -25.4%
- By 2100
- 83,346 · -44.0%
Race, ethnicity, and origin ACS 2023
- Neighborhood character
- Predominantly Black (65%)
- Race & ethnicity
- Black 65% White 28% Hispanic / Latino 3% Two or more races 2% Asian 1%
- Common ancestry
- Serbian 2% Slovak 1% Lithuanian 1%
- Foreign-born
- 2% · Canada
- Languages at home
- 96% English-only · Spanish 2% French/Haitian/Cajun 1%
Political lean MEDSL · Bibb
- 2024 margin
- Strong D (+22.4) · D 61.0% · R 38.5%
- 2008→2024 swing
- +4.4pp toward D · 2008: 18.0pp · 2024: 22.4pp
- All cycles
- 2024: D+22.4 2020: D+23.8 2016: D+20.2 2012: D+20.0 2008: D+18.0
Not yet ingested
- Civics
- —
Market trends
- HPI YoY
- ▼ -135.44%
- Current HPI
- 194.5459
- Rent YoY
- ▲ 4.61%
- Metro
- Macon-Bibb County, GA
- State GDP YoY
- ▲ 2.66%
- F500 in state
- 28
Industry mix (Fortune 500 HQ in GA)
| Industry | F500 HQs | Revenue |
|---|---|---|
| Paper / Packaging | 2 | $29B |
|
||
| Retail | 1 | $160B |
|
||
| Transportation / Logistics | 1 | $91B |
|
||
| Airlines | 1 | $62B |
|
||
| Consumer Goods | 1 | $47B |
|
||
| Utilities | 1 | $25B |
|
||
Price history
+77.6% since first listed6 events — show timeline
- 2026-05-21 Price Changed $79,900 GAMLS
- 2026-05-20 Price Changed $65,000 GAMLS
- 2026-05-19 Relisted — GAMLS
- 2026-04-14 Pending — GAMLS
- 2026-02-22 Price Changed $55,000 GAMLS
- 2026-02-18 Listed $45,000 GAMLS
Property tax history
+26.0%/yrLatest (2025): $1,158 · -1.3% YoY. Source: county tax records.
Cash-flow waterfall
monthlySold comps — $/sqft
last 12 mo · ≤1 miLoading sold comps…