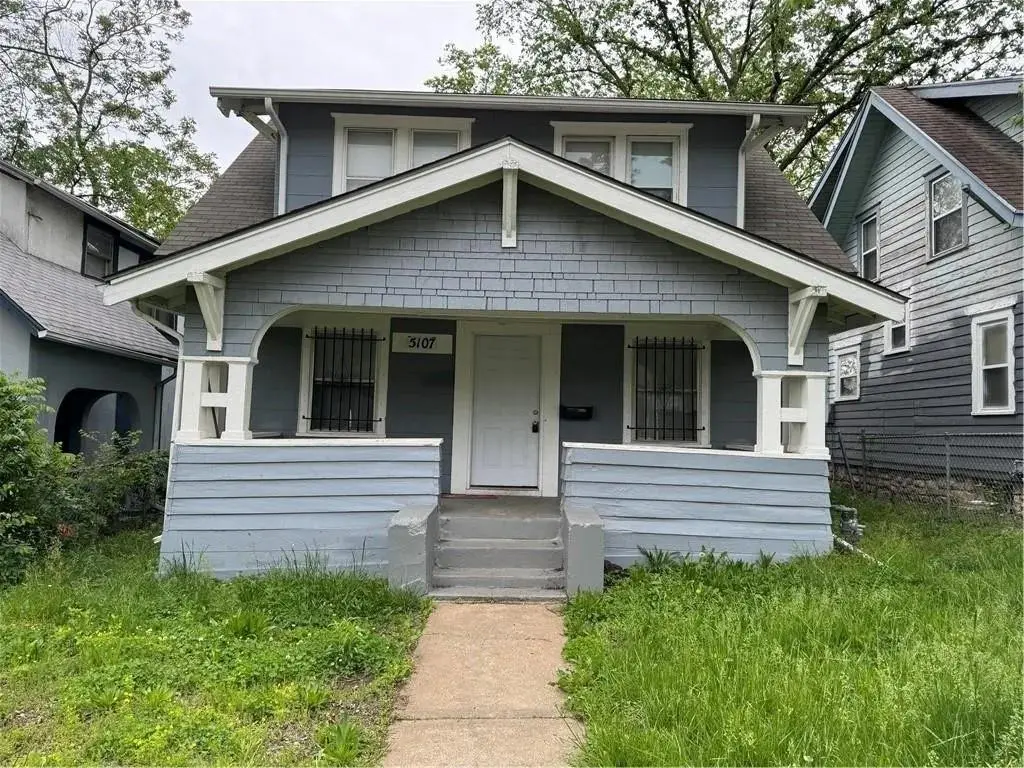
5107 Olive St · Kansas City, MO
Flood risk 1/10 · Minimal
- FEMA flood zone
- X (unshaded)
- Chance of flooding over 30 yrs
- 0.0%
- Est. flood insurance / yr
- $473 – $860
Fire risk 1/10 · Minimal
- Est. fire insurance / yr
- $1,054 – $1,958
Heat risk 4/10 · Minor
- Hot days now (above 107°F)
- 7 days/yr
- Hot days in 30 yrs
- 17 days/yr
Wind risk 2/10 · Minimal
- Chance of severe wind over 30 yrs
- —
Air-quality risk 3/10 · Minor
- Unhealthy air days now
- 2 days/yr
- Unhealthy air days in 30 yrs
- 4 days/yr
Risk factors via First Street. Map © Google.
Why this score? — see what drove the B+ grade
The composite is a weighted blend of 9 inputs, each scored 0–100. Each bar is that input's sub-score; the figure is the points it added to the 100-point composite (weight × sub-score).
- Cash flow +30.0/30.0
- ARV discount +15.0/15.0
- DSCR +10.0/10.0
- 1% rule +9.6/10.0
- Livability +3.9/5.0
- Rent growth +3.6/5.0
- Condition / age +2.5/5.0
- Schools +1.5/10.0
- Appreciation +0.0/10.0
$99,000
🖨 Deal sheet 📄 Offer letter ✓ Due diligence
Listing remarks MLS
Investor special! New updates in the kitchen and bathroom! This 3 bed, 1 bath home is priced to move. With a motivated seller and a new lower price, this property is a fantastic opportunity to add to your rental portfolio or get started with your first investment. Would make a great rental. Don’t wait, at this price, it won’t last long. Reach out today for more details or to schedule a showing!
Key facts
- 5,227 sq ft lot
- Listed 259 days
Neighborhood map
What this means for you Summary
Snapshot
- This is a 3-bed/1.0-bath single-family listed at $99k.
Deal economics
- At list price, monthly cash flow is $537 ($6k/yr) — positive.
- The deal already cash-flows at list — no discount required.
- Meets the 1% rule at list price ($1k rent vs $99k).
- Recommended offer: $87k (12.0% below list) — sets the bar for market timing.
- Cap rate 12.8% vs local median 3.9% in Kansas City — top-decile yield for the area; either an underpriced asset or a hidden risk that comps aren't pricing in. Stress-test before assuming the spread holds.
Location & tenants
- Location reads 78/100 on livability (#28 in MO, #2,671 nationally) — a middle-class / working-renter tenant base. Strengths: amenities A+, commute A+, cost of living A+; Watch: schools C-, crime F.
- Kansas City 33 (urban): math 12% / reading 24% proficiency, ranked #308 of 324 in MO (top 95%) — low school quality limits family demand, transient renter base, plan for 1-2y turnover; 75% free/reduced lunch — lower-income household profile, screen leases tightly.
- Market conditions: Rents rising fast (+4.4%/yr); 187 active listings in the ZIP; 40 comparable units currently listed for rent nearby; rentals at typical pace (median 24d on market — plan ~3-4 weeks tenant-placement turnaround); lower-income renter base — watch delinquency; 4,002 units permitted in Jackson County in 2024 (2,271 in 5+ unit buildings).
- This rent runs 41% of the median local income ($42k/yr) — at the standard rent-burdened threshold; future hikes will face affordability resistance.
Forward outlook
- Local home prices are declining (-3.0%/yr); year-one equity from $684 of loan paydown is wiped out by about $3k of value loss. Plan a longer hold.
- Jackson County population projected at +4% by 2050 — modest demand growth; plan on rents tracking national, not racing it.
- At projected returns (-3.0% appreciation + 4.4% rent growth), your $28k cash investment doubles in ~5 years — after that, you're playing with house money.
Negotiation context
- It's been on market 260 days — a 12% lower offer ($87k) is reasonable based on typical stale-listing flexibility.
- 7 sale attempts since 22y ago; this cycle's ask has dropped $6k (6%) from the opening price — seller is motivated, your offer sets the floor, not the list.
Risks & watch-outs
- Watch-outs: built in 1924 — expect roof / HVAC / electrical / plumbing capex.
Questions for the listing agent
- It's been on market 260 days. Have you received any prior offers? Is the seller open to a 12% concession, seller financing, or rate buy-down credit?
- Built in 1924 — when were the roof, HVAC, electrical panel, plumbing, and water heater last replaced?
- Why hasn't it sold? Are there any deal-killer items the seller is aware of (foundation, flood, title, zoning, code violations)?
- Is there a deadline driving the sale (1031 exchange, divorce, estate, relocation)? That informs how much negotiation room exists.
- Crime grade is F in this area — have there been break-ins, vandalism, or insurance claims at this property in the last 3 years? What carrier currently insures it and at what premium?
- What's the average days-on-market for RENTAL listings here right now (not sales)? A rising rental-DOM trend means longer vacancies and softer asking-rent achievability than the comps imply.
- What's the recent tenant-quality profile in this submarket — average credit score on applications, eviction rate, late-payment / NSF rate, and stable-employment percentage? A property-management company in the area should have these aggregated.
- How much new for-sale + rental construction is in the pipeline within 1–3 miles? Heavy new supply typically softens prices + rents 12–24 months out; constrained supply supports both.
Investment metrics
- 1% rule
- 1.46% ✓
- Cap rate
- 12.80%
- Cash-on-cash
- 23.25%
- DSCR
- 2.03
- GRM
- 5.7
CMA / ARV
- ARV (median comp)
- $146,532
- List price
- $99,000
- Delta
- -32.44%
- Verdict
- UNDERPRICED
- Comps
- 20 within 1.0 mi
Show comp detail 12 sales within ~0.75 mi
| Address | Dist | Beds/Ba | Sqft | Sold | Price | $/sf | Match |
|---|---|---|---|---|---|---|---|
| 4916 Wabash Ave | 0.24mi | 3/1.0 | 1,231 (-2%) | 4mo | $125,000 | $102 | 83 |
| 5442 Brooklyn Ave | 0.48mi | 3/2.0 | 1,268 (+1%) | 5mo | $220,000 | $174 | 67 |
| 5215 Highland Ave | 0.46mi | 3/1.0 | 1,160 (-7%) | 0mo | $50,500 | $44 | 66 |
| 4935 College Ave | 0.59mi | 3/1.0 | 1,216 (-3%) | 4mo | $79,900 | $66 | 64 |
| 5155 Brookwood Ave | 0.42mi | 3/2.0 | 1,165 (-7%) | 5mo | $149,900 | $129 | 61 |
| 5342 Euclid Ave | 0.43mi | 3/1.5 | 1,114 (-11%) | 1mo | $124,000 | $111 | 59 |
| 4930 Paseo Blvd | 0.66mi | 3/1.0 | 1,320 (+6%) | 4mo | $120,000 | $91 | 57 |
| 4948 College Ave | 0.55mi | 3/1.0 | 1,134 (-9%) | 3mo | $129,900 | $115 | 56 |
| 3215 E 51st St | 0.52mi | 3/1.0 | 1,360 (+9%) | 6mo | $75,000 | $55 | 56 |
| 5009 Bellefontaine Ave | 0.46mi | 3/1.0 | 1,082 (-13%) | 1mo | $118,900 | $110 | 55 |
| 1820 E 55th St | 0.57mi | 4/2.0 (+1) | 1,294 (+4%) | 4mo | $225,000 | $174 | 55 |
| 4617 S Benton St | 0.68mi | 3/1.0 | 1,430 (+14%) | 1mo | $90,000 | $63 | 44 |
Match score weights: distance 35% · size 25% · config 20% · recency 20%. Top-matched comps best support the ARV.
Projected returns pro-forma
-3.0% appreciation · 4.42% rent growth · sell at horizon
- IRR
- 17.8%
- Equity multiple
- 1.73×
- Total profit
- $20,228
- Equity at exit
- $14,761
- IRR
- 27.1%
- Equity multiple
- 3.54×
- Total profit
- $70,364
- Equity at exit
- $8,560
Cash invested: $27,720 (down + closing). Projections, not guarantees.
Landlord ↔ Tenant lean methodology
- Overall (STATE)
- 81 Strongly Landlord-Friendly
- State Missouri
- 81 Strongly Landlord-Friendly · R+10
- County
- — inherits STATE
- City
- — inherits STATE
ZIP-level market 64130
- Home prices YoY
- -21.5%
- Rents YoY
- 4.4%
- Active inventory
- 187
- Price-to-rent
- 5.7×
Monthly cashflow live
- Estimated rent
- $1,440 high interval (Pro) →
- Mortgage (P&I)
- −$519
- Tax from tax record
- −$40 /mo · $485/yr
- Insurance
- −$41
- HOA
- −$0
- Vacancy / Maint / Mgmt
- −$302
- Net cashflow
- $537
Break-even live
UW: 25.0% down · 7.5% · 30yr · 1.5% tax · 5.0% vac · 8.0% maint · 8.0% mgmt
Financing live
Cash to close
- Down payment
- $24,750
- Closing costs
- $2,970
- Reserves months
- —
- Total cash needed
- —
Loan-product check · same deal, 3 products live
Conventional
25% down · 7.5% · 30yr
- Down + closing
- —
- Monthly P&I
- —
- Monthly cashflow
- —
- DSCR
- —
- Eligible?
- —
Personal DTI + credit; lowest rate.
DSCR
20% down · 8.5% · 30yr
- Down + closing
- —
- Monthly P&I
- —
- Monthly cashflow
- —
- DSCR
- —
- Eligible?
- —
No personal income docs; deal must DSCR.
Hard money
10% down · 12.0% · 12mo
- Down + closing
- —
- Monthly P&I
- —
- Monthly cashflow
- —
- DSCR
- —
- Eligible?
- —
Short-term bridge; refi at stabilization.
Rent comps 40 comps
| Address | Beds | Baths | Sqft | Rent | $/sqft | DOM | Units | Dist |
|---|---|---|---|---|---|---|---|---|
| 2420 E 51st St Kansas City, MO | 3.0 | 2.0 | 1460 | $1,350 | $0.92 | 23d | 1 | 0.09mi |
| 5114 Brooklyn Ave Kansas City, MO | 3.0 | 1.5 | 1116 | $1,300 | $1.16 | 7d | 1 | 0.15mi |
| 4930 Park Ave Kansas City, MO | 3.0 | 1.0 | 900 | $1,300 | $1.44 | 16d | 1 | 0.24mi |
| 5038 S Benton Ave Kansas City, MO | 4.0 | 3.0 | 1500 | $1,875 | $1.25 | 21d | 1 | 0.31mi |
| 5241 Brookwood Ave Kansas City, MO | 3.0 | 2.0 | 1431 | $1,550 | $1.08 | 43d | 1 | 0.35mi |
| 5013 S Benton Ave Kansas City, MO | 3.0 | 1.0 | 978 | $1,225 | $1.25 | 23d | 1 | 0.35mi |
| 5115 Woodland Ave Kansas City, MO | 4.0 | 1.0 | 1136 | $1,700 | $1.50 | 43d | 1 | 0.37mi |
| 5414 Brooklyn Ave Kansas City, MO | 3.0 | 1.5 | 1856 | $1,650 | $0.89 | 16d | 1 | 0.38mi |
| 4917 S Benton Ave Kansas City, MO | 2.0 | 1.0 | 1000 | $1,100 | $1.10 | 23d | 1 | 0.41mi |
| 4911 S Benton Ave Kansas City, MO | 2.0 | 1.0 | 1000 | $1,100 | $1.10 | 17d | 1 | 0.42mi |
| 4910 Michigan Ave Kansas City, MO | 3.0 | 1.5 | 1199 | $1,400 | $1.17 | 7d | 1 | 0.44mi |
| 5410 Euclid Ave Kansas City, MO | 3.0 | 2.0 | 1119 | $1,395 | $1.25 | 43d | 1 | 0.44mi |
| 5215 Walrond Ave Kansas City, MO | 4.0 | 2.0 | 1198 | $1,710 | $1.43 | 23d | 1 | 0.52mi |
| 5430 Michigan Ave Kansas City, MO | 3.0 | 1.0 | 1710 | $1,100 | $0.64 | 19d | 1 | 0.52mi |
| 5430 Michigan Ave Kansas City, MO | 2.0 | 1.0 | 1250 | $1,495 | $1.20 | 43d | 1 | 0.52mi |
| 5332 Highland Ave Kansas City, MO | 3.0 | 1.0 | 1022 | $1,350 | $1.32 | 7d | 1 | 0.53mi |
| 5531 Euclid Ave Kansas City, MO | 3.0 | 1.0 | 1135 | $1,300 | $1.15 | 43d | 1 | 0.58mi |
| 5120 The Paseo Apt 1 Kansas City, MO | 2.0 | 1.0 | 1500 | $1,550 | $1.03 | 43d | 1 | 0.59mi |
| 5122 Paseo Blvd Kansas City, MO | 3.0 | 1.0 | 1573 | $1,595 | $1.01 | 10d | 1 | 0.59mi |
| 4935 College Ave Kansas City, MO | 3.0 | 1.0 | 1216 | $1,350 | $1.11 | 23d | 1 | 0.61mi |
| 5524 Woodland Ave Kansas City, MO | 3.0 | 1.0 | 1243 | $1,095 | $0.88 | 23d | 1 | 0.65mi |
| 5708 Euclid Ave Kansas City, MO | 4.0 | 2.0 | 1350 | $1,600 | $1.19 | 16d | 1 | 0.77mi |
| 4534 S Benton Ave Kansas City, MO | 2.0 | 1.0 | 912 | $1,045 | $1.15 | 16d | 1 | 0.77mi |
| 4925 Tracy Ave Unit 1 Kansas City, MO | 2.0 | 1.0 | 1000 | $1,400 | $1.40 | 43d | 1 | 0.79mi |
| 2100 E 58th St Kansas City, MO | 2.0 | 1.0 | 1030 | $1,500 | $1.46 | 43d | 1 | 0.82mi |
| 5411 Tracy Ave Kansas City, MO | 2.0 | 1.0 | 1600 | $1,545 | $0.97 | 17d | 1 | 0.82mi |
| 5801 Wabash Ave Kansas City, MO | 3.0 | 1.0 | 1200 | $1,200 | $1.00 | 43d | 1 | 0.83mi |
| 5614 Indiana Ave Kansas City, MO | 3.0 | 1.0 | 900 | $1,175 | $1.31 | 43d | 1 | 0.85mi |
| 2811 E 58th St Kansas City, MO | 4.0 | 1.0 | 1348 | $1,473 | $1.09 | 43d | 1 | 0.87mi |
| 1500 E 46th St Kansas City, MO | 1.0–3.0 | 1.0 | 803 | $1,275 | $1.59 | 43d | 1 | 0.88mi |
| 5824 Wabash Ave Kansas City, MO | 3.0 | 1.0 | 1276 | $1,050 | $0.82 | 43d | 1 | 0.89mi |
| 4653 Benton Blvd Kansas City, MO | 3.0 | 2.0 | 1594 | $1,600 | $1.00 | 7d | 1 | 0.92mi |
| 4427 Agnes Ave Kansas City, MO | 3.0 | 1.0 | 1100 | $1,350 | $1.23 | 16d | 1 | 0.94mi |
| 5752 College Ave Kansas City, MO | 4.0 | 1.0 | 1120 | $1,600 | $1.43 | 17d | 1 | 0.98mi |
| 5405 Harrison St Unit 2F Kansas City, MO | 2.0 | 1.0 | 1025 | $1,295 | $1.26 | 16d | 1 | 0.99mi |
| 5405 Harrison St Unit 2F Kansas City, MO | 2.0 | 1.0 | 1025 | $1,295 | $1.26 | 19d | 1 | 0.99mi |
| 5405 Harrison St Kansas City, MO | 2.0 | 1.0 | 1025 | $1,295 | $1.26 | 16d | 1 | 0.99mi |
| 5407 Harrison St Unit 1F Kansas City, MO | 2.0 | 1.0 | 1025 | $1,195 | $1.17 | 43d | 1 | 0.99mi |
| 5409 Harrison St Unit 5411 Kansas City, MO | 2.0 | 1.0 | 900 | $1,199 | $1.33 | 23d | 1 | 0.99mi |
| 5411 Harrison St Unit 1F Kansas City, MO | 2.0 | 1.0 | 900 | $1,199 | $1.33 | 23d | 1 | 0.99mi |
Listing history 44 events
-
2026-06-18days on market $99,000 Active 260 DOM
-
2026-06-17days on market $99,000 Active 259 DOM
-
2026-06-16days on market $99,000 Active 258 DOM
-
2026-06-15days on market $99,000 Active 257 DOM
-
2026-06-13days on market $99,000 Active 255 DOM
-
2026-06-09days on market $99,000 Active 251 DOM
-
2026-06-08days on market $99,000 Active 250 DOM
-
2026-06-07days on market $99,000 Active 249 DOM
-
2026-06-05days on market $99,000 Active 246 DOM
-
2026-06-03days on market $99,000 Active 245 DOM
-
2026-06-02days on market $99,000 Active 244 DOM
-
2026-06-01days on market $99,000 Active 243 DOM
-
2026-05-31days on market $99,000 Active 242 DOM
-
2026-04-22price $99,000 409-char remark
Show marketing remark (409 chars)
Investor special! New updates in the kitchen and bathroom! This 3 bed, 1 bath home is priced to move. With a motivated seller and a new lower price, this property is a fantastic opportunity to add to your rental portfolio or get started with your first investment. Would make a great rental. Don’t wait, at this price, it won’t last long. Reach out today for more details or to schedule a showing!
-
2025-10-02$105,000 Active 409-char remark
Show marketing remark (409 chars)
Investor special! New updates in the kitchen and bathroom! This 3 bed, 1 bath home is priced to move. With a motivated seller and a new lower price, this property is a fantastic opportunity to add to your rental portfolio or get started with your first investment. Would make a great rental. Don’t wait, at this price, it won’t last long. Reach out today for more details or to schedule a showing!
-
2025-10-02historical $105,000 409-char remark
Show marketing remark (409 chars)
Investor special! New updates in the kitchen and bathroom! This 3 bed, 1 bath home is priced to move. With a motivated seller and a new lower price, this property is a fantastic opportunity to add to your rental portfolio or get started with your first investment. Would make a great rental. Don’t wait, at this price, it won’t last long. Reach out today for more details or to schedule a showing!
-
2025-09-30historical
-
2025-06-10price $120,000
-
2025-05-22$123,000 Active
-
2025-04-30historical
-
2025-04-09status Active
-
2025-02-20historical
-
2024-11-07status Active
-
2024-10-02status Pending
-
2024-09-16price $123,000
-
2024-05-16price $125,000
-
2024-04-04$135,000 Active
-
2020-10-07soldstatus
-
2020-10-07soldstatus
-
2020-10-07soldstatus
-
2020-01-29soldstatus
-
2019-06-18soldstatus
-
2019-05-15soldstatus
-
2019-01-04soldstatus
-
2018-11-20soldstatus
-
2018-06-20soldstatus
-
2006-08-22soldstatus
-
2006-08-21soldstatus
-
2005-12-31$32,000
-
2005-05-19soldstatus
-
2005-03-18soldstatus
-
2005-03-11soldstatus
-
2004-10-11$33,000
-
1984-09-01soldstatus
ⓘ Source: listings_history table (triggers on properties + properties_extension) + one-shot
backfill from property_details.listing_events for pre-trigger history.
Tax reassessment forecast MO · Resets to sale price
- Current annual tax
- $485 · $40/mo
- Projected year-2 tax
- $960 · $80/mo
- Expected delta
- +$476/yr (+$40/mo · 98.1%)
ⓘ Screening estimate from a state-policy table — verify with the county assessor before closing.
Climate risk First Street
- Flood 1/10 Low FEMA zone X (unshaded) · 0% chance over 30 yrs
- Wildfire 1/10 Low
- Heat 4/10 Moderate 7 d/yr ≥107°F today · 17 d/yr by 30 yrs out
- Wind 2/10 Low
- Air quality 3/10 Moderate 2 unhealthy d/yr today · 4 by 30 yrs out
Nearby sold comps map
Loading sold comps map…
Walkable amenities ~0.75 mi
Loading nearby amenities…
Taxation est. · year 1
- Rental income
- $17,286
- − Mortgage interest
- −$5,546
- − Property taxes
- −$485
- − Insurance
- −$495
- − Repairs & maintenance
- −$1,383
- − Management
- −$1,383
- − Depreciation
- −$2,880
- Taxable income
- $5,115
- Est. tax owed @ 24.0%
- −$1,228
- After-tax cash flow
- $5,218/yr
For passive investors: Depreciation is non-cash, so a rental often shows a tax loss while cash-flowing — sheltering income. Rental losses are passive: they offset passive income freely, and up to $25,000/yr can offset ordinary (W-2) income if you actively participate and your MAGI is under $100k (phasing out to $0 by $150k); unused losses carry forward. On sale, claimed depreciation is recaptured at up to 25%, and gains may owe capital-gains tax (a 1031 exchange can defer both). Figures are a year-1 estimate at your 24.0% rate — not tax advice; consult a CPA.
Schools (NCES district)
- District
- Kansas City 33
- NCES district ID
- 2916400
- Math proficiency
- 12% ▼ -8.00%
- Reading proficiency
- 24% ▬ 0.00%
- Median HH income
- $35,227
- Composite
- 14.8/100
- National rank
- #9387
- State rank
- #308 of 324 in MO
Livability — Kansas City
- Score
- 78/100
- State rank
- #28
- US rank
- #2671
Category grades
Schools grade is shown separately in the Schools card above.
Census & demographics
- Census place
- Kansas City, MO
- County
- Jackson County · 687,798 people
- City population
- 439,467
- Metro
- Kansas City, MO-KS
- Population (ZIP)
- 19,644
- Household income
- $42,221
- Rent vs Own
- Severe rent burden
- 1132.0
Population outlook (Jackson County) Hauer SSP2
- Today (2025)
- 719,589 people
- By 2030
- 731,456 · +1.6%
- By 2040
- 746,689 · +3.8%
- By 2050
- 749,289 · +4.1%
- By 2075
- 736,227 · +2.3%
- By 2100
- 668,210 · -7.1%
Race, ethnicity, and origin ACS 2023
- Neighborhood character
- Predominantly Black (80%)
- Race & ethnicity
- Black 80% White 9% Hispanic / Latino 8% Two or more races 6%
- Hispanic origin (detail)
- Mexican 5%
- Common ancestry
- Lithuanian 1% Swedish 0%
- Foreign-born
- 6% · Canada
- Languages at home
- 92% English-only · Spanish 7%
Political lean MEDSL · Jackson
- 2024 margin
- D (+19.3) · D 58.9% · R 39.5% · Other 1.6%
- 2008→2024 swing
- -6.1pp toward R · 2008: 25.4pp · 2024: 19.3pp
- All cycles
- 2024: D+19.3 2020: D+22.0 2016: D+16.6 2012: D+19.0 2008: D+25.4
Not yet ingested
- Civics
- —
Market trends
- HPI YoY
- ▼ -73.32%
- Current HPI
- 267.491
- Rent YoY
- ▲ 4.42%
- Metro
- Kansas City, MO-KS
- State GDP YoY
- ▲ 1.84%
- F500 in state
- 20
Industry mix (Fortune 500 HQ in MO)
| Industry | F500 HQs | Revenue |
|---|---|---|
| Healthcare | 1 | $163B |
|
||
| Insurance | 1 | $21B |
|
||
| Industrial Technology | 1 | $17B |
|
||
| Retail | 1 | $16B |
|
||
| Industrial Distribution | 1 | $10B |
|
||
| Utilities | 1 | $9B |
|
||
Price history
+200.0% since first listed31 events — show timeline
- 2026-04-22 Price Changed $99,000 Heartland MLS as Distributed by MLS Grid
- 2025-10-02 Listed $105,000 Heartland MLS as Distributed by MLS Grid
- 2025-10-02 Coming Soon $105,000 Heartland MLS as Distributed by MLS Grid
- 2025-09-30 Listing Removed — Heartland MLS as Distributed by MLS Grid
- 2025-06-10 Price Changed $120,000 Heartland MLS as Distributed by MLS Grid
- 2025-05-22 Listed $123,000 Heartland MLS as Distributed by MLS Grid
- 2025-04-30 Listing Removed — Heartland MLS as Distributed by MLS Grid
- 2025-04-09 Relisted — Heartland MLS as Distributed by MLS Grid
- 2025-02-20 Listing Removed — Heartland MLS as Distributed by MLS Grid
- 2024-11-07 Relisted — Heartland MLS as Distributed by MLS Grid
- 2024-10-02 Pending — Heartland MLS as Distributed by MLS Grid
- 2024-09-16 Price Changed $123,000 Heartland MLS as Distributed by MLS Grid
- 2024-05-16 Price Changed $125,000 Heartland MLS as Distributed by MLS Grid
- 2024-04-04 Listed $135,000 Heartland MLS as Distributed by MLS Grid
- 2020-10-07 Sold (Public Records) — Public Records
- 2020-10-07 Sold (Public Records) — Public Records
- 2020-10-07 Sold (Public Records) — Public Records
- 2020-01-29 Sold (Public Records) — Public Records
- 2019-06-18 Sold (Public Records) — Public Records
- 2019-05-15 Sold (Public Records) — Public Records
- 2019-01-04 Sold (Public Records) — Public Records
- 2018-11-20 Sold (Public Records) — Public Records
- 2018-06-20 Sold (Public Records) — Public Records
- 2006-08-22 Sold (Public Records) — Public Records
- 2006-08-21 Sold (MLS) — Heartland MLS as Distributed by MLS Grid
- 2005-12-31 Listed $32,000 Heartland MLS as Distributed by MLS Grid
- 2005-05-19 Sold (Public Records) — Public Records
- 2005-03-18 Sold (Public Records) — Public Records
- 2005-03-11 Sold (MLS) — Heartland MLS as Distributed by MLS Grid
- 2004-10-11 Listed $33,000 Heartland MLS as Distributed by MLS Grid
- 1984-09-01 Sold (Public Records) — Public Records
Property tax history
+7.4%/yrLatest (2025): $485 · -24.4% YoY. Source: county tax records.
Cash-flow waterfall
monthlySold comps — $/sqft
last 12 mo · ≤1 miLoading sold comps…