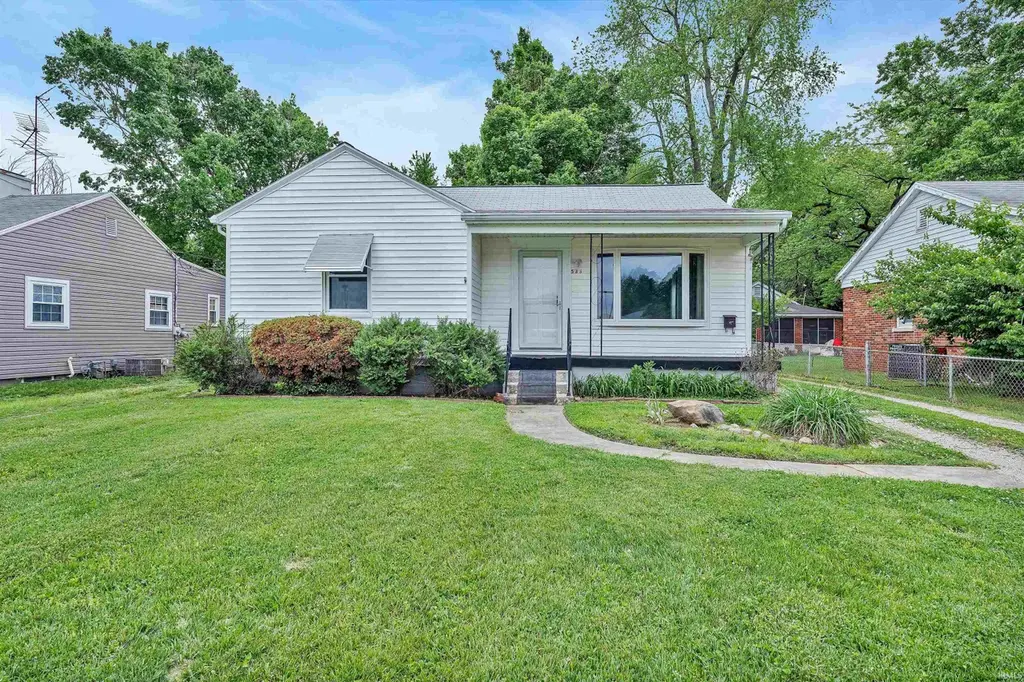
535 S Congress Ave · Evansville, IN
Flood risk 1/10 · Minimal
- FEMA flood zone
- X (unshaded)
- Chance of flooding over 30 yrs
- 0.0%
- Est. flood insurance / yr
- $473 – $860
Fire risk 1/10 · Minimal
- Est. fire insurance / yr
- $717 – $1,331
Heat risk 5/10 · Moderate
- Hot days now (above 107°F)
- 7 days/yr
- Hot days in 30 yrs
- 19 days/yr
Wind risk 2/10 · Minimal
- Chance of severe wind over 30 yrs
- 3.0%
Air-quality risk 3/10 · Minor
- Unhealthy air days now
- 3 days/yr
- Unhealthy air days in 30 yrs
- 4 days/yr
Risk factors via First Street. Map © Google.
Why this score? — see what drove the F grade
The composite is a weighted blend of 9 inputs, each scored 0–100. Each bar is that input's sub-score; the figure is the points it added to the 100-point composite (weight × sub-score).
- ARV discount +9.2/15.0
- Cash flow +7.9/30.0
- Rent growth +4.5/5.0
- Schools +3.3/10.0
- Livability +3.2/5.0
- Condition / age +2.5/5.0
- 1% rule +2.4/10.0
- DSCR +2.0/10.0
- Appreciation +0.0/10.0
$145,000
🖨 Deal sheet (PDF) 📄 Offer letter ✓ Due diligence
Listing remarks
Sweet and well-maintained, this 2-bedroom ranch offers a partly finished basement, detached garage, carport, and an extra-deep, park-like lot backing up to the State Hospital grounds. This property provides both privacy and outdoor space to enjoy. Updates per Seller: water heater, central air, replacement windows, house roof, washer and dryer, step-in shower, and more! The bright and cheerful living room welcomes you in, per owner, there are hardwood floors under the carpet. The kitchen features classic oak cabinetry. and a cozy dining area connects the kitchen and living room. Downstairs, the full basement provides additional living space with a large family room—perfect for gatherin
Key facts
- Carport
- Extra-deep lot
- Park-like lot
Tags
Property features AI
Exterior
- Parking: Detached garage with garage door opener (1 garage space); Gravel parking
- Utilities: Public water; Public sewer; Cable available
- Home design: Single-family site-built home; One story
- Construction: Vinyl siding; Block foundation; Built as site-built construction
- Exterior features: Porch; Wooded lot; Chain link fencing (full)
Interior
- Kitchen: Dishwasher; Refrigerator; Electric range
- Bedrooms: Total of 5 rooms (configuration unspecified)
- Flooring: Hardwood; Carpet; Vinyl
- Bathrooms: 1 full bathroom (main level)
- Heating & cooling: Natural gas forced-air heating; Central air conditioning; Has heating and cooling
- Interior features: Laminate counters; Sump pump in basement; Partially finished full basement
- Laundry & utility: Washer and dryer included; Laundry located in basement; Gas water heater
Neighborhood map
What this means for you Summary
Snapshot
- This is a 2-bed/1.0-bath single-family listed at $145k.
Deal economics
- At list price, monthly cash flow is $-155 ($-2k/yr) — negative.
- To cash-flow at today's rent, offer at most $123k (15.5% below list).
- To meet the 1% rule (rent ≥ 1% of price), the offer needs to be $107k (26.0% below list).
- Recommended offer: $107k (26.0% below list) — sets the bar for 1% rule.
Location & tenants
- Location reads 63/100 on livability (#416 in IN) — a middle-class / working-renter tenant base. Strengths: cost of living A+, housing A+, health & safety A+; Watch: crime F, commute F, employment D-.
- Evansville Vanderburgh School Corporation (urban): math 36% / reading 43% proficiency, ranked #153 of 301 in IN (top 51%) — families likely to look elsewhere, expect single-tenant / working-renter base with shorter leases.
- Zoned schools: Hebron Elementary School (math 37% / reading 35%, grade F, #577 of 994 statewide, top 59%, 758 students, 56% FRL); Plaza Park International Prep Acad (math 27% / reading 37%, grade F, #190 of 330 statewide, top 59%, 650 students, 65% FRL); William Henry Harrison High School (math 29% / reading 54%, grade F, #211 of 369 statewide, top 58%, 1,158 students, 61% FRL).
- Market conditions: Rents rising fast (+7.9%/yr); 191 active listings in the ZIP; 23 comparable units currently listed for rent nearby; rentals at typical pace (median 23d on market — plan ~3-4 weeks tenant-placement turnaround); 508 units permitted in Vanderburgh County in 2024 (32 in 5+ unit buildings).
Forward outlook
- Local home prices are declining (-3.0%/yr); year-one equity from $1k of loan paydown is wiped out by about $4k of value loss. Plan a longer hold.
Negotiation context
- Only 3 days on market — expect competitive offers; lowballing is unlikely to land.
Risks & watch-outs
- Watch-outs: built in 1943 — expect roof / HVAC / electrical / plumbing capex.
- Climate carrying-cost: extreme-heat days projected 7→19/yr by 2055 (HVAC capex compounding) — expect insurance premiums to compound above CPI over the hold.
Questions for the listing agent
- What do current leases actually rent for vs. the listed asking? Can we see a recent rent roll and the last 12 months of T-12 income?
- Built in 1943 — when were the roof, HVAC, electrical panel, plumbing, and water heater last replaced?
- Is there a deadline driving the sale (1031 exchange, divorce, estate, relocation)? That informs how much negotiation room exists.
- Schools are D-rated, which usually means shorter tenancies and higher turnover. Who's the typical renter profile here, and what's been the actual vacancy rate?
- Crime grade is F in this area — have there been break-ins, vandalism, or insurance claims at this property in the last 3 years? What carrier currently insures it and at what premium?
- The area grade is low — what's the realistic commute time and amenity access for the typical tenant pool here? Any planned neighborhood developments (good or bad) we should know about?
- What's the average days-on-market for RENTAL listings here right now (not sales)? A rising rental-DOM trend means longer vacancies and softer asking-rent achievability than the comps imply.
- What's the recent tenant-quality profile in this submarket — average credit score on applications, eviction rate, late-payment / NSF rate, and stable-employment percentage? A property-management company in the area should have these aggregated.
- How much new for-sale + rental construction is in the pipeline within 1–3 miles? Heavy new supply typically softens prices + rents 12–24 months out; constrained supply supports both.
Investment metrics
- 1% rule
- 0.74% ✗
- Cap rate
- 5.01%
- Cash-on-cash
- -4.58%
- DSCR
- 0.80
- GRM
- 11.3
CMA / ARV
- ARV (on-the-fly)
- $150,660
- Comps found
- 7
Show comp detail 7 sales within ~0.75 mi
| Address | Dist | Beds/Ba | Sqft | Sold | Price | $/sf | Match |
|---|---|---|---|---|---|---|---|
| 417 S Congress Ave | 0.10mi | 2/1.0 | 900 (-3%) | 15mo | $109,000 | $121 | 78 |
| 207 S Iroquois Dr | 0.26mi | 2/1.0 | 864 (-7%) | 13mo | $140,000 | $162 | 65 |
| 214 S Congress Ave | 0.23mi | 2/1.0 | 800 (-14%) | 16mo | $130,500 | $163 | 53 |
| 3115 Bellemeade Ave | 0.72mi | 2/1.0 | 1,003 (+8%) | 2mo | $192,000 | $191 | 52 |
| 417 Vann Ave | 0.69mi | 1/1.0 (-1) | 902 (-3%) | 16mo | $45,000 | $50 | 44 |
| 3107 Lincoln Ave | 0.71mi | 2/1.0 | 1,020 (+10%) | 20mo | $188,500 | $185 | 34 |
| 415 Vann Ave | 0.69mi | 1/1.0 (-1) | 832 (-10%) | 16mo | $45,000 | $54 | 32 |
Match score weights: distance 35% · size 25% · config 20% · recency 20%. Top-matched comps best support the ARV.
Projected returns pro-forma
-3.0% appreciation · 7.86% rent growth · sell at horizon
- IRR
- -18.8%
- Equity multiple
- 0.31×
- Total profit
- $-27,844
- Equity at exit
- $21,620
- IRR
- -3.7%
- Equity multiple
- 0.71×
- Total profit
- $-11,920
- Equity at exit
- $12,537
Cash invested: $40,600 (down + closing). Projections, not guarantees.
Landlord ↔ Tenant lean methodology
- Overall (STATE)
- 90 Strongly Landlord-Friendly
- State Indiana
- 90 Strongly Landlord-Friendly · R+11
- County
- — inherits STATE
- City
- — inherits STATE
ZIP-level market 47714
- Rents YoY
- 7.9%
- Active inventory
- 191
- Price-to-rent
- 11.3×
Monthly cashflow live
- Estimated rent
- $1,072 high interval (Pro) →
- Mortgage (P&I)
- −$760
- Tax est. 1.5%
- −$181 /mo · $2,175/yr
- Insurance
- −$60
- HOA
- −$0
- Vacancy / Maint / Mgmt
- −$225
- Net cashflow
- $-155
Break-even live
Sensitivity live
| Price | -10% $-55 | -5% $-105 | +0% $-155 | +5% $-205 | +10% $-255 |
|---|---|---|---|---|---|
| Rent | -10% $-240 | -5% $-197 | +0% $-155 | +5% $-113 | +10% $-70 |
| Rate | -1.0pp $-82 | -0.5pp $-118 | base $-155 | +0.5pp $-192 | +1.0pp $-231 |
UW: 25.0% down · 7.5% · 30yr · 1.5% tax · 5.0% vac · 8.0% maint · 8.0% mgmt
Financing live
Cash to close
- Down payment
- $36,250
- Closing costs
- $4,350
- Reserves months
- —
- Total cash needed
- —
Loan-product check · same deal, 3 products live
Conventional
25% down · 7.5% · 30yr
- Down + closing
- —
- Monthly P&I
- —
- Monthly cashflow
- —
- DSCR
- —
- Eligible?
- —
Personal DTI + credit; lowest rate.
DSCR
20% down · 8.5% · 30yr
- Down + closing
- —
- Monthly P&I
- —
- Monthly cashflow
- —
- DSCR
- —
- Eligible?
- —
No personal income docs; deal must DSCR.
Hard money
10% down · 12.0% · 12mo
- Down + closing
- —
- Monthly P&I
- —
- Monthly cashflow
- —
- DSCR
- —
- Eligible?
- —
Short-term bridge; refi at stabilization.
Rent comps 23 comps
| Address | Beds | Baths | Sqft | Rent | $/sqft | DOM | Units | Dist |
|---|---|---|---|---|---|---|---|---|
| 3951 Bellemeade Ave Unit D Evansville, IN | 2.0 | 1.0 | 825 | $1,100 | $1.33 | 22d | 1 | 0.35mi |
| 665 Saint Mary's Dr Unit 3 Evansville, IN | 1.0 | 1.0 | 550 | $900 | $1.64 | 22d | 1 | 0.43mi |
| 950 S Hebron Ave Apt 301 Evansville, IN | 2.0 | 1.0 | 1088 | $1,900 | $1.75 | 22d | 1 | 0.50mi |
| 700 Chateau Dr Evansville, IN | 2.0 | 1.0 | 825 | $695 | $0.84 | 15d | 2 | 0.51mi |
| 4982 Tippecanoe Dr Evansville, IN | 1.0–2.0 | 1.0 | 897 | $910 | $1.01 | 15d | 3 | 0.54mi |
| 815 Erie Ave Evansville, IN | 1.0–2.0 | 1.0–2.5 | 1038 | $1,349 | $1.30 | 15d | 17 | 0.63mi |
| 1165 Shiloh Sq Evansville, IN | 1.0–2.0 | 1.0–2.0 | 907 | $1,145 | $1.26 | 15d | 15 | 0.78mi |
| 1100 Erie Ave Evansville, IN | 1.0–3.0 | 1.0–2.0 | 962 | $1,188 | $1.23 | 22d | 2 | 0.88mi |
| 5560 E Virginia St Evansville, IN | 1.0 | 1.0 | 773 | $899 | $1.16 | 22d | 1 | 0.88mi |
| 1290 Hatfield Dr Unit 1378 Evansville, IN | 1.0 | 1.0 | 550 | $775 | $1.41 | 22d | 1 | 0.93mi |
| 1290 Hatfield Dr Unit 1330 Evansville, IN | 1.0 | 1.0 | 550 | $697 | $1.27 | 22d | 1 | 0.93mi |
| 1290 Hatfield Dr Unit 1150 Evansville, IN | 1.0 | 1.0 | 550 | $775 | $1.41 | 15d | 1 | 0.93mi |
| 1290 Hatfield Dr Unit 1266 Evansville, IN | 1.0 | 1.0 | 600 | $800 | $1.33 | 22d | 1 | 0.93mi |
| 1320 Lee Ct Evansville, IN | 1.0–4.0 | 1.0–1.5 | 1007 | $1,032 | $1.03 | 15d | 36 | 0.97mi |
| 3 Brentwood Dr Evansville, IN | 1.0 | 1.0 | 550 | $1,300 | $2.36 | 22d | 1 | 1.03mi |
| 3700 Justus Ct Evansville, IN | 1.0–2.0 | 1.0–2.0 | 790 | $975 | $1.23 | 22d | 1 | 1.05mi |
| 900 S Saint James Blvd Evansville, IN | 3.0 | 2.0 | 1118 | $1,450 | $1.30 | 22d | 1 | 1.09mi |
| 5301 Stonehedge Dr Evansville, IN | 1.0–2.0 | 1.0–2.0 | 914 | $1,170 | $1.28 | 15d | 19 | 1.12mi |
| 4689 Covert Ave Unit 4629 Evansville, IN | 2.0 | 1.0 | 725 | $775 | $1.07 | 15d | 1 | 1.16mi |
| 4689 Covert Ave Unit 4637 Evansville, IN | 1.0 | 1.0 | 610 | $695 | $1.14 | 22d | 1 | 1.16mi |
| 1621 Burdette Ave Evansville, IN | 2.0 | 1.0 | 720 | $1,050 | $1.46 | 22d | 1 | 1.16mi |
| 200 Kimber Ln Evansville, IN | 1.0–3.0 | 1.0–1.5 | 1025 | $1,149 | $1.12 | 15d | 5 | 1.25mi |
| 100 Williamsburg Dr Evansville, IN | 1.0–3.0 | 1.0–1.5 | 960 | $1,187 | $1.24 | 15d | 10 | 1.30mi |
Listing history 2 events
-
2026-05-04status Pending
-
2026-05-01$145,000 Active
ⓘ Source: listings_history table (triggers on properties + properties_extension) + one-shot
backfill from property_details.listing_events for pre-trigger history.
Climate risk First Street
- Flood 1/10 Low FEMA zone X (unshaded) · 0% chance over 30 yrs
- Wildfire 1/10 Low
- Heat 5/10 Major 7 d/yr ≥107°F today · 19 d/yr by 30 yrs out
- Wind 2/10 Low 3% chance of damaging wind over 30 yrs
- Air quality 3/10 Moderate 3 unhealthy d/yr today · 4 by 30 yrs out
Nearby sold comps map
Loading sold comps map…
Walkable amenities ~0.75 mi
Loading nearby amenities…
Taxation est. · year 1
- Rental income
- $12,868
- − Mortgage interest
- −$8,122
- − Property taxes
- −$2,175
- − Insurance
- −$725
- − Repairs & maintenance
- −$1,029
- − Management
- −$1,029
- − Depreciation
- −$4,218
- Taxable loss
- −$4,431
- Est. tax savings @ 24.0%
- +$1,063
- After-tax cash flow
- $-795/yr
For passive investors: Depreciation is non-cash, so a rental often shows a tax loss while cash-flowing — sheltering income. Rental losses are passive: they offset passive income freely, and up to $25,000/yr can offset ordinary (W-2) income if you actively participate and your MAGI is under $100k (phasing out to $0 by $150k); unused losses carry forward. On sale, claimed depreciation is recaptured at up to 25%, and gains may owe capital-gains tax (a 1031 exchange can defer both). Figures are a year-1 estimate at your 24.0% rate — not tax advice; consult a CPA.
Schools (NCES district)
- District
- Evansville Vanderburgh School Corporation
- NCES district ID
- 1803450
- Math proficiency
- 36% ▼ -7.00%
- Reading proficiency
- 43% ▼ -3.00%
- Median HH income
- $43,270
- Composite
- 33.41/100
- National rank
- #5471
- State rank
- #153 of 301 in IN
Livability — Evansville
- Score
- 63/100
- State rank
- #416
- US rank
- #15047
Category grades
Schools grade is shown separately in the Schools card above.
Census & demographics
- Census place
- Evansville, IN
- County
- Vanderburgh County · 146,793 people
- City population
- 146,793
- Metro
- Evansville, IN-KY
- Population (ZIP)
- 32,132
- Household income
- $55,910
- Rent vs Own
- Severe rent burden
- 1394.0
Population outlook (Vanderburgh County) Hauer SSP2
- Today (2025)
- 187,038 people
- By 2030
- 188,907 · +1.0%
- By 2040
- 190,272 · +1.7%
- By 2050
- 188,871 · +1.0%
- By 2075
- 180,751 · -3.4%
- By 2100
- 163,015 · -12.8%
Race, ethnicity, and origin ACS 2023
- Neighborhood character
- Predominantly White (71%)
- Race & ethnicity
- White 71% Black 17% Two or more races 6% Hispanic / Latino 6% Asian 1%
- Hispanic origin (detail)
- Mexican 3%
- Common ancestry
- Italian 3% Lithuanian 2% Slovak 1%
- Foreign-born
- 6% · Canada, China
- Languages at home
- 92% English-only · Spanish 4% Other Asian/Pacific 1% French/Haitian/Cajun 1%
Political lean MEDSL · Vanderburgh
- 2024 margin
- R (+12.7) · D 43.0% · R 55.6% · Other 1.4%
- 2008→2024 swing
- -15.1pp toward R · 2008: 2.5pp · 2024: -12.7pp
- All cycles
- 2024: R+12.7 2020: R+9.6 2016: R+16.9 2012: R+10.8 2008: D+2.5
Not yet ingested
- Civics
- —
Market trends
- HPI YoY
- ▼ -124.80%
- Current HPI
- 211.1755
- Rent YoY
- ▲ 7.86%
- Metro
- Evansville, IN-KY
- State GDP YoY
- ▲ 2.90%
- F500 in state
- 18
Industry mix (Fortune 500 HQ in IN)
| Industry | F500 HQs | Revenue |
|---|---|---|
| Industrial Machinery | 2 | $37B |
|
||
| Healthcare | 1 | $177B |
|
||
| Pharmaceuticals | 1 | $45B |
|
||
| Metals / Steel | 1 | $18B |
|
||
| Agriculture | 1 | $17B |
|
||
| Packaging | 1 | $12B |
|
||
Price history
2 events — show timeline
- 2026-05-04 Pending — IRMLS
- 2026-05-01 Listed $145,000 IRMLS
Property tax history
-5.1%/yrLatest (2024): $67 · +2.0% YoY. Source: county tax records.
Cash-flow waterfall
monthlySold comps — $/sqft
last 12 mo · ≤1 miLoading sold comps…