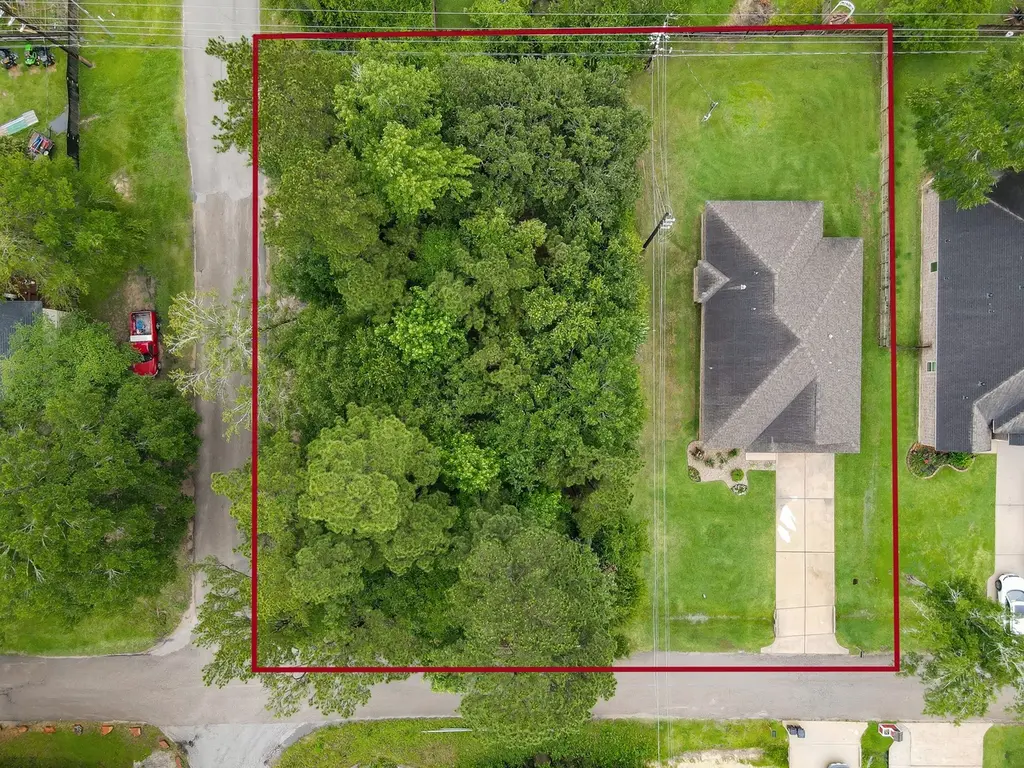
28626 Champion Oaks Dr · The Woodlands, TX
Flood risk 4/10 · Minor
- FEMA flood zone
- X (unshaded)
- Chance of flooding over 30 yrs
- 0.2%
- Est. flood insurance / yr
- $507 – $1,088
Fire risk 3/10 · Minor
- Est. fire insurance / yr
- $1,222 – $2,270
Heat risk 8/10 · Major
- Hot days now (above 111°F)
- 7 days/yr
- Hot days in 30 yrs
- 24 days/yr
Wind risk 8/10 · Major
- Chance of severe wind over 30 yrs
- 99.0%
Air-quality risk 2/10 · Minimal
- Unhealthy air days now
- 2 days/yr
- Unhealthy air days in 30 yrs
- 2 days/yr
Risk factors via First Street. Map © Google.
Why this score? — see what drove the F grade
The composite is a weighted blend of 9 inputs, each scored 0–100. Each bar is that input's sub-score; the figure is the points it added to the 100-point composite (weight × sub-score).
- Appreciation +10.0/10.0
- Cash flow +5.4/30.0
- Livability +4.5/5.0
- Schools +3.9/10.0
- Rent growth +2.6/5.0
- Condition / age +2.5/5.0
- 1% rule +1.1/10.0
- DSCR +0.0/10.0
- ARV discount +0.0/15.0
$339,900
🖨 Deal sheet 📄 Offer letter ✓ Due diligence
Listing remarks MLS
MOVE IN TEADY! NEW CONSTRUCTION, LOW TAXES, NO HOA, NO MUD. Spacious open concept w/ granite throughout, energy saving features, stainless appliances in AWARD WINNING MAGNOLIA ISD. FEATURES LARGE BACK PATIO. Quaint neighborhood, backs up to upscale Ascott Farms and Hidden Lake Estates. Walking distance to Smith Elementary. Minutes from Bear Branch Jr. High. Quick access to Tomball, The Woodlands and 2978. House is on 2 lots. Perfect for a shop or barn. +- half an acre.
Key facts
- Ravine
- Forest of trees
- Camping area
Tags
Property features AI
Finance
- Other: Lease not considered
Exterior
- Parking: Attached garage with 2 spaces
- Security: Smoke detector(s)
- Utilities: Public water; Public sewer
- Home design: Residential property; Built in 2018; Slab foundation; Composition roof
- Construction: Brick, cement siding, and wood siding exterior
- Exterior features: Covered patio; Patio; Private yard; Corner lot; Ravine; Wooded yard; Side yard; Asphalt road access
Interior
- Kitchen: Dishwasher; Electric oven; Electric range; Disposal; Microwave
- Bedrooms: Primary bedroom (first floor) — 15x13; Bedroom (first floor) — 12x10; Bedroom (first floor) — 12x10
- Flooring: Carpet; Tile
- Bathrooms: 2 full bathrooms
- Heating & cooling: Central heating (electric); Central air (electric)
- Interior features: Breakfast bar; Double vanity; Granite counters; Kitchen/family room combo; Pantry; Tub with shower; Window treatments; Ceiling fans
- Laundry & utility: Washer hookup; Electric dryer hookup
Neighborhood map
What this means for you Summary
Snapshot
- This is a 3-bed/2.0-bath single-family listed at $340k.
Deal economics
- At list price, monthly cash flow is $-733 ($-9k/yr) — negative.
- To cash-flow at today's rent, offer at most $210k (38.1% below list).
- To meet the 1% rule (rent ≥ 1% of price), the offer needs to be $206k (39.4% below list).
- Recommended offer: $206k (39.4% below list) — sets the bar for 1% rule.
- Cap rate 3.7% vs local median 2.3% in The Woodlands — top-decile yield for the area; either an underpriced asset or a hidden risk that comps aren't pricing in. Stress-test before assuming the spread holds.
Location & tenants
- Location reads 91/100 on livability (#1 in TX, #47 nationally) — a professional / high-income tenant draw. Strengths: amenities A+, commute A+, employment A+; Watch: cost of living D-.
- Magnolia ISD (rural): math 42% / reading 45% proficiency, ranked #247 of 826 in TX (top 30%) — families likely to look elsewhere, expect single-tenant / working-renter base with shorter leases.
- Zoned schools: Cedric C Smith (math 48% / reading 42%, grade D-, #1,133 of 4,322 statewide, top 27%, 724 students, 55% FRL); Bear Branch J H (math 44% / reading 46%, grade D, #479 of 1,662 statewide, top 29%, 1,076 students, 37% FRL); Magnolia H S (math 47% / reading 62%, grade C-, #379 of 1,632 statewide, top 26%, 2,248 students, 31% FRL) — zoned schools at 41% FRL track the district average.
- Market conditions: Rents flat; 1604 active listings in the ZIP; 11 comparable units currently listed for rent nearby; rentals leasing fast (median 10d on market — plan ~1-2 weeks tenant-placement turnaround); high-income renter base; 13,259 units permitted in Montgomery County in 2024 (1,402 in 5+ unit buildings).
Forward outlook
- In year one you build about $36k of equity ($2k loan paydown + $34k appreciation (10.0% local appreciation)).
- Montgomery County population projected at +65% by 2050 — long-run rental-demand tailwind backs the buy-and-hold thesis.
- By year 2, paydown + projected appreciation supports a ~$58k cash-out refi (75% LTV) — recoverable capital for the next deal without selling this one.
Negotiation context
- Only 10 days on market — expect competitive offers; lowballing is unlikely to land.
- 2 sale attempts since 8y ago with the ask held roughly flat each time — persistent listings suggest the price (not the market) is what's stuck; bring a comps-based counter.
Risks & watch-outs
- Climate carrying-cost: severe wind risk, 99% chance of damaging wind over 30y; extreme-heat days projected 7→24/yr by 2055 (HVAC capex compounding) — expect insurance premiums to compound above CPI over the hold.
Questions for the listing agent
- What do current leases actually rent for vs. the listed asking? Can we see a recent rent roll and the last 12 months of T-12 income?
- Is there a deadline driving the sale (1031 exchange, divorce, estate, relocation)? That informs how much negotiation room exists.
- Schools are A-rated — typically a magnet for longer-tenancy family renters. What's the average tenant stay here, and is there a school-zone premium baked into asking?
- The area grade is low — what's the realistic commute time and amenity access for the typical tenant pool here? Any planned neighborhood developments (good or bad) we should know about?
- What's the average days-on-market for RENTAL listings here right now (not sales)? A rising rental-DOM trend means longer vacancies and softer asking-rent achievability than the comps imply.
- What's the recent tenant-quality profile in this submarket — average credit score on applications, eviction rate, late-payment / NSF rate, and stable-employment percentage? A property-management company in the area should have these aggregated.
- How much new for-sale + rental construction is in the pipeline within 1–3 miles? Heavy new supply typically softens prices + rents 12–24 months out; constrained supply supports both.
Investment metrics
- 1% rule
- 0.61% ✗
- Cap rate
- 3.70%
- Cash-on-cash
- -9.24%
- DSCR
- 0.59
- GRM
- 13.8
CMA / ARV
- ARV (on-the-fly)
- $284,868
- Comps found
- 12
Show comp detail 12 sales within ~0.75 mi
| Address | Dist | Beds/Ba | Sqft | Sold | Price | $/sf | Match |
|---|---|---|---|---|---|---|---|
| 28831 Hidden Cove Dr | 0.22mi | 3/2.0 | 1,705 (-2%) | 2mo | $280,000 | $164 | 85 |
| 9206 Hidden Lk E | 0.25mi | 3/2.0 | 1,814 (+4%) | 3mo | $275,000 | $152 | 79 |
| 28702 Champion Oaks Dr | 0.04mi | 4/2.0 (+1) | 1,908 (+10%) | 3mo | $249,000 | $131 | 74 |
| 9115 E Lakeside Dr | 0.30mi | 3/2.0 | 1,694 (-2%) | 11mo | $305,000 | $180 | 73 |
| 28730 Hidden Cove Dr | 0.14mi | 3/2.0 | 1,783 (+3%) | 21mo | $305,000 | $171 | 72 |
| 28622 Champion Oaks Dr | 0.01mi | 3/2.0 | 1,973 (+14%) | 7mo | $265,000 | $134 | 71 |
| 9214 Hidden Ct | 0.32mi | 3/2.0 | 1,687 (-3%) | 11mo | $265,000 | $157 | 71 |
| 9218 E Lakeside Dr | 0.28mi | 3/2.0 | 1,563 (-10%) | 2mo | $259,500 | $166 | 69 |
| 9314 E Lakeside Dr | 0.24mi | 3/2.0 | 1,867 (+8%) | 13mo | $275,000 | $147 | 66 |
| 28910 Champion Oaks Dr | 0.27mi | 3/2.0 | 1,850 (+6%) | 15mo | $374,900 | $203 | 64 |
| 28434 Champion Oaks Dr | 0.19mi | 3/2.0 | 1,967 (+13%) | 13mo | $365,000 | $186 | 58 |
| 28906 Champion Oaks Dr | 0.26mi | 3/2.0 | 1,483 (-15%) | 10mo | $215,000 | $145 | 55 |
Match score weights: distance 35% · size 25% · config 20% · recency 20%. Top-matched comps best support the ARV.
Projected returns pro-forma
10.0% appreciation · 0.32% rent growth · sell at horizon
- IRR
- 17.2%
- Equity multiple
- 2.40×
- Total profit
- $133,051
- Equity at exit
- $306,209
- IRR
- 15.8%
- Equity multiple
- 5.40×
- Total profit
- $418,791
- Equity at exit
- $660,351
Cash invested: $95,172 (down + closing). Projections, not guarantees.
Landlord ↔ Tenant lean methodology
- Overall (STATE)
- 87 Strongly Landlord-Friendly
- State Texas
- 87 Strongly Landlord-Friendly · R+5
- County
- — inherits STATE
- City
- — inherits STATE
ZIP-level market 77354
- Home prices YoY
- 2.4%
- Rents YoY
- 0.3%
- Active inventory
- 1604
- Price-to-rent
- 13.8×
Monthly cashflow live
- Estimated rent
- $2,060 high interval (Pro) →
- Mortgage (P&I)
- −$1,782
- Tax from tax record
- −$436 /mo · $5,237/yr
- Insurance
- −$142
- HOA
- −$0
- Vacancy / Maint / Mgmt
- −$433
- Net cashflow
- $-733
Break-even live
UW: 25.0% down · 7.5% · 30yr · 1.5% tax · 5.0% vac · 8.0% maint · 8.0% mgmt
Financing live
Cash to close
- Down payment
- $84,975
- Closing costs
- $10,197
- Reserves months
- —
- Total cash needed
- —
Loan-product check · same deal, 3 products live
Conventional
25% down · 7.5% · 30yr
- Down + closing
- —
- Monthly P&I
- —
- Monthly cashflow
- —
- DSCR
- —
- Eligible?
- —
Personal DTI + credit; lowest rate.
DSCR
20% down · 8.5% · 30yr
- Down + closing
- —
- Monthly P&I
- —
- Monthly cashflow
- —
- DSCR
- —
- Eligible?
- —
No personal income docs; deal must DSCR.
Hard money
10% down · 12.0% · 12mo
- Down + closing
- —
- Monthly P&I
- —
- Monthly cashflow
- —
- DSCR
- —
- Eligible?
- —
Short-term bridge; refi at stabilization.
Rent comps 11 comps
| Address | Beds | Baths | Sqft | Rent | $/sqft | DOM | Units | Dist |
|---|---|---|---|---|---|---|---|---|
| 29980 Farm to Market Road 2978 Unit 2162 Magnolia, TX | 2.0 | 2.0 | 1177 | $1,883 | $1.60 | 4d | 1 | 1.21mi |
| 29980 Farm to Market Road 2978 Unit 2228 Magnolia, TX | 2.0 | 2.0 | 1177 | $1,875 | $1.59 | 2d | 1 | 1.21mi |
| 29980 Farm to Market Road 2978 Unit 3228 Magnolia, TX | 3.0 | 2.0 | 1578 | $2,328 | $1.48 | 2d | 1 | 1.21mi |
| 9829 Glen Brook Ln Magnolia, TX | 4.0 | 2.0 | 1637 | $1,999 | $1.22 | 2d | 1 | 1.27mi |
| 30006 Farm to Market Road 2978 Magnolia, TX | 2.0 | 1.0 | 1088 | $1,766 | $1.62 | 43d | 1 | 1.29mi |
| 9733 Grosbeak Ln Magnolia, TX | 3.0 | 2.0 | 1302 | $1,798 | $1.38 | 43d | 1 | 1.32mi |
| 29980 Farm to Market Road 2978 Unit 3047 Magnolia, TX | 3.0 | 2.0 | 1578 | $2,371 | $1.50 | 10d | 1 | 1.34mi |
| 29980 Farm to Market Road 2978 Unit 2047 Magnolia, TX | 2.0 | 2.0 | 1177 | $1,918 | $1.63 | 10d | 1 | 1.34mi |
| 29980 Farm to Market Road 2978 Unit 30017 Magnolia, TX | 2.0 | 2.0 | 1177 | $1,907 | $1.62 | 10d | 1 | 1.36mi |
| 29980 Farm to Market Road 2978 Unit 30013 Magnolia, TX | 3.0 | 2.0 | 1578 | $2,360 | $1.50 | 10d | 1 | 1.36mi |
| 30000 FM 2978 Rd Magnolia, TX | 1.0–4.0 | 1.0–4.0 | 1175 | $1,767 | $1.50 | 3d | 49 | 1.39mi |
Listing history 8 events
-
2026-06-13days on market $339,900 Pending 10 DOM
-
2026-06-09days on market $339,900 Pending 8 DOM
-
2026-06-08statusdays on market $339,900 Pending 7 DOM
-
2026-06-07days on market $339,900 Active 6 DOM
-
2026-06-04days on market $339,900 Active 3 DOM
-
2026-06-03days on market $339,900 Active 2 DOM
-
2026-06-02remarks 681-char remark
-
2026-06-02$339,900 Active 1 DOM
ⓘ Source: listings_history table (triggers on properties + properties_extension) + one-shot
backfill from property_details.listing_events for pre-trigger history.
Tax reassessment forecast TX · Resets to sale price
- Current annual tax
- $5,237 · $436/mo
- Projected year-2 tax
- $6,220 · $518/mo
- Expected delta
- +$984/yr (+$82/mo · 18.8%)
ⓘ Screening estimate from a state-policy table — verify with the county assessor before closing.
Climate risk First Street
- Flood 4/10 Moderate FEMA zone X (unshaded) · 20% chance over 30 yrs
- Wildfire 3/10 Moderate
- Heat 8/10 Severe 7 d/yr ≥111°F today · 24 d/yr by 30 yrs out
- Wind 8/10 Severe 99% chance of damaging wind over 30 yrs
- Air quality 2/10 Low 2 unhealthy d/yr today · 2 by 30 yrs out
Nearby sold comps map
Loading sold comps map…
Walkable amenities ~0.75 mi
Loading nearby amenities…
Taxation est. · year 1
- Rental income
- $24,719
- − Mortgage interest
- −$19,040
- − Property taxes
- −$5,237
- − Insurance
- −$1,700
- − Repairs & maintenance
- −$1,977
- − Management
- −$1,977
- − Depreciation
- −$9,888
- Taxable loss
- −$15,100
- Est. tax savings @ 24.0%
- +$3,624
- After-tax cash flow
- $-5,174/yr
For passive investors: Depreciation is non-cash, so a rental often shows a tax loss while cash-flowing — sheltering income. Rental losses are passive: they offset passive income freely, and up to $25,000/yr can offset ordinary (W-2) income if you actively participate and your MAGI is under $100k (phasing out to $0 by $150k); unused losses carry forward. On sale, claimed depreciation is recaptured at up to 25%, and gains may owe capital-gains tax (a 1031 exchange can defer both). Figures are a year-1 estimate at your 24.0% rate — not tax advice; consult a CPA.
Schools (NCES district)
- District
- Magnolia ISD
- NCES district ID
- 4828740
- Math proficiency
- 42% ▼ -7.00%
- Reading proficiency
- 45% ▼ -4.00%
- Median HH income
- $71,692
- Composite
- 39.46/100
- National rank
- #3958
- State rank
- #247 of 826 in TX
Livability — The Woodlands
- Score
- 91/100
- State rank
- #1
- US rank
- #47
Category grades
Schools grade is shown separately in the Schools card above.
Census & demographics
- County
- Montgomery County · 663,713 people
- City population
- 106,505
- Metro
- Houston-The Woodlands-Sugar Land, TX
- Population (ZIP)
- 44,900
- Household income
- $112,504
- Rent vs Own
- Severe rent burden
- 586.0
Population outlook (Montgomery County) Hauer SSP2
- Today (2025)
- 713,896 people
- By 2030
- 805,263 · +12.8%
- By 2040
- 992,708 · +39.1%
- By 2050
- 1,179,590 · +65.2%
- By 2075
- 1,628,084 · +128.1%
- By 2100
- 1,937,880 · +171.5%
Race, ethnicity, and origin ACS 2023
- Neighborhood character
- Predominantly White (66%)
- Race & ethnicity
- White 66% Hispanic / Latino 25% Two or more races 18% Black 3% Asian 1%
- Hispanic origin (detail)
- Mexican 14% Puerto Rican 1%
- Common ancestry
- Lithuanian 4% Slovak 2% Italian 2%
- Foreign-born
- 11% · Canada, Vietnam
- Languages at home
- 83% English-only · Spanish 15% Other Indo-European 1% German/W. Germanic 1%
Political lean MEDSL · Montgomery
- 2024 margin
- Solid R (+45.5) · D 26.8% · R 72.3%
- 2008→2024 swing
- +7.2pp toward D · 2008: -52.7pp · 2024: -45.5pp
- All cycles
- 2024: R+45.5 2020: R+43.8 2016: R+51.4 2012: R+60.7 2008: R+52.7
Not yet ingested
- Civics
- —
Market trends
- HPI YoY
- ▲ 12.09%
- Current HPI
- 512.87
- Rent YoY
- ▲ 0.32%
- Metro
- Houston-The Woodlands-Sugar Land, TX
- State GDP YoY
- ▲ 3.95%
- F500 in state
- 110
Industry mix (Fortune 500 HQ in TX)
| Industry | F500 HQs | Revenue |
|---|---|---|
| Energy | 16 | $1,198B |
|
||
| Technology | 5 | $198B |
|
||
| Engineering / Construction | 4 | $72B |
|
||
| Energy Services | 3 | $60B |
|
||
| Utilities | 3 | $41B |
|
||
| Healthcare | 2 | $330B |
|
||
Price history
+44.6% since first listed6 events — show timeline
- 2026-06-01 Listed $339,900 HARMLS
- 2019-01-25 Sold (MLS) — HARMLS
- 2018-12-28 Pending — HARMLS
- 2018-11-02 Price Changed $225,000 HARMLS
- 2018-10-18 Price Changed $230,000 HARMLS
- 2018-10-01 Listed $235,000 HARMLS
Property tax history
+33.8%/yrLatest (2025): $5,237 · +113.4% YoY. Source: county tax records.
Cash-flow waterfall
monthlySold comps — $/sqft
last 12 mo · ≤1 miLoading sold comps…